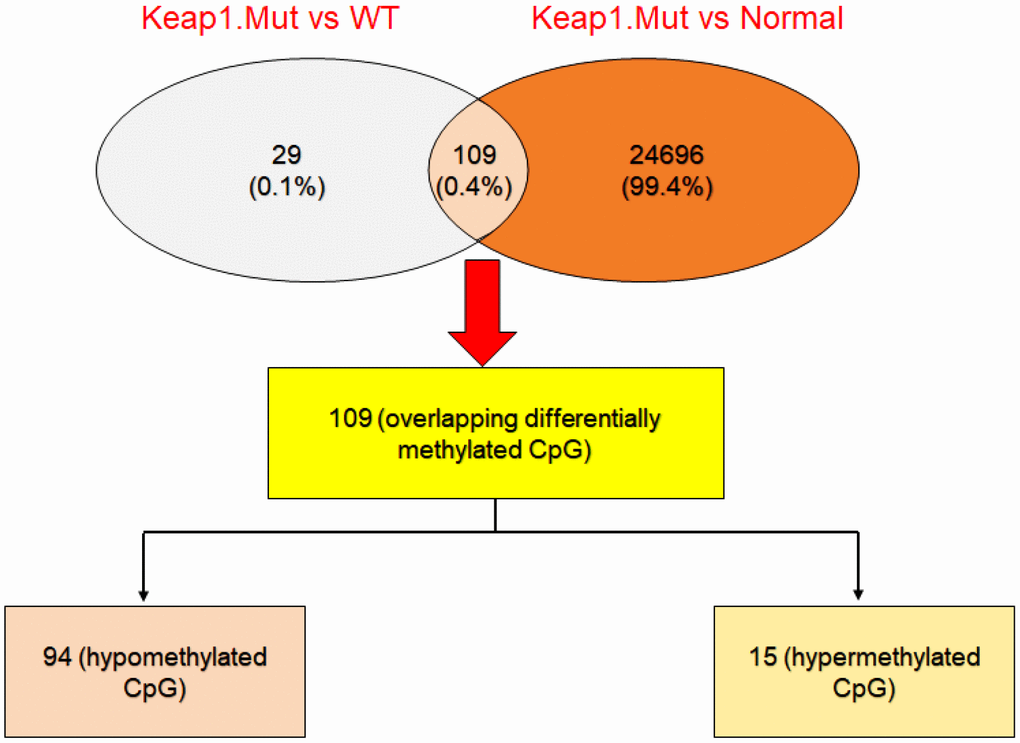
Figure 4.Integrative analysis to cross-check the differentially-methylated CpG sites in KEAP1-mutated LUAD. Venny diagram showing the differentially-methylated CpG sites overlapping between KEAP1-mutated versus wild-type and KEAP1-mutated versus normal datasets.