


Introduction
Gastric carcinoma (GC) is one of the most fatal human malignancies globally [1]. It was reported that 1 million new patients suffer from GC annually [1]. It was estimated that 784000 deaths were caused by GC globally in 2018 [1]. Endoscopic mucosal resection or endoscopic submucosal dissection is adopted for patients with early GC. Gastrectomy with D2 lymphadenectomy is suitable for locally advanced GC. A comprehensive plan including chemotherapy, immunotherapy, anti-angiogenic therapy, and trastuzumab for Her2-positive GC, improves overall survival (OS). Nonetheless median OS is within 12 months. It is believed that Helicobacter pylori (HP) infection, dinking, hereditary tendency, salted and smoked food intake, and gastroesophageal reflux disease are risk factors for GC [2]. There is an urgent need to understand genes involved in the initiation, progression, and prognosis of gastric cancer, which exhibits a high level of heterogeneity both at the molecular and phenotypic levels.
E-cadherin (E-cad) is a member of Ca2+-dependent membrane glycoprotein, encoded by CDH1 gene which is crucial for preserving epithelial cell-cell junctions and cell polarity, and suppresses tumor growth, metastasis and invasion in numerous cancers comprising GC. E-cadherin exerts its effects on the Wnt-signaling pathway by negatively regulating the quantity of unbound β-catenin, which is indispensable in the pathogenesis of GC [3, 4]. Low E-cadherin expression in GC is attributed to mutation in the CDH1 gene on chromosome 16q22.1 [5], E-cadherin promoter hypermethylation [6], and transcriptional repression resulting from Snail [7] and Sip-1 [8] binding to the CDH1-E box.
As far as the correlations between E-cad expression and clinical characteristics, as well as prognoses for patients with GC are concerned, vast amounts of work have been done but study results exhibit great diversity and inconsistency. Furthermore, the quantity of participants recruited for each research is not sufficiently large. So, this article was conducted to systematically and comprehensively evaluate its correlations.
Materials and Methods
Data retrieval
The articles published before June 30, 2023 in the PubMed, Elsevier, Embase, Cochrane Library, and Web of Science databases were systematically searched. The terms used in the search were as follows: “E-Cadherin”, “prognosis”, and “stomach neoplasms”. The reference lists of publications were retrieved by manual. Only English-language studies were encompassed in the selection process.
Criteria for inclusion and exclusion
Inclusion criteria: (1) Pathological diagnosis is GC; (2) Data about E-cadherin expression, OS, and clinical characteristics were comprehensive; (3) E-cadherin expression was detected by immunohistochemical staining, western blotting, immunofluorescence; (4) When multiple studies were published by a single author, only the one with the highest quality was included; (5) Study written in English was enrolled.
Exclusion criteria: (1) Abstracts, reviews, editorials, case reports, as well as letters; (2) Study subjects are cell lines, and animals; (3) Overlapping publication; (4) Information about E-cadherin expression, OS, as well as clinical characteristics was unavailable.
Data retrieval and compilation and evaluation of literature quality
Each study was evaluated and relevant characteristics were extracted by three reviewers (GLL, JYS and RYJ) independently. The data were presented as follows: (1) authors and publication time; (2) clinical characteristics; (3) level of evidence, (4) the rate of E-cadherin expression, (5) OS data (Table 1). Literature quality was evaluated by Newcastle-Ottawa scale (NOS) [9].
Table 1. Characteristics of studies included in the meta-analysis.
| First author and year | Country or region | Mean age | Gender (M/F) | Level of evidence | Stage | Clinicopathological features | Method | Provided- OS data | No. of patients | Reduced/total E-cadherin (%) | |||||||||||||||||||||||||||||||||||||||||||||||||||||||||||||||||||||||||||||||||||||||||
| Bahnassy [11] 2018 | Egypt | 53.2 ± 14.1 | 126/66 | 5 | NR | NR | IHC | NR | 192 | 84/192 (43.8) | |||||||||||||||||||||||||||||||||||||||||||||||||||||||||||||||||||||||||||||||||||||||||
| Saad [12] 2010 | Egypt | NR | 16/14 | 4 | I–IV | D, T | IHC | Yes | 30 | 11/30 (36.7) | |||||||||||||||||||||||||||||||||||||||||||||||||||||||||||||||||||||||||||||||||||||||||
| Ayed-Guerfali [13] 2014 | Tunisian | 55 | 45/35 | 3 | I–IV | D, T, M | IHC | Yes | 80 | 47/80 (58.8) | |||||||||||||||||||||||||||||||||||||||||||||||||||||||||||||||||||||||||||||||||||||||||
| Cai [14] 2001 | China | 63 (37–82) | 56/79 | 4 | I–II | D | IHC | NR | 135 | 77/135 (57.0) | |||||||||||||||||||||||||||||||||||||||||||||||||||||||||||||||||||||||||||||||||||||||||
| Chen [15] 2003 | China Twain | 46 (27-64) | NR | 4 | I–IV | D, M | IHC | Yes | 84 | 29/84 (34.5) | |||||||||||||||||||||||||||||||||||||||||||||||||||||||||||||||||||||||||||||||||||||||||
| Czyzewska [16] 2010 | Poland | NR | 69/29 | 4 | NR | T | IHC | Yes | 91 | 37/91 (40.7) | |||||||||||||||||||||||||||||||||||||||||||||||||||||||||||||||||||||||||||||||||||||||||
| Dong [17] 2014 | China | 60 (35–81) | 106/22 | 4 | I–III | D, T, M | IHC | Yes | 128 | 73/128 (57.0) | |||||||||||||||||||||||||||||||||||||||||||||||||||||||||||||||||||||||||||||||||||||||||
| Gabbert [18] 1996 | Germany | 64.9 (23–90) | 255/158 | 4 | I–IV | D, T | IHC | Yes | 413 | 124/413 (30.0) | |||||||||||||||||||||||||||||||||||||||||||||||||||||||||||||||||||||||||||||||||||||||||
| Guo [19] 2019 | China | 62 (40–83) | 45/24 | 5 | I–IV | D | IHC | Yes | 69 | 44/69 (63.8) | |||||||||||||||||||||||||||||||||||||||||||||||||||||||||||||||||||||||||||||||||||||||||
| Guo [20] 2014 | China | 61 (37–83) | 121/38 | 4 | I–IV | D, T | IHC | Yes | 159 | 113/159 (71.1) | |||||||||||||||||||||||||||||||||||||||||||||||||||||||||||||||||||||||||||||||||||||||||
| Hu [21] 2013 | China | 55 (30–73) | 145/44 | 3 | NR | D, T | IHC | NR | 189 | 148/189 (78.3) | |||||||||||||||||||||||||||||||||||||||||||||||||||||||||||||||||||||||||||||||||||||||||
| Hu [22] 2023 | China | 38–78 | 48/17 | 4 | I–III | D, T | IHC | Yes | 65 | 29/65 (44.6) | |||||||||||||||||||||||||||||||||||||||||||||||||||||||||||||||||||||||||||||||||||||||||
| Jawhari [23] 1997 | UK | 70 (33–84) | 62/27 | 3 | NR | D | IHC | Yes | 89 | 21/89 (23.6) | |||||||||||||||||||||||||||||||||||||||||||||||||||||||||||||||||||||||||||||||||||||||||
| Joo [24] 2000 | Korea | 55.2 ± 10.3 | 38/27 | 4 | I–IV | D, T, M | IHC | Yes | 65 | 34/65 (52.3) | |||||||||||||||||||||||||||||||||||||||||||||||||||||||||||||||||||||||||||||||||||||||||
| Joo [25] 2001 | Korea | NR | 70/44 | 3 | I–IV | D, M | IHC | Yes | 114 | 40/114 (35.1) | |||||||||||||||||||||||||||||||||||||||||||||||||||||||||||||||||||||||||||||||||||||||||
| Yi Kim [26] 2007 | Korea | 58.7 (37–83) | 38/22 | 3 | I–IV | D, M | IHC | NR | 60 | 33/60 (55) | |||||||||||||||||||||||||||||||||||||||||||||||||||||||||||||||||||||||||||||||||||||||||
| Kim [27] 2009 | Korea | 54.8 | 396/168 | 3 | NR | NR | IHC | Yes | 564 | 240/564 (42.6) | |||||||||||||||||||||||||||||||||||||||||||||||||||||||||||||||||||||||||||||||||||||||||
| LAZĂR [28] 2008 | Rumania Europe | 59.3 (30–78) | 43/18 | 3 | I–IV | D, T, M | IHC | Yes | 61 | 31/61 (50.8) | |||||||||||||||||||||||||||||||||||||||||||||||||||||||||||||||||||||||||||||||||||||||||
| Li [29] 2012 | China | 55 (25–80) | 72/42 | 3 | I–IV | D, T, M | IHC | Yes | 114 | 69/114 (60.5) | |||||||||||||||||||||||||||||||||||||||||||||||||||||||||||||||||||||||||||||||||||||||||
| Li [30] 2015 | China | 55 (28–78) | 51/18 | 4 | I–III | D, T | IHC | Yes | 69 | 27/69 (39.1) | |||||||||||||||||||||||||||||||||||||||||||||||||||||||||||||||||||||||||||||||||||||||||
| Mohamed [31] 2019 | Egypt | 53 ± 14 | 42/22 | 5 | NR | D | IHC | NR | 64 | 28/64 (43.8) | |||||||||||||||||||||||||||||||||||||||||||||||||||||||||||||||||||||||||||||||||||||||||
| Ramesh [32] 1999 | UK | 68 (57–87) | 31/9 | 3 | NR | D | IHC | NR | 40 | 30/40 (75.0) | |||||||||||||||||||||||||||||||||||||||||||||||||||||||||||||||||||||||||||||||||||||||||
| Shino [33] 1995 | Japan | 62 (24–83) | 77/44 | 4 | NR | D, M | IHC | NR | 121 | 39/121 (32.2) | |||||||||||||||||||||||||||||||||||||||||||||||||||||||||||||||||||||||||||||||||||||||||
| Song [34] 2004 | Korea | 55.8 ± 11.6 | 65/30 | 3 | I–II | D | IHC | NR | 95 | 34/95 (35.8) | |||||||||||||||||||||||||||||||||||||||||||||||||||||||||||||||||||||||||||||||||||||||||
| Sun [35] 2019 | China | 62 (29–79) | 34/21 | 4 | I–IV | D, T | IHC | Yes | 55 | 22/55 (40.0) | |||||||||||||||||||||||||||||||||||||||||||||||||||||||||||||||||||||||||||||||||||||||||
| Uchikado [36] 2011 | Japan | 65 (22–88) | 113/51 | 4 | I–IV | D, T, M | IHC | NR | 164 | 92/164 (56.1) | |||||||||||||||||||||||||||||||||||||||||||||||||||||||||||||||||||||||||||||||||||||||||
| Wang [37] 2022 | China | NR | 3607/954 | 4 | I–IV | D, T | IHC | Yes | 4561 | 725/4561 (15.9) | |||||||||||||||||||||||||||||||||||||||||||||||||||||||||||||||||||||||||||||||||||||||||
| Xu [38] 2019 | China | 59.58 (18–94) | 71/37 | 4 | I–IV | D, T, M | IHC | NR | 108 | 44/108 (40.7) | |||||||||||||||||||||||||||||||||||||||||||||||||||||||||||||||||||||||||||||||||||||||||
| Xu [39] 2016 | China | 57.8 ± 10.3 | 76/29 | 4 | I–IV | D, T | IHC | NR | 105 | 57/105 (52.4) | |||||||||||||||||||||||||||||||||||||||||||||||||||||||||||||||||||||||||||||||||||||||||
| Yonemura [40] 1995 | Japan | 63.4 (27–86) | NR | 4 | I–IV | D, T | IHC | Yes | 125 | 83/125 (66.4) | |||||||||||||||||||||||||||||||||||||||||||||||||||||||||||||||||||||||||||||||||||||||||
| Yonemura [41] 1997 | Japan | NR | NR | 4 | I–IV | D, T, M | IHC | Yes | 127 | 84/127 (66.1) | |||||||||||||||||||||||||||||||||||||||||||||||||||||||||||||||||||||||||||||||||||||||||
| Yonemura [42] 2000 | Japan | NR | NR | 3 | NR | D, T, M | IHC | Yes | 92 | 66/92 (71.7) | |||||||||||||||||||||||||||||||||||||||||||||||||||||||||||||||||||||||||||||||||||||||||
| Zhong [43] 2008 | China | 59 (33–82) | 87/31 | 3 | I–IV | D, M | IHC | Yes | 118 | 83/118 (70.3) | |||||||||||||||||||||||||||||||||||||||||||||||||||||||||||||||||||||||||||||||||||||||||
| Zhou [44] 2002 | China | 54.5 (22–77) | 123/40 | 5 | NR | D, T | IHC | Yes | 163 | 75/163 (46.0) | |||||||||||||||||||||||||||||||||||||||||||||||||||||||||||||||||||||||||||||||||||||||||
| Zhou [45] 2010 | China | 54 (30–73) | 153/47 | 3 | NR | D, T | IHC | Yes | 200 | 156/200 (78.0) | |||||||||||||||||||||||||||||||||||||||||||||||||||||||||||||||||||||||||||||||||||||||||
| Zhou [46] 2016 | China | 33.8 ± 5.47 | 52/87 | 3 | I–IV | NR | Western blot | Yes | 139 | 79/139 (56.8) | |||||||||||||||||||||||||||||||||||||||||||||||||||||||||||||||||||||||||||||||||||||||||
| Abbreviations: IHC: immunohistochemistry test; D: differentiation grade; T: depth of invasion; M: distant metastasis; OS: overall survival; NR: not reported. | |||||||||||||||||||||||||||||||||||||||||||||||||||||||||||||||||||||||||||||||||||||||||||||||||||
Statistical analysis
The Review Manager software (version 5.3) and Stata software (version 18) were utilized to generate pooled odds ratios (ORs) along with 95% confidence intervals (CIs) [10]. The associations between E-cad expression and overall survival (OS), clinicopathological features, and risk factors were evaluated. Stratification based on study origin was conducted through subgroup analysis and meta-regression [9, 10]. Funnel plots and Egger’s test were employed to evaluate publication bias. As the I² value exceeds 50%, there is considered to be significant heterogeneity. When the P-value is less than 0.05, it is deemed that statistical significance exists.
Results
Selection of trials
Figure 1 demonstrates that 36 studies met the inclusion criteria and were enrolled for analysis of the prognostic value of E-cad expression, as well as its association with clinical characteristics and risk factors for GC (of the 1985 publications, 1921 studies were excluded due to incomplete content, 16 were excluded because they lacked sufficient data to calculate OS, and 12 were excluded as their data overlapped with those of other studies).
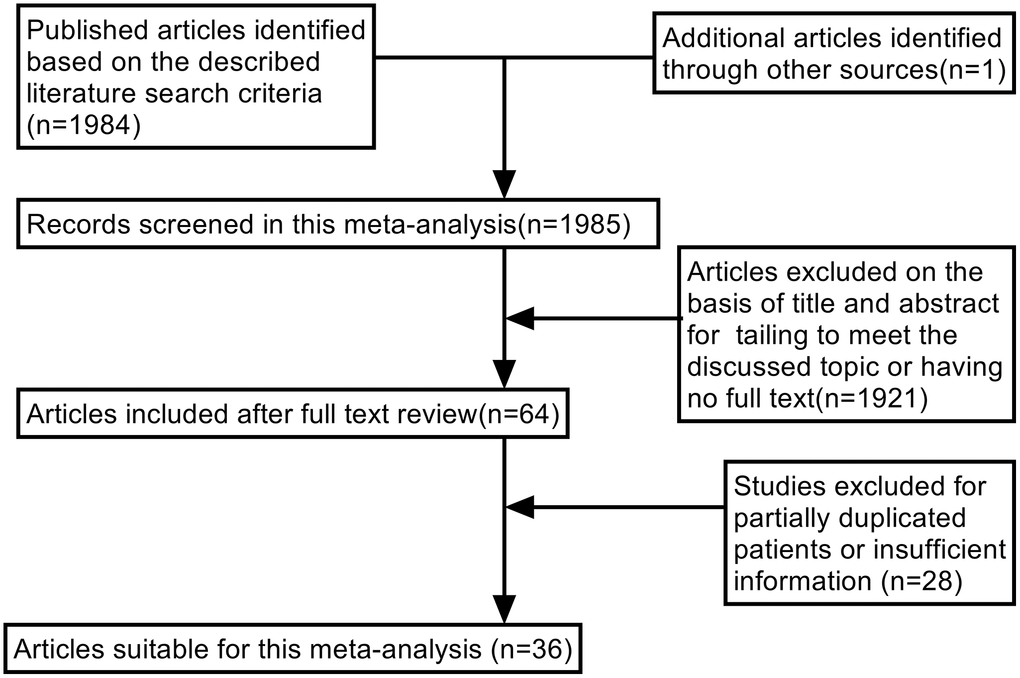
Figure 1. Flow chart of literature search strategies.
Study characteristics
Table 1 shows the data on E-cad expression, OS, clinical features, and risk factors from 36 enrolled studies eligible for the meta-analysis. A total of 9048 patients with GC were included, among whom 2998 patients exhibited lower levels of E-cad expression. The expression of E-cadherin in each study was determined by immunohistochemical staining, western blotting, immunofluorescence, or other methods, all conducted without subjective interference.
Quality assessment
Table 1 indicates that 4 studies scored 5 points [11, 20, 31, 44], 18studies scored 4 points [12, 14–19, 22, 24, 30, 33, 35–41], 14 studies scored 3 points [13, 21, 23, 25–29, 32, 34, 42, 43, 45, 46]. When the score of NOS is over 5 points, the studies is highly qualified.
Impact of E-cadherin expression on OS
As indicated in Figures 2–4 and Table 2, there are predominant correlations between reduced E-cadherin and poor one-, three-, and five-year OS, respectively (n = 25 studies [12, 13, 15–20, 22–24, 27–30, 35–37, 40–46], OR: 0.38, 95% CI: 0.25–0.57, Z = 4.61, P < 0.00001; n = 25 studies [12, 13, 15–20, 22–24, 27–30, 35–37, 40–46], OR: 0.33, 95% CI: 0.23–0.47, Z = 6.22, P < 0.00001; n = 22 studies [13, 16–20, 22, 24, 27–30, 35–37, 40–46], OR: 0.27, 95% CI: 0.18–0.41, Z = 6.23, P < 0.00001, respectively). The I2 statistic of the one-, three-, five-year OS was 77%, 82%, 85% respectively. The results of subgroup analyses revealed that reduced E-cadherin was predominantly associated with three-, five-year OS of patients with GC in China, Japan and Korea, as well as one-year OS of patients with GC in Japan, as illustrated in Table 3. It was concluded that reduced E-cad had a worse impact on prognosis in GC.
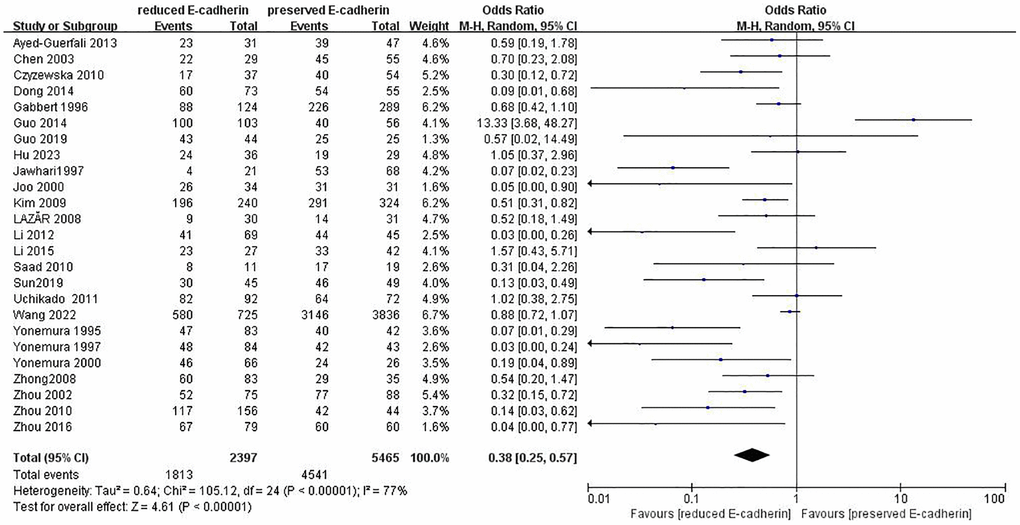
Figure 2. Forest plot of the odds ratio for the correlation of E-cadherin expression with one-year overall survival.
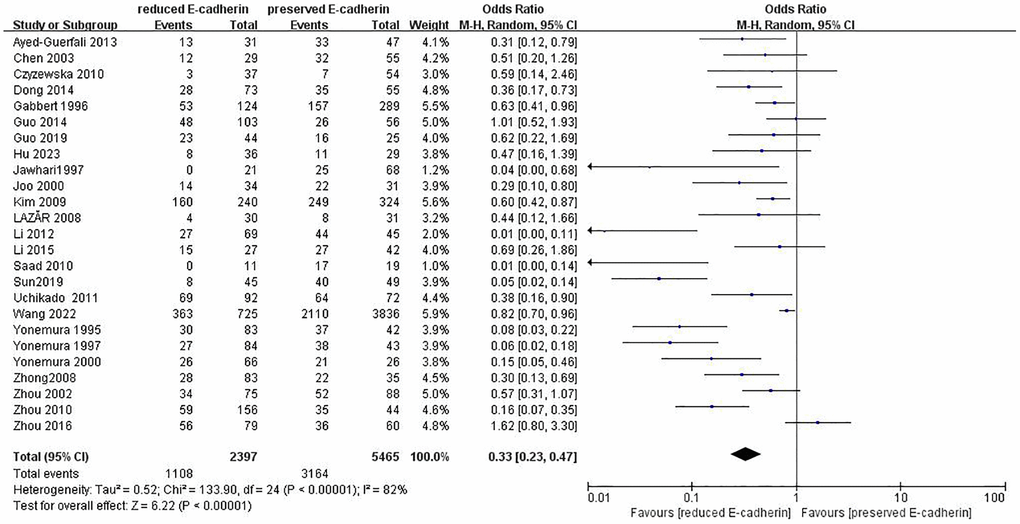
Figure 3. Forest plot of the odds ratio for the correlation of E-cadherin expression with three-year overall survival.
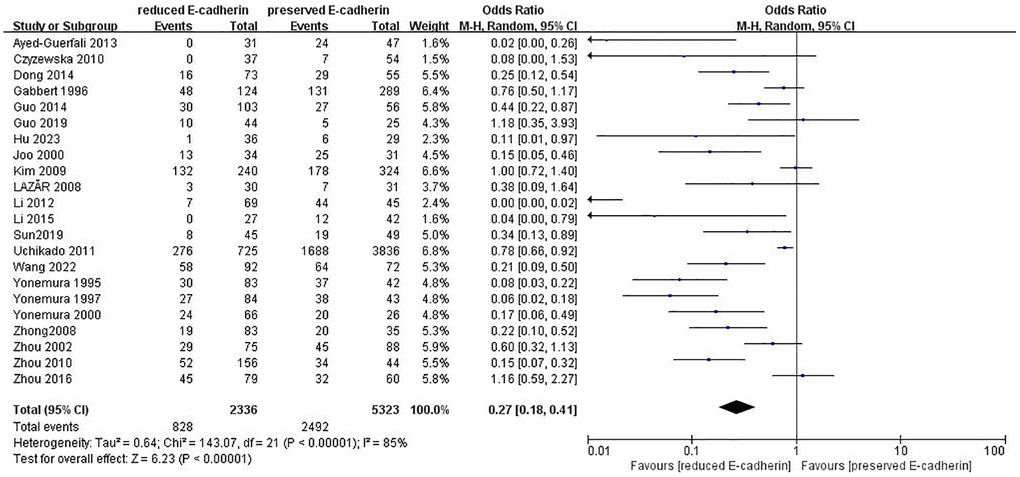
Figure 4. Forest plot of the odds ratio for the correlation of E-cadherin expression with five-year overall survival.
Table 2. Correlation between E-cadherin expression and OS, clinicopathological feature, and risk factors for GC.
| Outcome of interest | Number of studies | Number of tissue samples | OR (95% CI) | Z-value | P-value | I2(%) | |||||||||||||||||||||||||||||||||||||||||||||||||||||||||||||||||||||||||||||||||||||||||||||
| One-year overall survival | 25 | RE = 2397, PE = 5465 | 0.38 (0.25–0.57) | 4.61 | <0.00001 | 77 | |||||||||||||||||||||||||||||||||||||||||||||||||||||||||||||||||||||||||||||||||||||||||||||
| Three-year overall survival | 25 | RE = 2397, PE = 5465 | 0.33 (0.23–0.47) | 6.22 | <0.00001 | 82 | |||||||||||||||||||||||||||||||||||||||||||||||||||||||||||||||||||||||||||||||||||||||||||||
| Five-year overall survival | 22 | RE = 2336, PE = 5323 | 0.27 (0.18–0.41) | 6.23 | <0.00001 | 85 | |||||||||||||||||||||||||||||||||||||||||||||||||||||||||||||||||||||||||||||||||||||||||||||
| Depth of invasion | 22 | RE = 2155, PE = 5046 | 0.49 (0.36–0.66) | 4.58 | <0.00001 | 65 | |||||||||||||||||||||||||||||||||||||||||||||||||||||||||||||||||||||||||||||||||||||||||||||
| Lymphatic node metastasis | 32 | RE = 2700, PE = 5536 | 0.49 (0.38–0.64) | 5.38 | <0.00001 | 73 | |||||||||||||||||||||||||||||||||||||||||||||||||||||||||||||||||||||||||||||||||||||||||||||
| Distant metastasis | 13 | RE = 662, PE = 621 | 2.24 (1.62–3.09) | 4.88 | <0.00001 | 34 | |||||||||||||||||||||||||||||||||||||||||||||||||||||||||||||||||||||||||||||||||||||||||||||
| Lauren type | 19 | RE = 1139, PE = 1189 | 0.35 (0.21–0.57) | 4.14 | <0.0001 | 84 | |||||||||||||||||||||||||||||||||||||||||||||||||||||||||||||||||||||||||||||||||||||||||||||
| Differentiation grade | 32 | RE = 2519, PE = 5497 | 0.29 (0.22–0.39) | 8.58 | <0.00001 | 74 | |||||||||||||||||||||||||||||||||||||||||||||||||||||||||||||||||||||||||||||||||||||||||||||
| TNM stage | 23 | RE = 1984, PE = 5068 | 0.41 (0.28–0.61) | 4.44 | <0.00001 | 79 | |||||||||||||||||||||||||||||||||||||||||||||||||||||||||||||||||||||||||||||||||||||||||||||
| Lymphatic vessel invasion | 9 | RE = 601, PE = 679 | 1.77 (1.11–2.82) | 2.39 | 0.02 | 62 | |||||||||||||||||||||||||||||||||||||||||||||||||||||||||||||||||||||||||||||||||||||||||||||
| Vascular invasion | 13 | RE = 829, PE = 850 | 1.55 (1.22–1.96) | 3.58 | 0.0003 | 17 | |||||||||||||||||||||||||||||||||||||||||||||||||||||||||||||||||||||||||||||||||||||||||||||
| Peritoneal metastasis | 6 | RE = 358, PE = 338 | 2.17 (1.39–3.39) | 3.40 | 0.0007 | 36 | |||||||||||||||||||||||||||||||||||||||||||||||||||||||||||||||||||||||||||||||||||||||||||||
| Tumor size (≥5 cm vs. <5 cm) | 10 | RE = 729, PE = 488 | 1.73 (1.34–2.23) | 4.19 | <0.0001 | 10 | |||||||||||||||||||||||||||||||||||||||||||||||||||||||||||||||||||||||||||||||||||||||||||||
| Tumor size (≥6cm vs. <6 cm) | 3 | RE = 270, PE = 141 | 2.29 (1.51–3.49) | 3.87 | 0.0001 | 4 | |||||||||||||||||||||||||||||||||||||||||||||||||||||||||||||||||||||||||||||||||||||||||||||
| Borrmann classification | 6 | RE = 397, PE = 327 | 0.5 (0.25–0.99) | 1.97 | 0.048 | 56 | |||||||||||||||||||||||||||||||||||||||||||||||||||||||||||||||||||||||||||||||||||||||||||||
| Liver metastasis | 5 | RE = 320, PE = 246 | 1.21 (0.67–2.18) | 0.62 | 0.53 | 48 | |||||||||||||||||||||||||||||||||||||||||||||||||||||||||||||||||||||||||||||||||||||||||||||
| Perineural invasion | 3 | RE = 230, PE = 176 | 1.03 (0.46–2.30) | 0.06 | 0.95 | 65 | |||||||||||||||||||||||||||||||||||||||||||||||||||||||||||||||||||||||||||||||||||||||||||||
| Hp infection | 4 | RE = 244, PE = 222 | 0.65 (0.29–1.46) | 1.04 | 0.3 | 75 | |||||||||||||||||||||||||||||||||||||||||||||||||||||||||||||||||||||||||||||||||||||||||||||
| Smoking status | 2 | RE = 405, PE = 2022 | 1.1 (0.94–1.28) | 1.14 | 0.25 | 0 | |||||||||||||||||||||||||||||||||||||||||||||||||||||||||||||||||||||||||||||||||||||||||||||
| Alcohol consumption | 2 | RE = 758, PE = 3897 | 1 (0.85–1.19) | 0.03 | 0.98 | 0 | |||||||||||||||||||||||||||||||||||||||||||||||||||||||||||||||||||||||||||||||||||||||||||||
| Familial history | 2 | RE = 804, PE = 3896 | 0.93 (0.78–1.12) | 0.74 | 0.46 | 37 | |||||||||||||||||||||||||||||||||||||||||||||||||||||||||||||||||||||||||||||||||||||||||||||
| Abbreviations: Hp: Helicobacter pylori, RE: reduced E-cadherin expression, PE: preserved E-cadherin expression; OR: odds ratio; CI: confidence interval; TNM stage: depth of tumor invasion, lymphatic node metastasis, distant metastasis stage classification. | |||||||||||||||||||||||||||||||||||||||||||||||||||||||||||||||||||||||||||||||||||||||||||||||||||
Association between E-cadherin expression and clinical characteristics
The correlations between E-cadherin expression and depth of invasion, differentiation grade, lymphatic node metastasis, distant metastasis, liver metastasis, peritoneal metastasis, TNM stage, perineural invasion, lymphatic vessel invasion, vascular invasion, Lauren type, Borrmann classification and tumor size were examined. 22 studies [12, 13, 16–19, 21–22, 24, 28–30, 35–42, 44, 45] assessed the association between E-cadherin expression and depth of invasion (T1+T2 vs. T3+T4) (OR: 0.49, 95% CI: 0.36–0.66, Z = 4.58, P < 0.00001, Figure 5). 32 studies [11, 12–22, 24–26, 28–33, 36–46] evaluated the correlation between E-cad expression and lymphatic node metastasis (negative vs. positive) (OR: 0.49, 95% CI: 0.38–0.64, Z = 5.38, P < 0.00001, Figure 6). The result of subgroup analysis displayed that reduced E-cad strikingly related to lymphatic node metastasis of patients with GC in China, Korea, Japan and other countries, as depicted in Table 3. 13 studies [13, 15, 17, 24–26, 28–29, 33, 36, 38, 42, 43] measured the correlation of E-cad expression with distant metastasis (Figure 7). The pooled OR was 2.24 (95% CI: 1.62–3.09, Z = 4.88, P < 0.00001). 9 studies [12, 14, 18, 28, 33, 36, 40, 42, 46] surveyed the correlation between E-cadherin expression and lymphatic vessel invasion (positive vs. negative) (OR: 1.77, 95% CI: 1.11–2.82, Z = 2.39, P = 0.02,Figure 8).13 studies [12, 14–15, 18–20, 28, 33, 36, 38, 40, 42, 43] analyzed the association between E-cadherin expression and vascular invasion (positive vs. negative) (OR: 1.55, 95% CI: 1.22–1.96, Z = 3.58, P = 0.0003, Figure 9). 10 studies [13, 18, 21, 24, 26, 33, 39, 43–45] evaluated the correlation of E-cad expression with tumor size (≥5 cm vs. <5 cm) (OR: 1.73, 95% CI: 1.34–2.23, Z = 4.19, P < 0.0001, Figure 10). 3 studies [20, 40, 41] evaluated the correlation between E-cadherin expression and tumor size (≥6 cm vs. <6 cm) (Figure 11). The pooled OR was 2.29 (95% CI: 1.51–3.49, Z = 3.87, P = 0.0001). 23 studies [12, 13, 15, 17–20, 22, 24–26, 28–30, 35–41, 43, 46] appraised the association of E-cadherin expression with TNM stage (I+II vs. III+IV) (OR:0.41,95% CI: 0.28-0.61, Z = 4.44, P < 0.00001, Figure 12). 19 studies [11–13, 15–16, 18, 21, 23–26, 28, 31–32, 34, 36, 44–46] estimated the association of E-cad expression with Lauren type (intestine-type vs. diffuse-type) (OR: 0.35, 95% CI: 0.21–0.57, Z = 4.14, P < 0.0001, Figure 13). 32 studies [12–26, 28–33, 35–46] examined the association between E-cadherin expression and differentiation grade (well or moderate-differentiated vs. poor- differentiated) (OR: 0.29, 95% CI: 0.22–0.39, Z = 8.58, P < 0.00001, Figure 14). 6 studies [19, 33, 38, 41, 42, 44] detected the association of E-cad expression with Borrmann classification (Borrmann I+II vs. Borrmann III+IV) (OR: 0.50, 95% CI: 0.25–0.99, Z = 1.97, P = 0.048, Figure 15). 6 studies [15, 33, 36, 38, 41, 42] investigated the association of E-cad expression and peritoneal metastasis (OR: 2.17, 95% CI: 1.39–3.39, Z = 3.40, P = 0.0007, Figure 16). As shown in Supplementary Figures 1 and 2, There is no significant association of E-cadherin expression with liver metastasis or perineural invasion. Taken together, these results above demonstrate that reduced E-cadherin is predominantly correlated with unfavourable clinicopathological parameters.
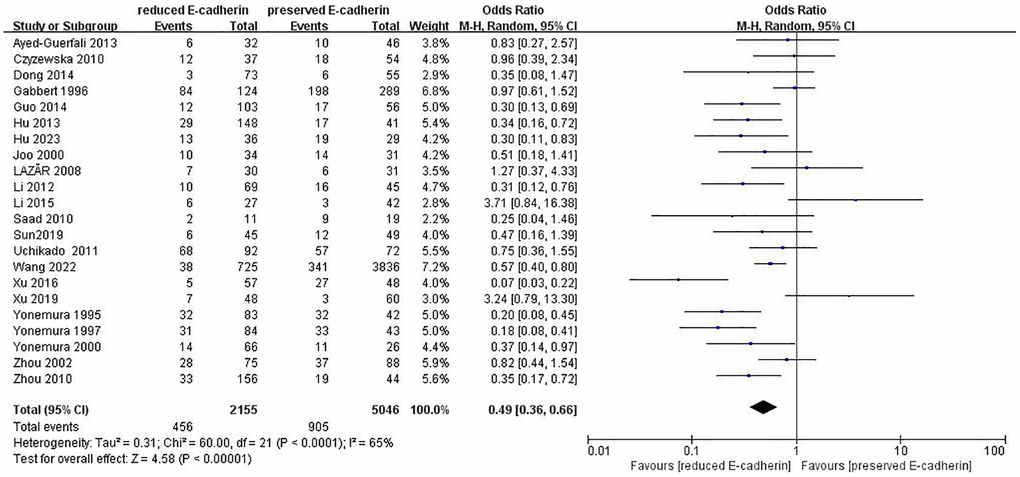
Figure 5. Forest plot of the odds ratio for the correlation of E-cadherin expression with depth of invasion.
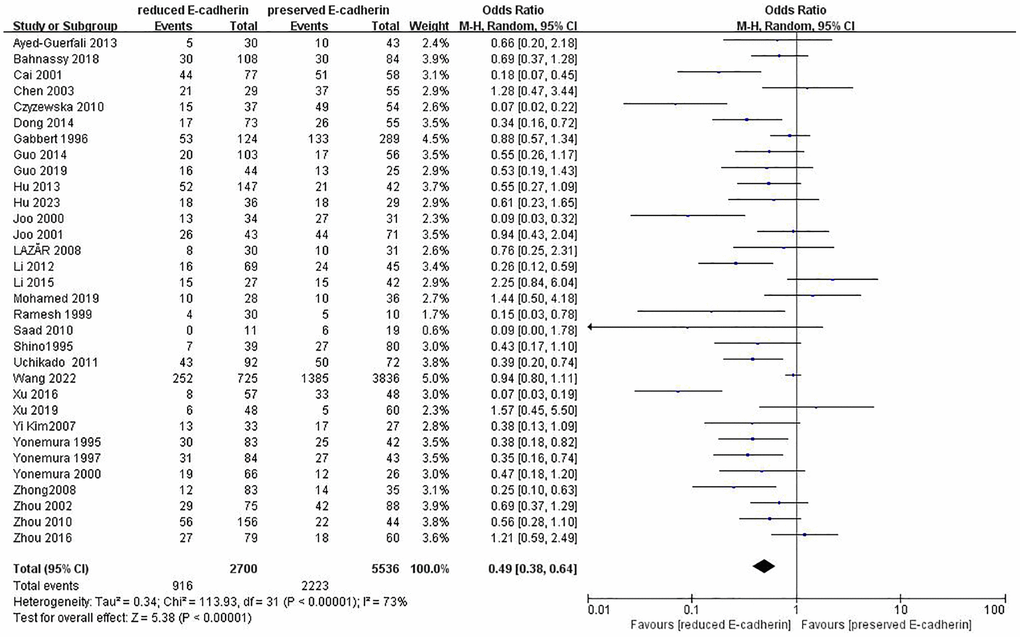
Figure 6. Forest plot of the odds ratio for the correlation of E-cadherin expression with lymphatic node metastasis.
Table 3. Subgroup analysis for E-cadherin expression with OS and lymphatic node metastasis in GC.
| Factors | Subgroup | Number of tissue samples | Number of studies | Z-value | OR (95% CI) | P-value | I2 (%) | P-value (Egger’s test) | |||||||||||||||||||||||||||||||||||||||||||||||||||||||||||||||||||||||||||||||||||||||||||
| One-year overall survival | |||||||||||||||||||||||||||||||||||||||||||||||||||||||||||||||||||||||||||||||||||||||||||||||||||
| China | RE = 1544, PE = 4419 | 11 | 1.92 | 0.51(0.26–1.01) | 0.06 | 77 | 0.235 | ||||||||||||||||||||||||||||||||||||||||||||||||||||||||||||||||||||||||||||||||||||||||||||
| Japan | RE = 325, PE = 183 | 4 | 2.13 | 0.16 (0.03–0.86) | 0.03 | 82 | 0.200 | ||||||||||||||||||||||||||||||||||||||||||||||||||||||||||||||||||||||||||||||||||||||||||||
| Korea | RE = 274, PE = 355 | 4 | 1.71 | 0.27 (0.06–1.21) | 0.09 | 77 | 0.059 | ||||||||||||||||||||||||||||||||||||||||||||||||||||||||||||||||||||||||||||||||||||||||||||
| Other countries | RE = 254, PE = 508 | 6 | 2.98 | 0.36 (0.19–0.71) | 0.02 | 65 | 0.489 | ||||||||||||||||||||||||||||||||||||||||||||||||||||||||||||||||||||||||||||||||||||||||||||
| Three-year overall survival | |||||||||||||||||||||||||||||||||||||||||||||||||||||||||||||||||||||||||||||||||||||||||||||||||||
| China | RE = 1544, PE = 4419 | 11 | 3.44 | 0.45 (0.29–0.71) | 0.00006 | 81 | 0.063 | ||||||||||||||||||||||||||||||||||||||||||||||||||||||||||||||||||||||||||||||||||||||||||||
| Japan | RE = 325, PE = 183 | 4 | 4.65 | 0.13 (0.06–0.31) | <0.00001 | 65 | 0.52 | ||||||||||||||||||||||||||||||||||||||||||||||||||||||||||||||||||||||||||||||||||||||||||||
| Korea | RE = 274, PE = 355 | 4 | 2.25 | 0.29 (0.10–0.86) | 0.02 | 81 | 0.218 | ||||||||||||||||||||||||||||||||||||||||||||||||||||||||||||||||||||||||||||||||||||||||||||
| Other countries | RE = 254, PE = 508 | 6 | 2.71 | 0.31 (0.13–0.72) | 0.0007 | 63 | 0.233 | ||||||||||||||||||||||||||||||||||||||||||||||||||||||||||||||||||||||||||||||||||||||||||||
| Five-year overall survival | |||||||||||||||||||||||||||||||||||||||||||||||||||||||||||||||||||||||||||||||||||||||||||||||||||
| China | RE = 1515, PE = 4364 | 10 | 3.59 | 0.44 (0.28–0.69) | <0.0001 | 78 | 0.052 | ||||||||||||||||||||||||||||||||||||||||||||||||||||||||||||||||||||||||||||||||||||||||||||
| Japan | RE = 325, PE = 183 | 4 | 6.92 | 0.12 (0.07–0.22) | <0.0001 | 33 | 0.064 | ||||||||||||||||||||||||||||||||||||||||||||||||||||||||||||||||||||||||||||||||||||||||||||
| Korea | RE = 274, PE = 355 | 4 | 2.14 | 0.08 (0.01–0.81) | 0.033 | 82 | 0.272 | ||||||||||||||||||||||||||||||||||||||||||||||||||||||||||||||||||||||||||||||||||||||||||||
| Other countries | RE = 222, PE = 421 | 4 | 1.94 | 0.24 (0.06–1.01) | 0.052 | 69 | 0.079 | ||||||||||||||||||||||||||||||||||||||||||||||||||||||||||||||||||||||||||||||||||||||||||||
| Lymphatic node metastasis | |||||||||||||||||||||||||||||||||||||||||||||||||||||||||||||||||||||||||||||||||||||||||||||||||||
| China | RE = 1828, PE = 4578 | 16 | 3.26 | 0.54 (0.38–0.78) | 0.001 | 77 | 0.829 | ||||||||||||||||||||||||||||||||||||||||||||||||||||||||||||||||||||||||||||||||||||||||||||
| Japan | RE = 364, PE = 263 | 5 | 5.20 | 0.39 (0.28–0.56) | <0.0001 | 0 | 0.627 | ||||||||||||||||||||||||||||||||||||||||||||||||||||||||||||||||||||||||||||||||||||||||||||
| Korea | RE = 110, PE = 129 | 3 | 2.04 | 0.44 (0.33–0.59) | 0.042 | 30 | 0.92 | ||||||||||||||||||||||||||||||||||||||||||||||||||||||||||||||||||||||||||||||||||||||||||||
| Other countries | RE = 398, PE = 566 | 8 | 2.20 | 0.49 (0.26–0.93) | 0.028 | 71 | 0.064 | ||||||||||||||||||||||||||||||||||||||||||||||||||||||||||||||||||||||||||||||||||||||||||||
| Abbreviations: OR: odds ratio; CI: confidence interval. | |||||||||||||||||||||||||||||||||||||||||||||||||||||||||||||||||||||||||||||||||||||||||||||||||||
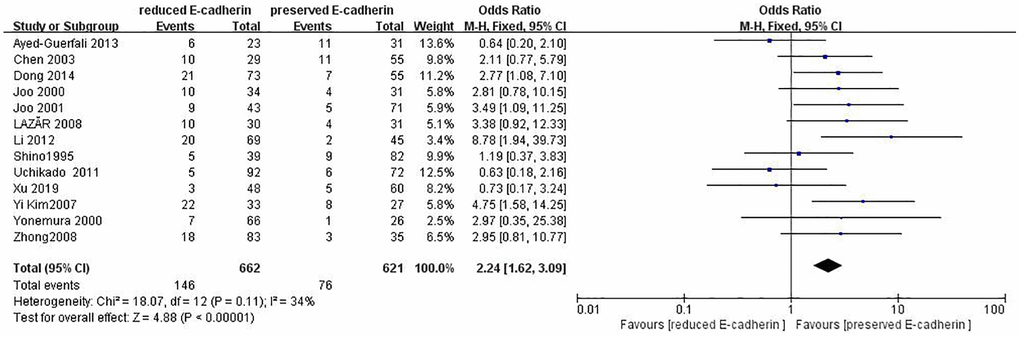
Figure 7. Forest plot of the odds ratio for the correlation of E-cadherin expression with distant metastasis.
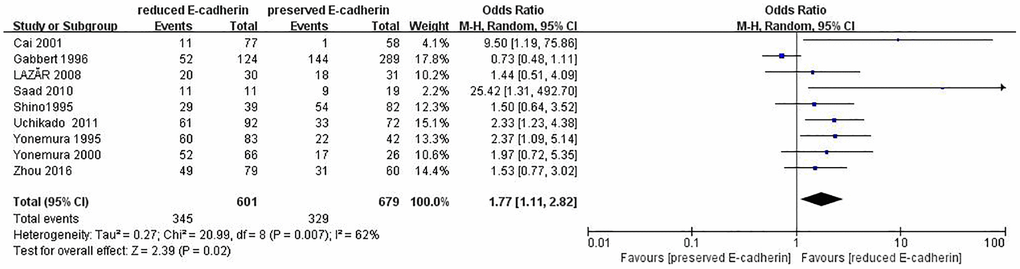
Figure 8. Forest plot of the odds ratio for the correlation of E-cadherin expression with lymphatic vessel invasion.
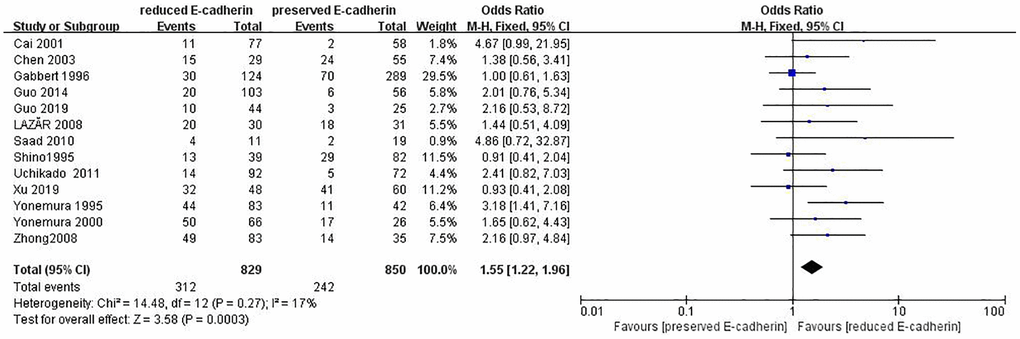
Figure 9. Forest plot of the odds ratio for the correlation of E-cadherin expression with vascular invasion.
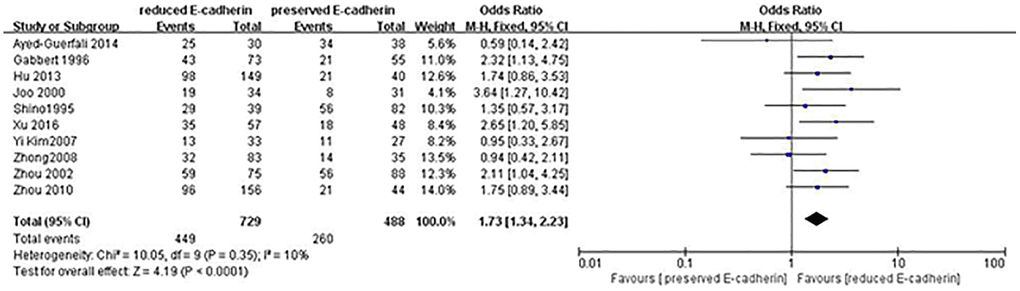
Figure 10. Forest plot of the odds ratio for the correlation of E-cadherin expression with tumor size (≥5 cm vs. <5 cm).
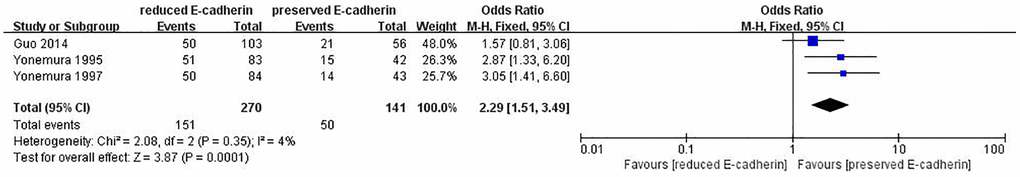
Figure 11. Forest plot of the odds ratio for the correlation of E-cadherin expression with tumor size (≥6 cm vs. <6 cm).
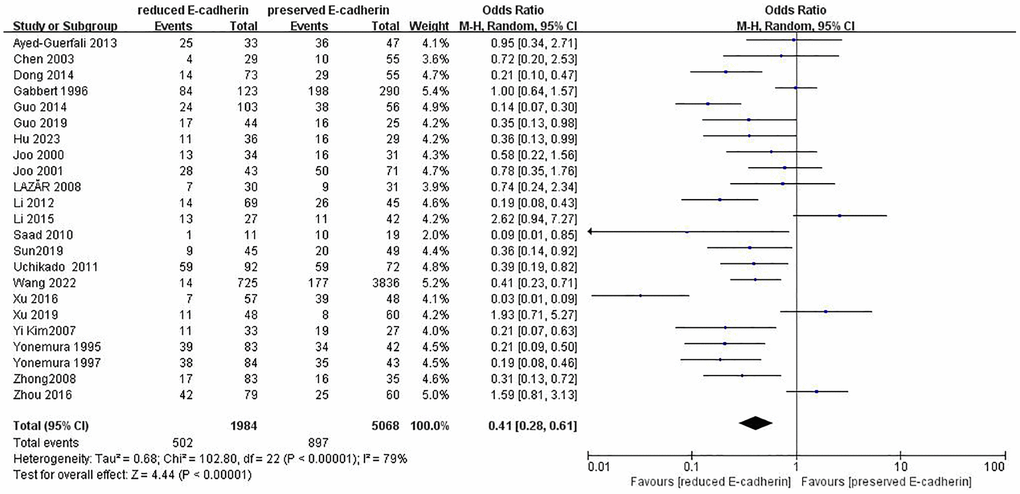
Figure 12. Forest plot of the odds ratio for the correlation of E-cadherin expression with TNM stage.
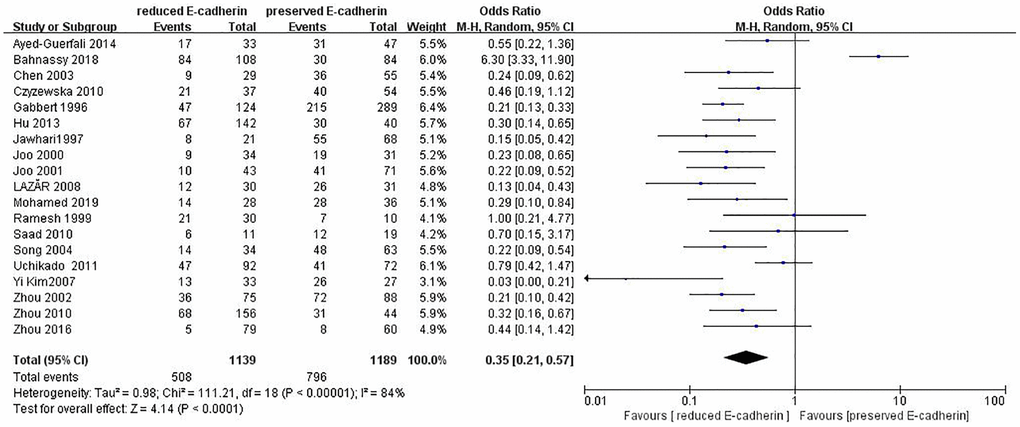
Figure 13. Forest plot of the odds ratio for the correlation of E-cadherin expression with Lauren type.
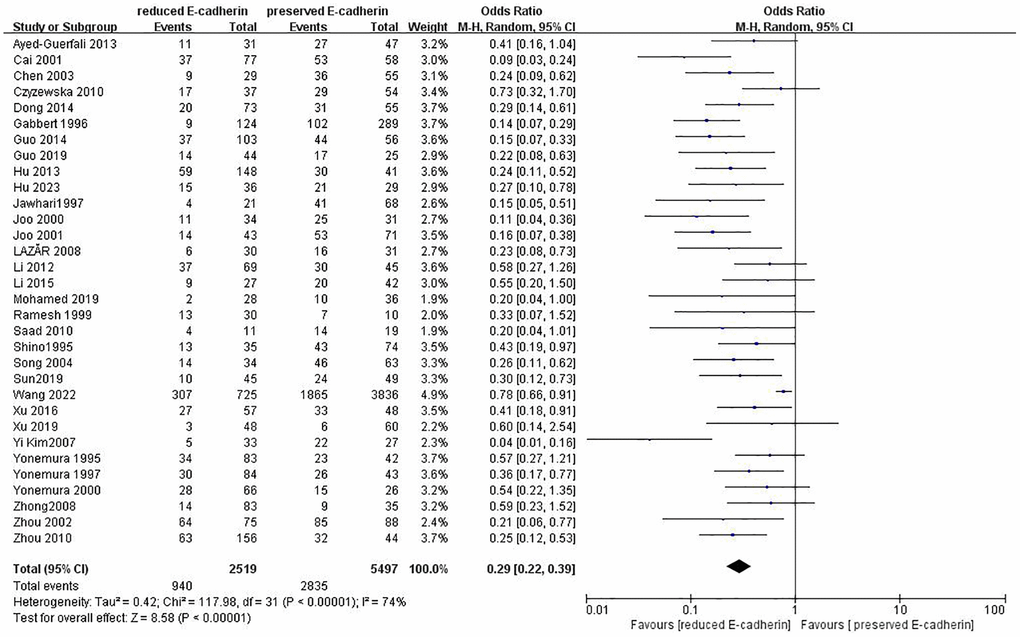
Figure 14. Forest plot of the odds ratio for the correlation of E-cadherin expression with differentiation grade.
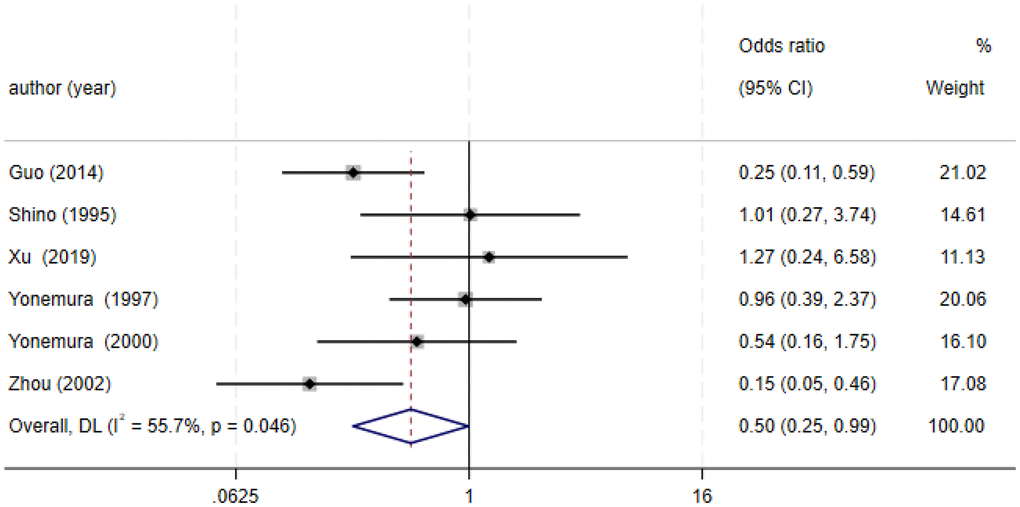
Figure 15. Forest plot of the odds ratio for the correlation of E-cadherin expression with Borrmann classification.
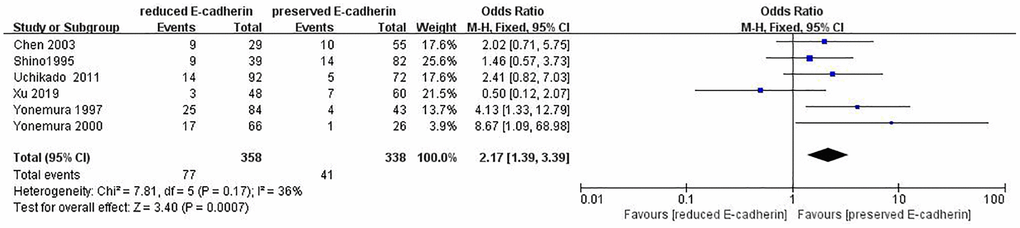
Figure 16. Forest plot of the odds ratio for the correlation of E-cadherin expression with peritoneal metastasis.
Correlation of E-cadherin expression with risk factors
The associations of E-cadherin expression with risk factors, including alcohol consumption, smoking status, familial history, and HP infection were evaluated. As depicted in Table 2 and Supplementary Figures 3–6, E-cadherin expression is not correlated with alcohol consumption, smoking status, familial history and HP infection.
Publication bias
Egger’s test manifests that there is not any publication bias for studies included in analysis of OS, risk factors, and clinicopathological parameters except differentiation grade (p = 0.0001). As shown in Supplementary Figures 7–26, the funnel plots for publication bias were symmetric except for some degree of asymmetry of studies involved in the analysis of differentiation grade (Supplementary Figure 27).
Discussion
A personalized treatment plan, including surgery, chemotherapy, anti-angiogenic therapy, and immunotherapy, trastuzumab for Her2- positive GC, can help patients with GC improve their OS.
However, the median survival is within 12 months. It is demonstrated that E-cad is crucial for tumor development, invasion, metastasis in GC. There is no consensus about impact of E-cadherin expression on prognosis and clinical characteristics of patients with GC. In this meta-analysis 9048 cases from 36 eligible studies were analyzed to elucidate its correlation.
OR is a measure of effect size commonly used in meta-analysis, particularly when dealing with dichotomous outcomes, which is also a statistic that quantifies the strength of outcome between the correlation of an exposure with an outcome. A pooled OR, is a single and overall estimate of the effect, which is obtained in a meta-analysis to combine the results from multiple studies. The resulting pooled OR provides a more precise and reliable estimate of the effect than any single study alone.
Recent researches have disclosed that decreased E-cadherin expression in GC ranges from 15.9% [37] to 85.4% [3] by IHC tests. This study denoted that the lower levels of E-cad in GC occur at the rate of 33.1%. Zhou et al., revealed that a normal state of E-cadherin expression is essential for the favourable prognosis of patients with GC [46]. As demonstrated in this article, reduced expression of E-cadherin was significantly correlated with one-, three-, and five-year overall survival (OS) of patients with gastric cancer, especially in China, Korea, and Japan. No publication bias was observed in the subgroup analysis conducted in each of these regions. It is consistent with the result of Zhou et al.
Regarding clinicopathological parameters, this study found that lower levels of E-cad expression are predominantly correlated with deeper invasion, poor differentiation, higher TNM staging, distant metastasis, lymphatic node metastasis, peritoneal metastasis, vascular invasion, lymphatic vessel invasion, greater tumor size, diffuse type of Lauren classification, and Borrmann III+IV. No obvious association exists between lower E-cadherin level and liver metastasis and perineural invasion. A normal state of E-cadherin expression is key to favourable clinicopathological characteristics of GC.
The E-cadherin–catenin complex consists of E-cadherin, p120, β-catenin, and α-catenin, and inhibits individual cell motility. CDH1 gene mutation, including methylation, leads to reduced E-cadherin protein expression, thereby triggering epithelial-mesenchymal transition and resulting in the loss of cell adhesion capacity [13, 17, 23–25]. The E-Cadherin/Wnt/ β-catenin pathway [3, 47] and the E-Cadherin/EGFR/ RAS/RAF/MEK pathway [48] impact on patients’ prognosis in GC, as described below. The reduction of E-cadherin expression upregulates the Wnt/β-catenin pathway and increases the expression of c-Myc, cyclins, and specific MMPs (e.g., MMP-3), and represses the expression of PTEN, which promotes cell proliferation and oncogenesis [3, 48, 49]. Upregulation of transcription factors including Snail, Twist, and Zeb-1 causes reduced E-cadherin expression, which promotes cell motility [7, 27, 36].
It is believed that Helicobacter pylori (HP) infection, dinking, hereditary tendency, salted and smoked food intake, and gastroesophageal reflux disease are risk factors for GC [2]. Worldwide incidence of distal GC related to HP seems to be on the rise. HP silences E-cad gene by secreting CgA and counteracting protein kinase C [49–51]. Reduced E-cadherin expression is not pronouncedly correlated with alcohol consumption, smoking status, familial history, or HP infection in this meta-analysis.
Some limitations deserve further attention in this study. Firstly, different antibody sources and dilutions bring bias into this meta-analysis. Secondly, there was heterogeneity in this study, as displayed in given tables and forest plots. A random-effects model was utilized to account for heterogeneity among studies. Subgroup analyses failed to clarify the source of heterogeneity. Thirdly, publication bias was present for differentiation grade. Fourthly, the inclusion of studies published in English may also introduce bias.
A conclusion can be drawn from this meta-analysis that the reduced expression of E-cadherin is significantly correlated with poor OS and unfavourable clinicopathological features in GC. The expression level of E-cadherin not only serves as a predictor for disease progression and prognosis in GC but also emerges as a novel therapeutic target.
Supplementary Materials
Author Contributions
GLL, ZC designed this study. GLL, JYS and RYJ completed the study selection and data extraction, FT, YLF, TZ completed the work of literature quality assessment, JMT, GLL and ZC mainly focused on statistical analysis, GLL, YDC and ZC wrote the paper.
Conflicts of Interest
The authors declare no conflicts of interest related to this study.
Funding
This study was supported by Zhejiang Provincial Medical and Health Science and Technology Plan (No. 2023XY079, 2023XY080 and 2023XY222), Quzhou City Science Guidance Project (No. 2020122 and 2019136), Longyou County Guiding Science and Technology Project (No. 2023079, 2023032 and 2023088), Quzhou City Science and Technology Plan Project (No. 2023 K198).
References
- 1. Bray F, Ferlay J, Soerjomataram I, Siegel RL, Torre LA, Jemal A. Global cancer statistics 2018: GLOBOCAN estimates of incidence and mortality worldwide for 36 cancers in 185 countries. CA Cancer J Clin. 2018; 68:394–424. https://doi.org/10.3322/caac.21492 [PubMed]
- 2. Velanovich V, Hollingsworth J, Suresh P, Ben-Menachem T. Relationship of gastroesophageal reflux disease with adenocarcinoma of the distal esophagus and cardia. Dig Surg. 2002; 19:349–53. https://doi.org/10.1159/000065835 [PubMed]
- 3. Togasaki K, Sugimoto S, Ohta Y, Nanki K, Matano M, Takahashi S, Fujii M, Kanai T, Sato T. Wnt Signaling Shapes the Histologic Variation in Diffuse Gastric Cancer. Gastroenterology. 2021; 160:823–30. https://doi.org/10.1053/j.gastro.2020.10.047 [PubMed]
- 4. Guo J, Fu Z, Wei J, Lu W, Feng J, Zhang S. PRRX1 promotes epithelial-mesenchymal transition through the Wnt/β-catenin pathway in gastric cancer. Med Oncol. 2015; 32:393. https://doi.org/10.1007/s12032-014-0393-x [PubMed]
- 5. Becker KF, Atkinson MJ, Reich U, Becker I, Nekarda H, Siewert JR, Höfler H. E-cadherin gene mutations provide clues to diffuse type gastric carcinomas. Cancer Res. 1994; 54:3845–52. [PubMed]
- 6. Sudo M, Chong JM, Sakuma K, Ushiku T, Uozaki H, Nagai H, Funata N, Matsumoto Y, Fukayama M. Promoter hypermethylation of E-cadherin and its abnormal expression in Epstein-Barr virus-associated gastric carcinoma. Int J Cancer. 2004; 109:194–9. https://doi.org/10.1002/ijc.11701 [PubMed]
- 7. Batlle E, Sancho E, Francí C, Domínguez D, Monfar M, Baulida J, García De Herreros A. The transcription factor snail is a repressor of E-cadherin gene expression in epithelial tumour cells. Nat Cell Biol. 2000; 2:84–9. https://doi.org/10.1038/35000034 [PubMed]
- 8. Comijn J, Berx G, Vermassen P, Verschueren K, van Grunsven L, Bruyneel E, Mareel M, Huylebroeck D, van Roy F. The two-handed E box binding zinc finger protein SIP1 downregulates E-cadherin and induces invasion. Mol Cell. 2001; 7:1267–78. https://doi.org/10.1016/s1097-2765(01)00260-x [PubMed]
- 9. Lu G, Lin J, Song G, Chen M. Prognostic significance of CTNNB1 mutation in hepatocellular carcinoma: a systematic review and meta-analysis. Aging (Albany NY). 2023; 15:9759–78. https://doi.org/10.18632/aging.205047 [PubMed]
- 10. Lu G, Xiang Z, Zhou Y, Dai S, Tong F, Jiang R, Dai M, Zhang Q, Zhang D. Comparison of lobectomy and sublobar resection for stage I non-small cell lung cancer: a meta-analysis based on randomized controlled trials. Front Oncol. 2023; 13:1261263. https://doi.org/10.3389/fonc.2023.1261263 [PubMed]
- 11. Bahnassy AA, Helal TE, El-Ghazawy IM, Samaan GF, Galal El-Din MM, Abdellateif MS, Desouky E, Zekri AN. The role of E-cadherin and Runx3 in Helicobacter Pylori - Associated gastric carcinoma is achieved through regulating P21waf and P27 expression. Cancer Genet. 2018; 228-229:64–72. https://doi.org/10.1016/j.cancergen.2018.08.006 [PubMed]
- 12. Saad AA, Awed NM, Abd Elkerim NN, El-Shennawy D, Alfons MA, Elserafy ME, Darwish YW, Barakat EM, Ezz-Elarab SS. Prognostic significance of E-cadherin expression and peripheral blood micrometastasis in gastric carcinoma patients. Ann Surg Oncol. 2010; 17:3059–67. https://doi.org/10.1245/s10434-010-1151-8 [PubMed]
- 13. Ayed-Guerfali DB, Hassairi B, Khabir A, Sellami-Boudawara T, Gargouri A, Mokdad-Gargouri R. Expression of APC, β-catenin and E-cadherin in Tunisian patients with gastric adenocarcinoma: clinical significance. Tumour Biol. 2014; 35:1775–83. https://doi.org/10.1007/s13277-013-1236-7 [PubMed]
- 14. Cai J, Ikeguchi M, Tsujitani S, Maeta M, Liu J, Kaibara N. Significant correlation between micrometastasis in the lymph nodes and reduced expression of E-cadherin in early gastric cancer. Gastric Cancer. 2001; 4:66–74. https://doi.org/10.1007/pl00011726 [PubMed]
- 15. Chen HC, Chu RY, Hsu PN, Hsu PI, Lu JY, Lai KH, Tseng HH, Chou NH, Huang MS, Tseng CJ, Hsiao M. Loss of E-cadherin expression correlates with poor differentiation and invasion into adjacent organs in gastric adenocarcinomas. Cancer Lett. 2003; 201:97–106. https://doi.org/10.1016/j.canlet.2003.07.007 [PubMed]
- 16. Czyzewska J, Guzińska-Ustymowicz K, Ustymowicz M, Pryczynicz A, Kemona A. The expression of E-cadherin-catenin complex in patients with advanced gastric cancer: role in formation of metastasis. Folia Histochem Cytobiol. 2010; 48:37–45. https://doi.org/10.2478/v10042-010-0017-z [PubMed]
- 17. Dong H, Xie L, Tang C, Chen S, Liu Q, Zhang Q, Zheng W, Zheng Z, Zhang H. Snail1 correlates with patient outcomes in E-cadherin-preserved gastroesophageal junction adenocarcinoma. Clin Transl Oncol. 2014; 16:783–91. https://doi.org/10.1007/s12094-013-1149-3 [PubMed]
- 18. Gabbert HE, Mueller W, Schneiders A, Meier S, Moll R, Birchmeier W, Hommel G. Prognostic value of E-cadherin expression in 413 gastric carcinomas. Int J Cancer. 1996; 69:184–9. https://doi.org/10.1002/(SICI)1097-0215(19960621)69:3%3c184::AID-IJC6%3e3.0.CO;2-W [PubMed]
- 19. Guo Q, Qin W, Li B, Yang H, Guan J, Liu Z, Li S. Analysis of a cytoskeleton-associated kinase PEAK1 and E-cadherin in gastric cancer. Pathol Res Pract. 2014; 210:793–8. https://doi.org/10.1016/j.prp.2014.09.013 [PubMed]
- 20. Guo P, Liu R, Bai G, Ying L, He X, Zheng R, Jiang X, Li F, Jia R, Lou X, Liu S. FOXM1 overexpression and decreased E-cadherin expression are correlated with poor prognosis advanced gastric cancer. Int J Clin Exp Med. 2019; 12:5689–95. https://e-century.us/files/ijcem/12/5/ijcem0079294.pdf.
- 21. Hu Z, Liu X, Tang Z, Zhou Y, Qiao L. Possible regulatory role of Snail in NF-κB-mediated changes in E-cadherin in gastric cancer. Oncol Rep. 2013; 29:993–1000. https://doi.org/10.3892/or.2012.2200 [PubMed]
- 22. Hu K, Zheng QM, Wang YP, Zhao MM, Sun ZG. Clinical and prognostic features of E-cadherin in adenocarcinoma of the esophagogastric junction patients. Eur J Cancer Prev. 2023; 32:119–25. https://doi.org/10.1097/CEJ.0000000000000776 [PubMed]
- 23. Jawhari A, Jordan S, Poole S, Browne P, Pignatelli M, Farthing MJ. Abnormal immunoreactivity of the E-cadherin-catenin complex in gastric carcinoma: relationship with patient survival. Gastroenterology. 1997; 112:46–54. https://doi.org/10.1016/s0016-5085(97)70218-x [PubMed]
- 24. Joo YE, Park CS, Kim HS, Choi SK, Rew JS, Kim SJ. Prognostic significance of E-cadherin/catenin complex expression in gastric cancer. J Korean Med Sci. 2000; 15:655–66. https://doi.org/10.3346/jkms.2000.15.6.655 [PubMed]
- 25. Joo YE, Rew JS, Kim HS, Choi SH, Park CS, Kim SJ. Changes in the E-cadherin-catenin complex expression in early and advanced gastric cancers. Digestion. 2001; 64:111–9. https://doi.org/10.1159/000048849 [PubMed]
- 26. Yi Kim D, Kyoon Joo J, Kyu Park Y, Yeob Ryu S, Soo Kim H, Kyun Noh B, Hwa Lee K, Hyuk Lee J. E-cadherin expression in early gastric carcinoma and correlation with lymph node metastasis. J Surg Oncol. 2007; 96:429–35. https://doi.org/10.1002/jso.20732 [PubMed]
- 27. Kim MA, Lee HS, Lee HE, Kim JH, Yang HK, Kim WH. Prognostic importance of epithelial-mesenchymal transition-related protein expression in gastric carcinoma. Histopathology. 2009; 54:442–51. https://doi.org/10.1111/j.1365-2559.2009.03247.x [PubMed]
- 28. Lazăr D, Tăban S, Ardeleanu C, Dema A, Sporea I, Cornianu M, Lazăr E, Vernic C. The immunohistochemical expression of E-cadherin in gastric cancer; correlations with clinicopathological factors and patients' survival. Rom J Morphol Embryol. 2008; 49:459–67. [PubMed]
- 29. Li Y, Chen CQ, He YL, Cai SR, Yang DJ, He WL, Xu JB, Zan WH. Abnormal expression of E-cadherin in tumor cells is associated with poor prognosis of gastric carcinoma. J Surg Oncol. 2012; 106:304–10. https://doi.org/10.1002/jso.23008 [PubMed]
- 30. Li N, Deng W, Ma J, Wei B, Guo K, Shen W, Zhang Y, Luo S. Prognostic evaluation of Nanog, Oct4, Sox2, PCNA, Ki67 and E-cadherin expression in gastric cancer. Med Oncol. 2015; 32:433. https://doi.org/10.1007/s12032-014-0433-6 [PubMed]
- 31. Hamed MKF, Fawzy G, Hanna HH. The role of E-cadherin expression and E-cadherin gene promoter hypermethylation in gastric carcinoma. Egypt J Surg. 2019; 38:361–8. https://doi.org/10.4103/ejs.ejs_4_19
- 32. Ramesh S, Nash J, McCulloch PG. Reduction in membranous expression of beta-catenin and increased cytoplasmic E-cadherin expression predict poor survival in gastric cancer. Br J Cancer. 1999; 81:1392–7. https://doi.org/10.1038/sj.bjc.6693437 [PubMed]
- 33. Shino Y, Watanabe A, Yamada Y, Tanase M, Yamada T, Matsuda M, Yamashita J, Tatsumi M, Miwa T, Nakano H. Clinicopathologic evaluation of immunohistochemical E-cadherin expression in human gastric carcinomas. Cancer. 1995; 76:2193–201. https://doi.org/10.1002/1097-0142(19951201)76:11%3c2193::aid-cncr2820761104%3e3.0.co;2-2 [PubMed]
- 34. Song SY, Kim S, Kim DS, Son HJ, Rhee JC, Kim YI. Abnormal expression of E-cadherin in early gastric carcinoma: its relationship with macroscopic growth patterns and catenin alpha and beta. J Clin Gastroenterol. 2004; 38:252–9. https://doi.org/10.1097/00004836-200403000-00011 [PubMed]
- 35. Sun S, Gong Q. The expressions and prognostic implications of Twist and E-cadherin in adenocarcinomas of the gastroesophageal junction and proximal gastric carcinoma. Medicine (Baltimore). 2019; 98:e18449. https://doi.org/10.1097/MD.0000000000018449 [PubMed]
- 36. Uchikado Y, Okumura H, Ishigami S, Setoyama T, Matsumoto M, Owaki T, Kita Y, Natsugoe S. Increased Slug and decreased E-cadherin expression is related to poor prognosis in patients with gastric cancer. Gastric Cancer. 2011; 14:41–9. https://doi.org/10.1007/s10120-011-0004-x [PubMed]
- 37. Wang HL, Zhao XK, Zhou FY, Song X, Li LY, Huang GR, Bao QD, Lei LL, Yang HJ, Li L, Xu RH, Li AL, Wang XZ, et al. Characterization of E-cadherin expression in normal mucosa, dysplasia and adenocarcinoma of gastric cardia and its influence on prognosis. World J Gastrointest Oncol. 2022; 14:265–77. https://doi.org/10.4251/wjgo.v14.i1.265 [PubMed]
- 38. Xu Q, Wei Q, Ling J, Chen L, Ying J. RhoA/E-cadherin expression in gastric cancer patients: correlations with clinicopathological features and prognosis. Int J Clin Exp Med. 2019; 12:13757–64. https://e-century.us/files/ijcem/12/12/ijcem0097511.pdf.
- 39. Xu J, Wang W, Wang X, Zhang L, Huang P. Expression of SIRT1, H3K9me3, H3K9Ac and E-cadherin and its correlations with clinicopathological characteristics in gastric cancer patients. Int J Clin Exp Med. 2016; 9:17219–31. https://e-century.us/files/ijcem/9/9/ijcem0019542.pdf.
- 40. Yonemura Y, Nojima N, Kaji M, Fujimura T, Itoh H, Ninomiya I, Miyazaki I, Endo Y, Sasaki T. E-cadherin and urokinase-type plasminogen activator tissue status in gastric carcinoma. Cancer. 1995; 76:941–53. https://doi.org/10.1002/1097-0142(19950915)76:6%3c941::aid-cncr2820760606%3e3.0.co;2-i [PubMed]
- 41. Yonemura Y, Nojima N, Kaji M, Kawamura T, Fushida S, Fujimura T, Itoh H, Fujita H, Miyazaki J, Endou Y, Sasaki T, Yamamoto H. E-cadherin and c-met expression as a prognostic factor in gastric cancer. Oncol Rep. 1997; 4:743–8. https://doi.org/10.3892/or.4.4.743 [PubMed]
- 42. Yonemura Y, Endou Y, Kimura K, Fushida S, Bandou E, Taniguchi K, Kinoshita K, Ninomiya I, Sugiyama K, Heizmann CW, Schafer BW, Sasaki T. Inverse expression of S100A4 and E-cadherin is associated with metastatic potential in gastric cancer. Clin Cancer Res. 2000; 6:4234–42. [PubMed]
- 43. Zhong XY, Zhang LH, Jia SQ, Shi T, Niu ZJ, Du H, Zhang GG, Hu Y, Lu AP, Li JY, Ji JF. Positive association of up-regulated Cripto-1 and down-regulated E-cadherin with tumour progression and poor prognosis in gastric cancer. Histopathology. 2008; 52:560–8. https://doi.org/10.1111/j.1365-2559.2008.02971.x [PubMed]
- 44. Zhou YN, Xu CP, Han B, Li M, Qiao L, Fang DC, Yang JM. Expression of E-cadherin and beta-catenin in gastric carcinoma and its correlation with the clinicopathological features and patient survival. World J Gastroenterol. 2002; 8:987–93. https://doi.org/10.3748/wjg.v8.i6.987 [PubMed]
- 45. Zhou Y, Li G, Wu J, Zhang Z, Wu Z, Fan P, Hao T, Zhang X, Li M, Zhang F, Li Q, Lu B, Qiao L. Clinicopathological significance of E-cadherin, VEGF, and MMPs in gastric cancer. Tumour Biol. 2010; 31:549–58. https://doi.org/10.1007/s13277-010-0068-y [PubMed]
- 46. Zhou F, Xu Y, Shi J, Lan X, Zou X, Wang L, Huang Q. Expression profile of E-cadherin, estrogen receptors, and P53 in early-onset gastric cancers. Cancer Med. 2016; 5:3403–11. https://doi.org/10.1002/cam4.931 [PubMed]
- 47. Guo Q, Xu J, Huang Z, Yao Q, Chen F, Liu H, Zhang Z, Lin J. ADMA mediates gastric cancer cell migration and invasion via Wnt/β-catenin signaling pathway. Clin Transl Oncol. 2021; 23:325–34. https://doi.org/10.1007/s12094-020-02422-7 [PubMed]
- 48. Li D, Lo W, Rudloff U. Merging perspectives: genotype-directed molecular therapy for hereditary diffuse gastric cancer (HDGC) and E-cadherin-EGFR crosstalk. Clin Transl Med. 2018; 7:7. https://doi.org/10.1186/s40169-018-0184-7 [PubMed]
- 49. Cowell CF, Yan IK, Eiseler T, Leightner AC, Döppler H, Storz P. Loss of cell-cell contacts induces NF-kappaB via RhoA-mediated activation of protein kinase D1. J Cell Biochem. 2009; 106:714–28. https://doi.org/10.1002/jcb.22067 [PubMed]
- 50. Terrés AM, Pajares JM, O'Toole D, Ahern S, Kelleher D. H pylori infection is associated with downregulation of E-cadherin, a molecule involved in epithelial cell adhesion and proliferation control. J Clin Pathol. 1998; 51:410–2. https://doi.org/10.1136/jcp.51.5.410 [PubMed]
- 51. Terrés AM, Pajares JM, Hopkins AM, Murphy A, Moran A, Baird AW, Kelleher D. Helicobacter pylori disrupts epithelial barrier function in a process inhibited by protein kinase C activators. Infect Immun. 1998; 66:2943–50. https://doi.org/10.1128/IAI.66.6.2943-2950.1998 [PubMed]