Submit an Article
Navigate
Home
Editorial Board
Editorial Policies
Current Volume
Archive
Scientific Integrity
Publication Ethics Statements
Interviews with Outstanding Authors
Newsroom
Sponsored Conferences
Podcast
Contact
Special Collections
Submit an Article
Online ISSN: 1945-4589
Research Paper
|
Volume 16, Issue 12
|
pp. 10271–10298
Reduced expression of E-cadherin correlates with poor prognosis and unfavorable clinicopathological features in gastric carcinoma: a meta-analysis
Back to article
Figure 13
(13 of 16)
−
100%
+
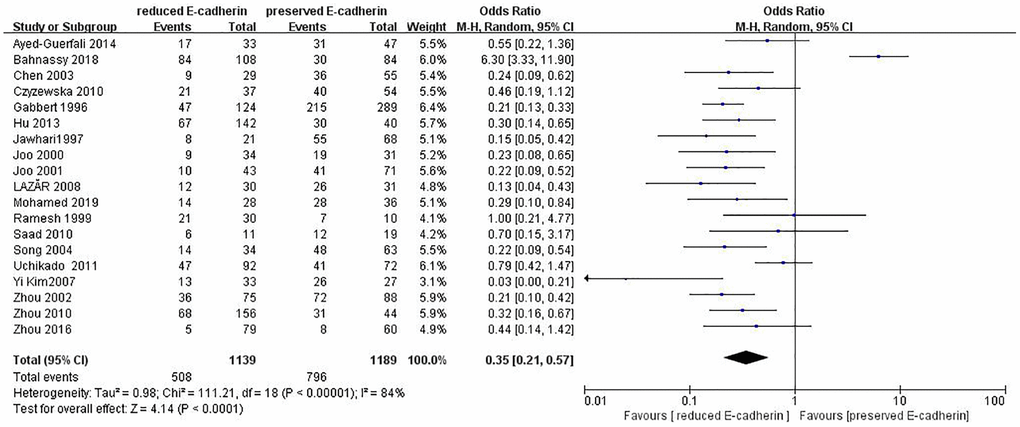
Figure 13.
Forest plot of the odds ratio for the correlation of E-cadherin expression with Lauren type.