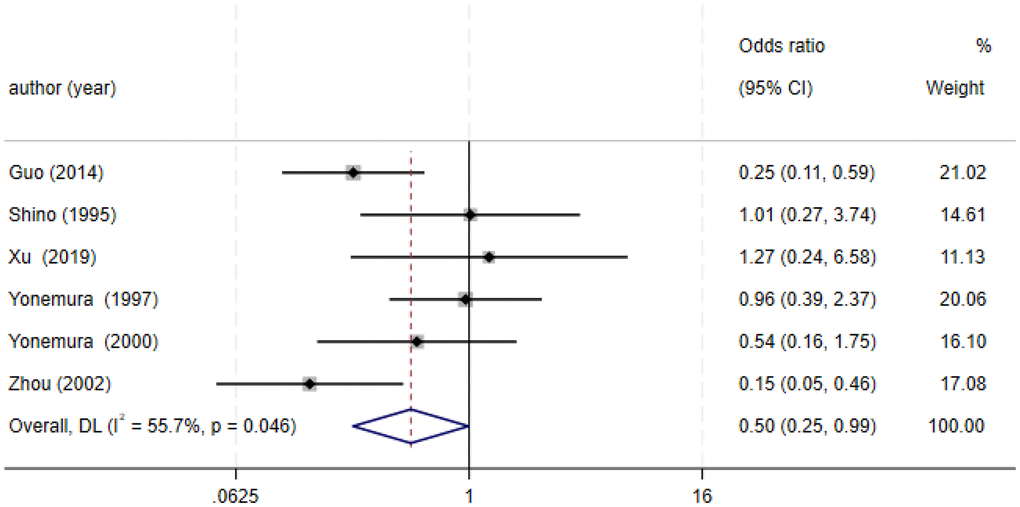
Figure 15.Forest plot of the odds ratio for the correlation of E-cadherin expression with Borrmann classification.
Figure 15 — Reduced expression of E-cadherin correlates with poor prognosis and unfavorable clinicopathological features in gastric carcinoma: a meta-analysis | Aging