


Introduction
Lung cancer possesses a high mortality rate, with lung adenocarcinoma accounting for approximately 50% of all types of lung cancer [1, 2]. Because it is difficult to diagnose the disease in its early stages, most patients are diagnosed at a malignant stage, which leaves patients without access to surgery to treat their cancer. Despite significant improvements in treatment techniques such as chemotherapy, molecular targeted Therapy and immunotherapy, the 5-year survival rate for patients after diagnosis remains below 15% [3]. There is an actual demand to identify a new therapeutic and prognostic target to improve the understanding of tumor pathogenesis and treatment.
Bioinformatics-based disease risk analysis has become an important and routine strategy for disease diagnosis, treatment and prognosis [4]. Weighted gene co-expression network analysis (WGCNA) is an effective bioinformatic analysis method often used to obtain modules with highly correlated gene expression patterns and the relationship between they and their clinical characteristics in large numbers of samples [5]. Unlike the focus on differentially expressed genes, the WGCNA algorithm defines the gene co-expression correlation matrix, and constructs hierarchical clustering trees accordingly [6]. By using WGCNA, we can search for key genes in the module of interest and after validation they can be used as targets for subsequent treatment, diagnosis or prognosis.
With the development of RNA sequencing or single-cell sequencing technology, the heterogeneity of tumor is becoming well known and the study of sequencing data has shown that tumor tissues are organized into diverse populations of cells. Among these cell subpopulations, one of them is named tumor stem cells. As the name suggests, tumor stem cells possess some properties of regular stem cells. They can renew themselves by division and have the ability to differentiate into other tumor cell types. Currently, it is widely accepted that resistances to existing conventional therapies are one of their characteristics, and that they act as an indispensable role in the tumorigenesis, progression and metastasis in tumors [7–9].
In this work, firstly, according to both TCGA lung adenocarcinoma (LUAD) cohorts and cancer stemness indices, we obtained the most significant cancer stemness index module through the implementation of the WGCNA calculation and hub genes [10]. Secondly, we then applied LASSO and cox regression to the genes in the above module to construct a prognostic model. This model contains six genes, they are CCNB1 CCNA2 CENPA TTK NEK2 PRC1. Thirdly, we analyzed the intersection of prognostic model genes and hub genes and finally identified, Centromere Protein A, CENPA as the subject of the study. We also conducted a series of experiments to investigate the effects of CENPA on stemness maintenance and cell proliferation. Our results support that CENPA is a useful prognostic biomarker and tumor stemness regulator to help in LUAD prediction, disease management and therapy.
Materials and Methods
Colony formation assay
LUAD cell line A549 were resuspended to 1×10³ cells/mL and seeded in 6-well plates. After two weeks of incubation, the cells were fixed with 4% paraformaldehyde and stained with 0.1% crystal violet. The number of colonies was calculated after three times of PBS washing.
CCK-8 assay
The CCK-8 assay (Dojindo, Japan) was utilized to test the proliferation of the cells. 10,000 cells were seed in ninety-six well plates. The assay was carried out according to the instructions and the absorbance was measured at 450 nm with an enzyme marker at 0 H, 24 H, 48 H and 72 H after inoculation respectively.
5-Ethynyl-2′-deoxyuridine (EdU) assay
Cells were inoculated on 14 mm cell coverslip and cultured overnight. The medium was removed and incubated with medium containing 20 mM EDU (Thermo Fisher, USA) for two hours in a 37°C incubator. Follow the instructions for the subsequent procedure. Olympus FV3000 confocal camera was used to photograph EDU-positive cells.
Immunofluorescence and confocal imaging
Immunofluorescence of CD44 and EpCAM was used to detect the protein expression. Briefly, cells were inoculated on coverslips and cultured overnight. The medium was removed and subsequently washed cell three times with PBS and then fixed at room temperature in 4% paraformaldehyde followed by 0.5% triton-x100 permeabilization. 1% BSA was used to block the non-specific antigen for 1 hour and the Anti-CD44 (ABclonal, China), Anti-EpCAM (ABclonal, China) antibodies were added and incubated 12 h at 4°C. Cy3-conjugated anti-rabbit (Abcam, USA) and FITC-conjugated anti-rabbit (Abcam, USA) secondary antibodies were added according to the instructions and DAPI (Thermo Fisher, USA) was applied to stain the cell nuclei. Finally protein expression level was visualized and images were captured by using Olympus FV3000 confocal microscope.
Human-mouse tumor xenograft model and animal imaging
Animal studies were conducted with the approval of Ethics Committee of the Laboratory Animal Center of Wuhan University of Science and Technology. 4-weekold male BALB/c nude mice were purchased from Beijing Huafukang Experimental Animal Co, Ltd. and maintain in specific pathogen free condition. 1 × 10⁷ cells of CENPA knockdown A549 cells and A549 cells in control were injected simultaneously into different groups of mice. After 18 days of incubation, mice were used for subsequent different experiments.
For imaging, mice were first anesthetized with isoflurane. Meanwhile mice were injected intraperitoneally with D-Luciferin at a dose of 150 mg/KG. Bioluminescence imaging signals were measured 10 minutes after D-Luciferin injection, and were carried out by placing the region of interest (ROI) on the mouse. The light intensity (in photons /s−1 /mm−2) is measured within this ROI.
Screening for differentially expressed genes (DEG)
Lung adenocarcinoma mRNA sequencing profiles were from the TCGA database, and the R packages limma, heatmap and ggplot2 were applied to process the downloaded data and present the top 50 differentially expressed genes in the form of heatmap and volcano plot [11, 12]. The criteria for determining differential gene expression were p < 0.05 and absolute value of logFC >2.
WGCNA identifies key modules and hub genes
Based on the results of the DEG screen, we applied the WGCNA and the cancer stemness index (mRNAsi) to obtain modules with different correlations to this index [5]. After determining the module to be studied, we screened out the key genes in this module according to the gene significance (GS) and module membership (MM) values. Then we used the software Cytoscape to determine the hub gene. The CytoHubba plug-in can detect and lock the most related genes among these key genes by using the maximal clique centrality (MCC) and label these ten genes with different colors to represent different degrees of relatedness [13, 14]. Depending on their degree of correlation with the index in LUAD, red represents high correlation, orange represents moderate correlation and yellow represents low correlation.
Functional enrichment analysis
GO analyses were utilized to characterize the function of DEGs. And these researches were carried out by applying dose, and ggplot2 R packages [12, 15]. P < 0.05 and FDR <0.05 were used as the judgement criteria.
Construction of risk score models
The R packages glmnet and survival were used to complete the LASSO (least absolute shrinkage and selection operator) regression analysis and to select genes for the model [16, 17]. Key genes identified on the basis of MM and GS values were first screened for prognosis value by univariate Cox regression analysis. Selected genes were then subjected to LASSO regression analysis to calculate their prognostic value and variable coefficients. We then utilized the following computational formula to obtain the risk score.
Coef is the coefficient of the gene and X represents the expression level of the gene. The mean of the risk scores was used as a criterion to classify the samples into high and low risk groups. Kaplan-Meier survival analysis was used to analysis differences in survival between the two groups. Univariate and multivariate Cox analyses were used to analysis whether risk score and clinical characteristics could be independent prognostic factors.
Gene set enrichment analysis
The c2.cp.kegg.v7.4.gene sets and Hallmark collections were obtained from Molecular Signatures Database (MSigDB) and subsequently analyzed by applying GSEA software (version: 4.0.3) to analyze the data. The c2.cp.kegg.v7.4.gene sets was used as the reference gene set. [18, 19].
Statistical analysis
All experimental data were processed by the software GraphPad Prism 8 and were presented as mean ± standard deviation. An unpaired t-test was used to compare the differences between the two groups. The p-value less than 0.05 was considered to be significantly different (*P < 0.05; **P < 0.01; ***P < 0.001; ****P < 0.0001).
Ethics approval and consent to participate
All mouse experimental procedures were evaluated and authorized in strict accordance with the guiding principles of the Animal Protection and Use Committee of Wuhan University of Science and Technology and in accordance with the “Hubei Province Experimental Animal Management Regulations.”
Consent for publication
All authors have read this manuscript and approved for submission.
Availability of supporting data
The data generated during this study are included in this article and its supplementary information files are available from the corresponding author on reasonable request.
Results
Screening for differentially expressed genes and differences in mRNAsi
We downloaded mRNA expression profile data for lung adenocarcinoma from the TCGA database as well as clinical data for the samples. As shown in Figure 1A, there was a significant difference in mRNAsi levels between these two groups. The mRNAsi in the tumor group was much higher than that in the normal samples. Finally, we screened the expression profile data for differentially expressed genes (DEGs) with limma R package. In total, we found 6778 differentially expressed genes, of which 5178 were up-regulated and 1600 were down-regulated. We extracted the top 50 expression data of the DEG and plotted them as heat maps (Figure 1B and 1C).
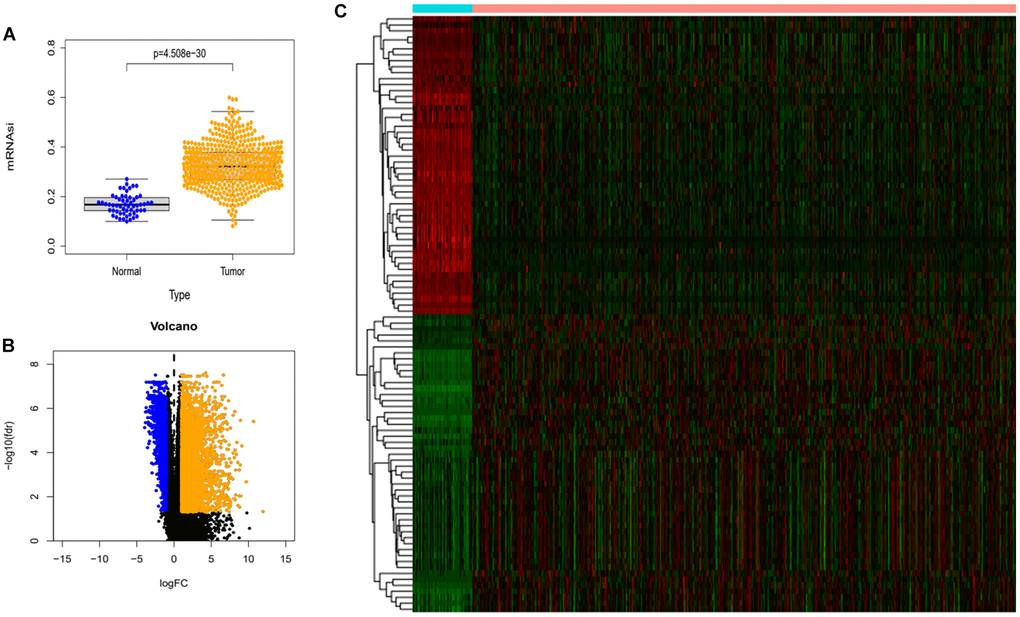
Figure 1. Differences in mRNAsi and sample gene expression. (A) Differences in mRNAsi between normal and tumor tissues in lung adenocarcinoma. (B) Volcano map of differentially expressed genes. Green dots represent genes that are down-regulated, red dots represent genes that are up-regulated, and black dots represent no significant change. (C) The top 50 differentially expressed genes in LUAD cancer disease presented as a gene expression heat map. P < 0.05.
Construction of the WGCNA gene co-expression network
Based on DEGs and mRNAsi values, we applied the WGCNA algorithm to build a gene co-expression network to screen for cancer stemness index-related modules. Firstly, samples with the deflection of gene expression were deleted (Figure 2A). Then considering both the scale-free correlation coefficient and the average module connectivity, we selected 4 as the soft threshold parameter (Figure 2B). Thirdly, we calculate the similarity of modules and merge modules that have a high degree of similarity (Figure 2C and 2D). A total of 18 co-expression modules are established and named in different colors for the convenience of description (Figure 2E). As shown in 2E, the blue (R2 = 0.79. p.value = 2e-82) and turquoise (R2 = −0.37. p.value = 2e-13) modules were highly correlated with mRNAsi. Because of its maximum positive correlation, we chose the blue module as the follow-up study target.
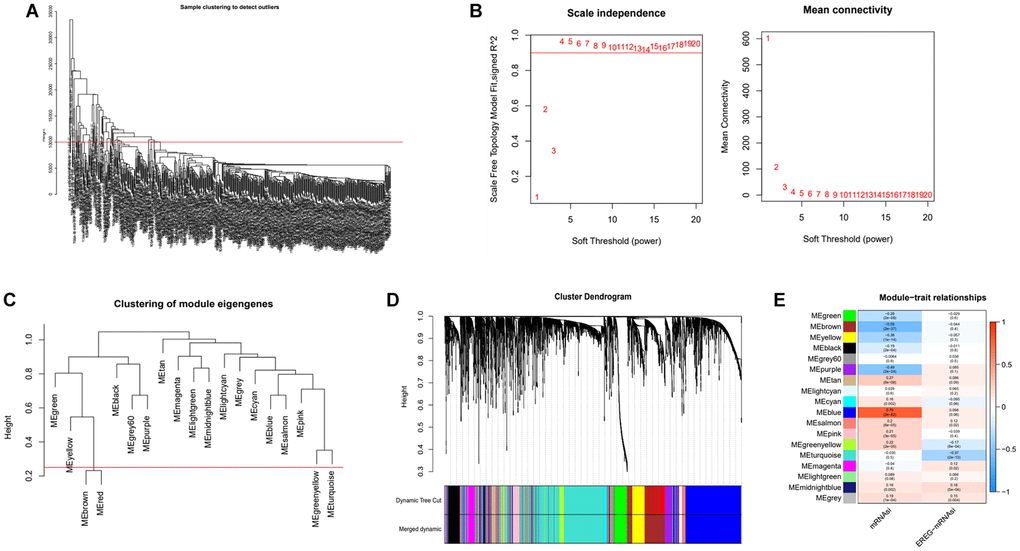
Figure 2. Identification of cancer stemness index-related modules by WGCNA. (A) Samples above the red line were removed because they were considered as the deflection of gene expression. (B) This represents the correlation coefficient R2 and mean connectivity in the scale-free network. (C) Calculate similarity between modules and merge modules with high similarity. (D) Hierarchical clustering of gene modules. (E) Heatmap of the correlation ship between gene modules and cancer stemness index.
Identification of key genes and their functional enrichment and correlation analysis
The blue module is the most positively correlated with the mRNAsi index. Model membership (MM) values represent the magnitude of the relationship between the gene and this module, and gene significance (GS) values represent the association of the gene with mRNAsi. To further narrow down the study, we used MM > 0.8 and GS >0.65 as criteria to select key genes (Figure 3A). In total, there were 1554 genes in the blue module, and we finally identified 30 key genes. We then extracted the expression profile of these genes and presented the differences in expression between tumor and normal tissues in the form of heatmap and box plots (Figure 3B and 3C). To investigate the functions of these key genes, we performed GO functional enrichment analysis, which revealed that these genes are mainly responsible for chromosome segregation, DNA replication, and microtubule movement, all of which are highly relevant to the cell cycle (Figure 3D). We also performed correlation analysis of key genes to demonstrate the high correlation of these genes within the consent module as shown in the Figure 3E and 3F.
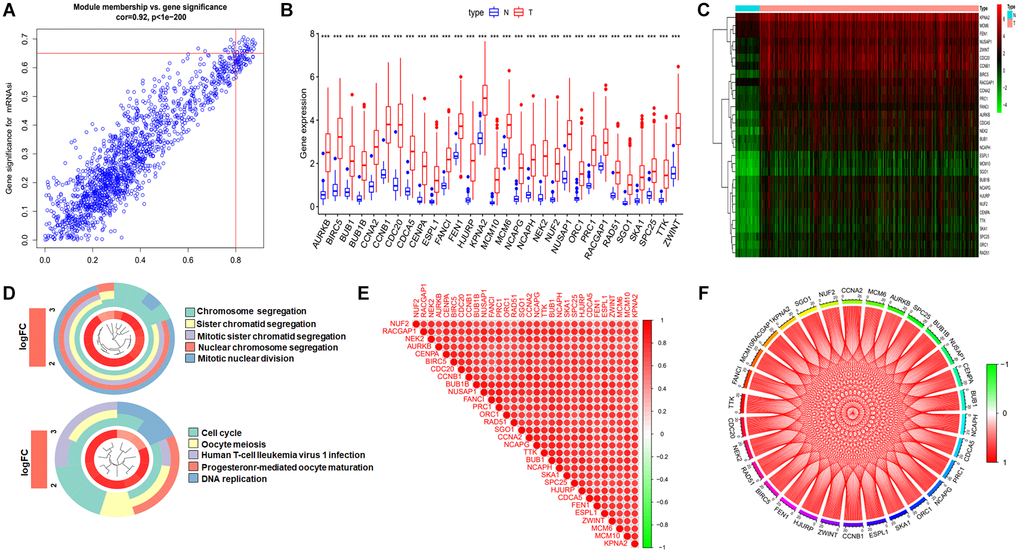
Figure 3. Identification the key genes and expression, functional enrichment and correlation analysis of these genes. (A) Scatter plot of maximum positive correlation with cancer stemness index (mRNAsi). (B and C) Box plot of the difference in expression of key genes between tumor and normal tissue. (D) Functional enrichment analysis of key genes. (E and F) Analysis of the correlation of key genes at the transcriptional level, red represents for positive correlation and green represents for negative correlation.
Identification of hub genes by protein-protein Interaction (PPI) networks and validation their expression
To better understand the interactions of these genes, we build a protein-protein interaction network through the online website STRING (https://cn.string-db.org/) (Figure 4A). In this network, there are 30 nodes and 413 edges, and the PPI enrichment p-value: <1.0 × 10⁻¹⁶. In addition, we show the number of connections between nodes as a bar diagram (Figure 4B). To further narrow down the study, we applied Cytoscape software to screen and visualize the hub genes. Ten hub genes were identified through the Maximal Clique Centrality (MCC) value. They are SGOL1, CENPA, ESPL1, NUF2, BIRC5, CCNB1, BUB1B, AURKB, BUB1, CDC20 and are labelled with different colours (Figure 4C). Finally, to demonstrate the different expression level of ten hub genes in tumor and normal tissues, we firstly validated it with the GSE40791 dataset downloaded from the GEO data base and subsequently also performed a paired analysis of the expression data of TCGA database. The results showed significant differences in the expression of these genes in normal versus tumor tissue (Figure 4D and 4E).
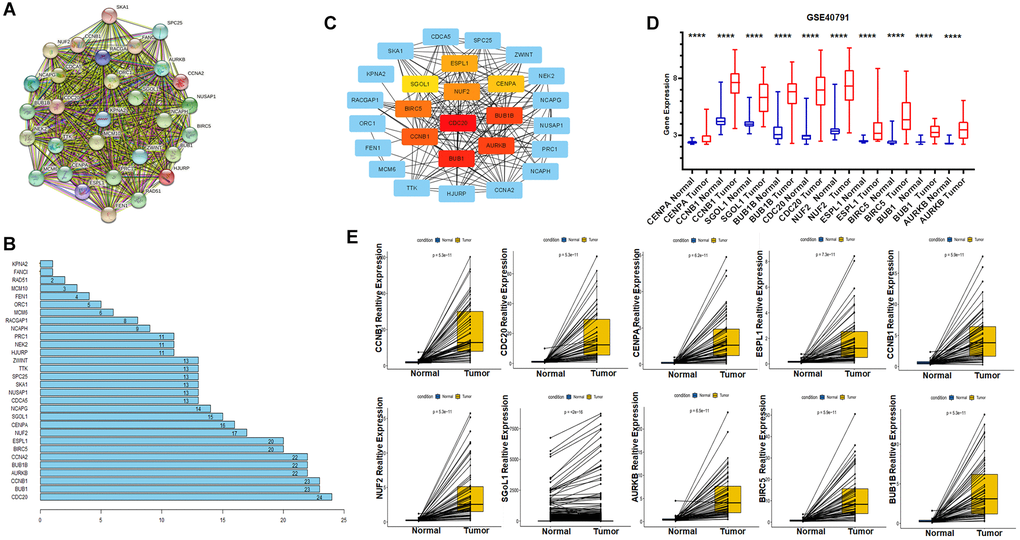
Figure 4. Identification of hub genes using Protein-Protein Interaction Network and Cytoscape; GEO dataset validates expression of key genes. (A) Protein- Protein Interaction Network of Key Genes. (B) Number of edges per key gene. (C) The CytoHubba plug-in identifies hub genes and marks them with different colours, red for high correlation, orange for moderate correlation and yellow for low correlation. (D) External validation of the GSE40791 dataset for differential expression of hub genes in tumor and normal tissues. (E) Paired expression analysis of hub genes from TCGA.
Establishing a risk assessment model
To investigate the prognostic value of these key genes in lung adenocarcinoma, we first applied univariate Cox regression analysis to perform a preliminary screening of the prognostic role of these genes. As shown in the Figure 5A and Table 1, all of these key genes are of prognostic significance and for further clarification of the scope of the study. We loaded these genes into the LASSO regression analysis model to build a risk assessment model (Figure 5B). As a result, a 6-gene model (CCNB1, CCNA2, TTK, CENPA, PRC1, NEK2) was screened out. Four of these six genes were positive correlated with overall survival, and two were negative correlated. We obtained the risk score of LUAD patients with the corresponding coefficients. The calculation method is as follows: (expression level of TTK × −0.134+ expression level of NEK2 × 0.114+ expression level of CCNB1 × 0.116+ expression level of CCNA2 × 0.194+ expression level of CENPA × −0.179+ expression level of PRC1 × 0.16). Samples were classified into high and low-risk groups based on the mean value of risk score. There is a significant difference in survival rate between the two groups of samples (Figure 5C). In the end, we analyzed the linear relationship of risk score and cancer stemness index. As shown in Figure 5D and 5E, risk score increases with cancer stemness index. This would indicate that the risk score is positively correlated with the cancer stemness index, which can also be used to assess the amount of tumor stemness in a tumor.
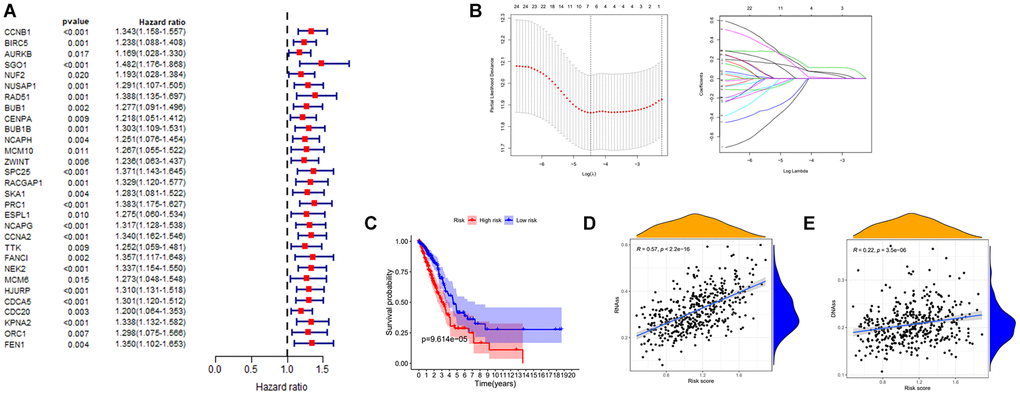
Figure 5. Establishment of risk prognostic model. (A) Univariate Cox analysis of the prognostic value of key genes. (B) LASSO Cox regression analysis of key genes. (C) The patient samples were divided into high and low risk groups based on risk score and the OS of the groups were analyzed using Kaplan-Meier. Red represents the high risk group and blue represents the low risk group. (D and E) Analysis of the linear relationship between risk score and cancer stemness index. Abbreviations: LASSO: least absolute shrinkage and selection operator; OS: overall survival.
Table 1. Results of the key genes in the Univariate Cox regression analysis.
| ID | Univariate Cox analysis | ||||||||||||||||||||||||||||||||||||||||||||||||||||||||||||||||||||||||||||||||||||||||||||||||||
| HR | HR.95L | HR.95H | P value | ||||||||||||||||||||||||||||||||||||||||||||||||||||||||||||||||||||||||||||||||||||||||||||||||
| CCNB1 | 1.342789 | 1.158325 | 1.556631 | 9.26E-05 | |||||||||||||||||||||||||||||||||||||||||||||||||||||||||||||||||||||||||||||||||||||||||||||||
| BIRC5 | 1.237655 | 1.087878 | 1.408052 | 0.001196 | |||||||||||||||||||||||||||||||||||||||||||||||||||||||||||||||||||||||||||||||||||||||||||||||
| AURKB | 1.169464 | 1.028468 | 1.329789 | 0.016931 | |||||||||||||||||||||||||||||||||||||||||||||||||||||||||||||||||||||||||||||||||||||||||||||||
| SGO1 | 1.48225 | 1.175871 | 1.868456 | 0.000864 | |||||||||||||||||||||||||||||||||||||||||||||||||||||||||||||||||||||||||||||||||||||||||||||||
| NUF2 | 1.192925 | 1.028004 | 1.384302 | 0.020137 | |||||||||||||||||||||||||||||||||||||||||||||||||||||||||||||||||||||||||||||||||||||||||||||||
| NUSAP1 | 1.290575 | 1.106949 | 1.50466 | 0.001124 | |||||||||||||||||||||||||||||||||||||||||||||||||||||||||||||||||||||||||||||||||||||||||||||||
| RAD51 | 1.388178 | 1.135332 | 1.697335 | 0.001388 | |||||||||||||||||||||||||||||||||||||||||||||||||||||||||||||||||||||||||||||||||||||||||||||||
| BUB1 | 1.277222 | 1.090771 | 1.495544 | 0.002373 | |||||||||||||||||||||||||||||||||||||||||||||||||||||||||||||||||||||||||||||||||||||||||||||||
| CENPA | 1.217873 | 1.05066 | 1.411697 | 0.008902 | |||||||||||||||||||||||||||||||||||||||||||||||||||||||||||||||||||||||||||||||||||||||||||||||
| BUB1B | 1.302922 | 1.108937 | 1.530841 | 0.001295 | |||||||||||||||||||||||||||||||||||||||||||||||||||||||||||||||||||||||||||||||||||||||||||||||
| NCAPH | 1.25077 | 1.075752 | 1.454262 | 0.003621 | |||||||||||||||||||||||||||||||||||||||||||||||||||||||||||||||||||||||||||||||||||||||||||||||
| MCM10 | 1.267074 | 1.055102 | 1.521632 | 0.01127 | |||||||||||||||||||||||||||||||||||||||||||||||||||||||||||||||||||||||||||||||||||||||||||||||
| ZWINT | 1.236082 | 1.063324 | 1.436908 | 0.005792 | |||||||||||||||||||||||||||||||||||||||||||||||||||||||||||||||||||||||||||||||||||||||||||||||
| SPC25 | 1.370872 | 1.142546 | 1.644827 | 0.00069 | |||||||||||||||||||||||||||||||||||||||||||||||||||||||||||||||||||||||||||||||||||||||||||||||
| RACGAP1 | 1.328666 | 1.119641 | 1.576713 | 0.001138 | |||||||||||||||||||||||||||||||||||||||||||||||||||||||||||||||||||||||||||||||||||||||||||||||
| SKA1 | 1.282937 | 1.081111 | 1.522442 | 0.004331 | |||||||||||||||||||||||||||||||||||||||||||||||||||||||||||||||||||||||||||||||||||||||||||||||
| PRC1 | 1.382863 | 1.175185 | 1.627241 | 9.45E-05 | |||||||||||||||||||||||||||||||||||||||||||||||||||||||||||||||||||||||||||||||||||||||||||||||
| ESPL1 | 1.275134 | 1.059703 | 1.534361 | 0.01005 | |||||||||||||||||||||||||||||||||||||||||||||||||||||||||||||||||||||||||||||||||||||||||||||||
| NCAPG | 1.317074 | 1.127774 | 1.538148 | 0.000504 | |||||||||||||||||||||||||||||||||||||||||||||||||||||||||||||||||||||||||||||||||||||||||||||||
| CCNA2 | 1.340231 | 1.162207 | 1.545524 | 5.64E-05 | |||||||||||||||||||||||||||||||||||||||||||||||||||||||||||||||||||||||||||||||||||||||||||||||
| TTK | 1.252381 | 1.058702 | 1.481491 | 0.008653 | |||||||||||||||||||||||||||||||||||||||||||||||||||||||||||||||||||||||||||||||||||||||||||||||
| FANCI | 1.356766 | 1.117141 | 1.647791 | 0.00209 | |||||||||||||||||||||||||||||||||||||||||||||||||||||||||||||||||||||||||||||||||||||||||||||||
| NEK2 | 1.337364 | 1.153986 | 1.549882 | 0.000112 | |||||||||||||||||||||||||||||||||||||||||||||||||||||||||||||||||||||||||||||||||||||||||||||||
| MCM6 | 1.273415 | 1.047534 | 1.548002 | 0.015262 | |||||||||||||||||||||||||||||||||||||||||||||||||||||||||||||||||||||||||||||||||||||||||||||||
| HJURP | 1.310447 | 1.131353 | 1.517893 | 0.000311 | |||||||||||||||||||||||||||||||||||||||||||||||||||||||||||||||||||||||||||||||||||||||||||||||
| CDCA5 | 1.301448 | 1.120259 | 1.511943 | 0.000572 | |||||||||||||||||||||||||||||||||||||||||||||||||||||||||||||||||||||||||||||||||||||||||||||||
| CDC20 | 1.200084 | 1.064279 | 1.353219 | 0.002914 | |||||||||||||||||||||||||||||||||||||||||||||||||||||||||||||||||||||||||||||||||||||||||||||||
| KPNA2 | 1.338003 | 1.13198 | 1.581524 | 0.000642 | |||||||||||||||||||||||||||||||||||||||||||||||||||||||||||||||||||||||||||||||||||||||||||||||
| ORC1 | 1.297608 | 1.075372 | 1.565772 | 0.006566 | |||||||||||||||||||||||||||||||||||||||||||||||||||||||||||||||||||||||||||||||||||||||||||||||
| FEN1 | 1.349571 | 1.101617 | 1.653334 | 0.0038 | |||||||||||||||||||||||||||||||||||||||||||||||||||||||||||||||||||||||||||||||||||||||||||||||
| Bold words mean P value is less than 0.05; Abbreviations: HR: hazard ratio; L: low; H: high. | |||||||||||||||||||||||||||||||||||||||||||||||||||||||||||||||||||||||||||||||||||||||||||||||||||
We also evaluated this model through Principal Component Analysis (PCA) and t-Distributed Stochastic Neighbor Embedding (t-SNE) analysis. Figure 6A shows that the high-risk and low-risk samples were well separated based on risk score. Figure 6B shows an increase in the proportion of patient deaths in the high-risk group. And the clinical heat map shows no differences in risk score in some clinical characteristics, including pathological stage and fustat (Figure 6C). Finally, ROC curve was utilized to judge the accuracy of this risk model for survival rate. The results showed that the AUC values at 1, 2 and 3 years were 0.668, 0.650 and 0.663 respectively (Figure 6D). This indicates that this prognostic model has a high accuracy.
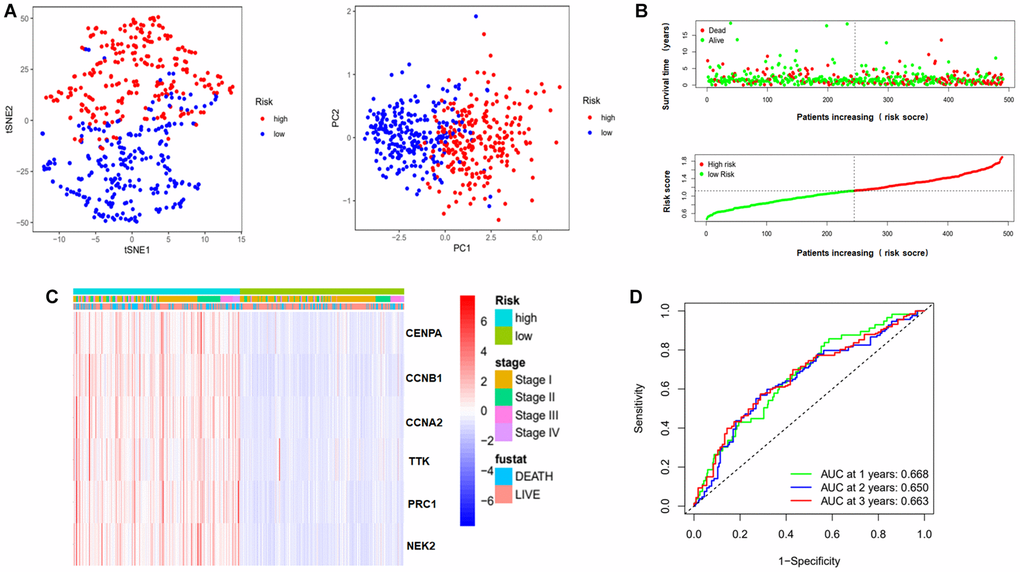
Figure 6. Evaluation of risk model. (A) PCA and t-SNE analysis to assess the sample of the risk model. Red dots represent high risk group, blue dots represent low risk group. (B) Risk score maps and survival status maps of patients in the high and low risk groups. In the survival status map, red dots represent death, green dots represent survival. In the risk score maps, green represents low risk and red represents high risk. (C) Clinical heat map representing the relationship between risk genes and clinical characteristics. (D) ROC curves to evaluate the prognostic effect of this model on overall survival at 1, 2, 3 years. Abbreviations: t-SNE: t-distributed stochastic neighbor embedding; PCA: Principal Component Analysis; AUC: area under the curve; ROC: receiver operating characteristic curve.
Evaluate the value of this risk model for clinical application
We sought to assess whether clinical characteristics corresponding to the risk score could also be used as independent risk factors to influence the prognosis of patients. We applied regression analyses calculated the risk score and their corresponding clinical characteristics. We obtained the following results. The univariate Cox regression analyses found that pathological stage, tumor size and risk score significantly affected the prognosis of LUAD patients (Figure 7A). Further, multivariate Cox regression analyses found that tumor size and risk score could significantly influence prognosis as independent risk factors (Figure 7B). A prognostic nomogram clinicopathological parameters was also established (Figure 7C). We then applied ROC curves to verify these results and the AUC values for the different clinical characteristics were risk score (0.678), gender (0.588), age (0.537), pathological stage (0.713), and tumor size (0.642) (Figure 7D). Considering the above results together, pathological staging can be also used as an independent risk factor for prognosis (Table 2).
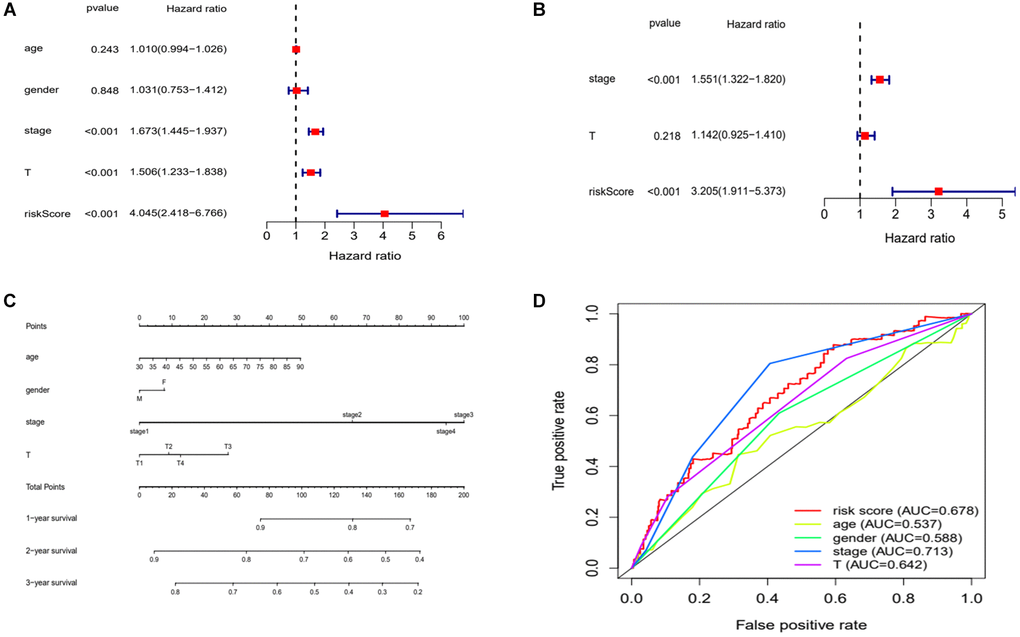
Figure 7. Evaluation of risk model. (A and B) Univariate and multivariate Cox analysis of risk scores and clinical characteristics. (C) A nomogram with clinical characteristics predicts 1,2,3 years OS of lung adenocarcinoma patients. (D) ROC curves for clinical characteristic. Abbreviations: AUC: area under the curve; ROC: receiver operating characteristic curve.
Table 2. Results of the risk score and clinical characteristics in the Univariate and Multivariate Cox regression analysis.
| Parameter | Univariate analysis | Multivariate analysis | |||||||||||||||||||||||||||||||||||||||||||||||||||||||||||||||||||||||||||||||||||||||||||||||||
| HR | HR.95L | HR.95H | P value | HR | HR.95L | HR.95H | P value | ||||||||||||||||||||||||||||||||||||||||||||||||||||||||||||||||||||||||||||||||||||||||||||
| age | 1.009622 | 0.993506 | 1.026 | 0.243439 | |||||||||||||||||||||||||||||||||||||||||||||||||||||||||||||||||||||||||||||||||||||||||||||||
| gender | 1.031244 | 0.753098 | 1.412119 | 0.847868 | |||||||||||||||||||||||||||||||||||||||||||||||||||||||||||||||||||||||||||||||||||||||||||||||
| stage | 1.672796 | 1.444746 | 1.936843 | 5.97E-12 | 1.551218 | 1.322385 | 1.81965 | 6.99E-08 | |||||||||||||||||||||||||||||||||||||||||||||||||||||||||||||||||||||||||||||||||||||||||||
| T | 1.505592 | 1.233059 | 1.838361 | 5.91E-05 | 1.141702 | 0.924765 | 1.409528 | 0.217757 | |||||||||||||||||||||||||||||||||||||||||||||||||||||||||||||||||||||||||||||||||||||||||||
| Risk Score | 4.045005 | 2.418103 | 6.766488 | 1.02E-07 | 3.204635 | 1.911201 | 5.373421 | 1.00E-05 | |||||||||||||||||||||||||||||||||||||||||||||||||||||||||||||||||||||||||||||||||||||||||||
| Bold words mean P value is less than 0.05; Abbreviations: HR: hazard ratio; L: low; H: high. | |||||||||||||||||||||||||||||||||||||||||||||||||||||||||||||||||||||||||||||||||||||||||||||||||||
Validating the prognosis and expression of the model risk genes
To verify the prognostic role of these genes, we calculated the survival curves of these genes (Figure 8A). The p-values of these curves were less than 0.05. Meanwhile, we also utilized other online databases GEPIA (http://gepia.cancer-pku.cn/detail.php?gene=DLGAP1-AS1) to verify the prognostic role of these genes and obtained similar results (Figure 8B). In summary, the results suggest that these genes have a good prognostic potential in lung adenocarcinoma.
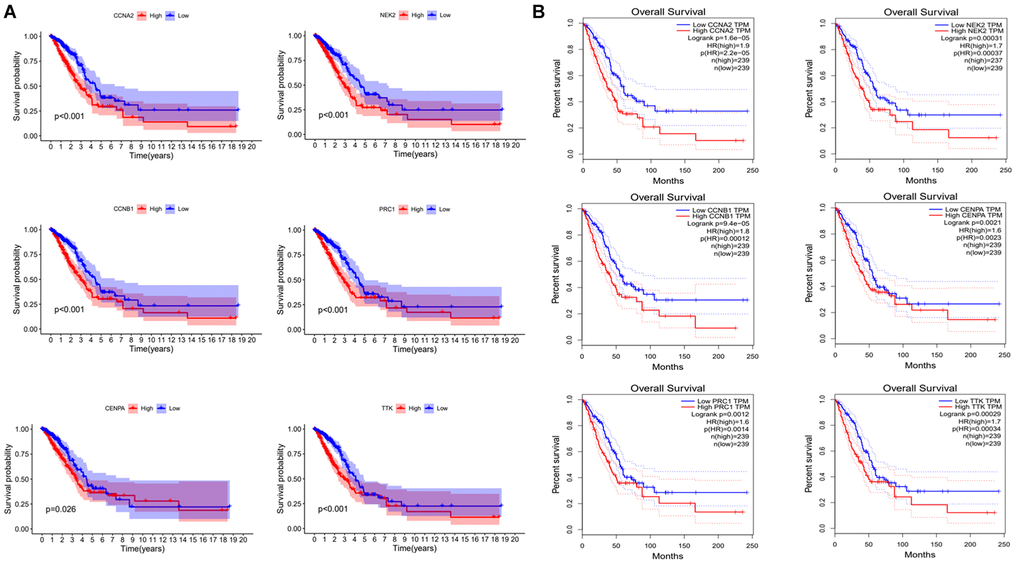
Figure 8. Validating the prognostic value of risk genes. (A) Combining TCGA clinical data and expression data to analyze OS of risk genes. (B) OS analysis of risk genes by using the GEPIA website.
Validation of mRNA expression levels of risk genes was performed using both TCGA pairwise analysis and GEO external verification. We first performed pairwise analysis of these six genes using the R package limma and ggpubr in the expression profile downloaded from TCGA. The pairwise analysis of CCNB1 and CENPA has been shown in Figure 4E. The remaining results were as shown in Figure 9A. Risk genes were abnormally high expressed in tumor tissue. We have also validated the expression of these genes by means of microarray. The GSE33532, GSE40791, GSE27262S datasets were used for external validation. As shown in Figure 9B, these risk genes were highly expressed in all three datasets, providing external validation of the expression.
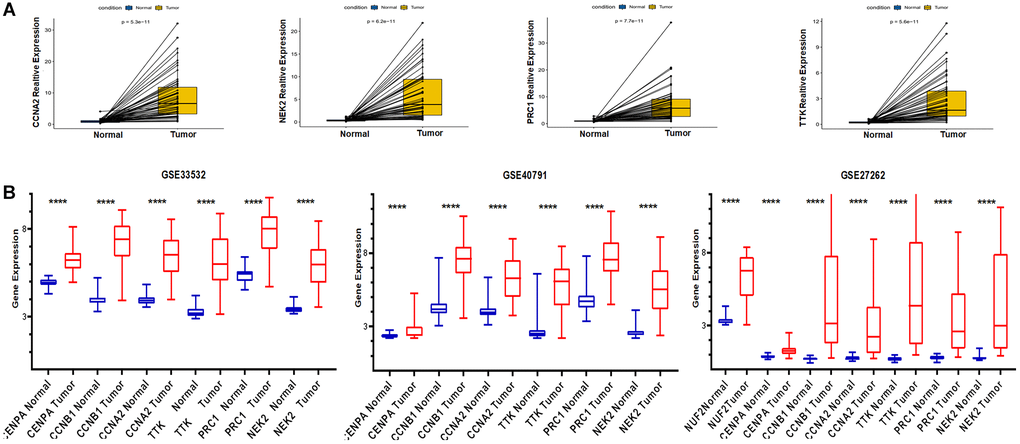
Figure 9. Application of TCGA and GEO databases to validate the expression of risk genes. (A) Pairwise analysis from TCGA. (B) GEO database external validation of risk genes expression.
Multi-gene set enrichment analysis
To more understand the role of this six-gene model in lung adenocarcinoma. We performed GSEA analysis of these six genes in different risk groups separately and show the functional enrichment results for the top 5 in the Figure 10. In the high-risk group these genes are mainly responsible for cell cycle, DNA replication, oocyte meiosis, spliceosome, proteasome, etc. In the low-risk group these genes are mainly associated with asthma, hematopoietic cell lineage, etc.
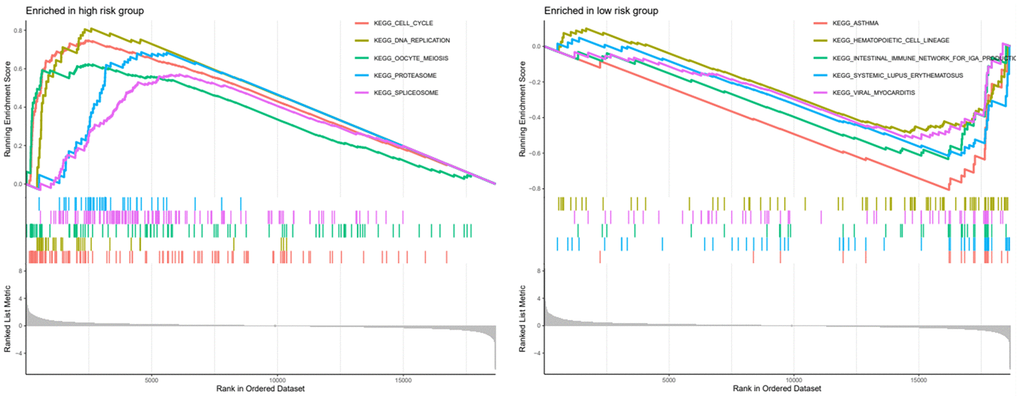
Figure 10. GSEA analysis of high and low risk groups and presentation of the top five analysis results.
CENPA possesses the ability to regulate the properties of tumor stem cells in LUAD
To further explore the biological functions and regulatory mechanisms of these genes in lung adenocarcinoma. We first selected the intersection of hub genes and risk model genes, and the result were CCNB1 and CENPA (Supplementary Figure 1). We then applied QPCR to screen the expression of both in the lung normal epithelial cell line BSAE-2B and the lung adenocarcinoma cell line A549, and finally identified CENPA as the final study target. As shown in Figure 11A, the expression of CENPA was approximately 3.4-fold higher in A549 than in BASE-2B and approximately 1.8-fold higher in CCNB1.
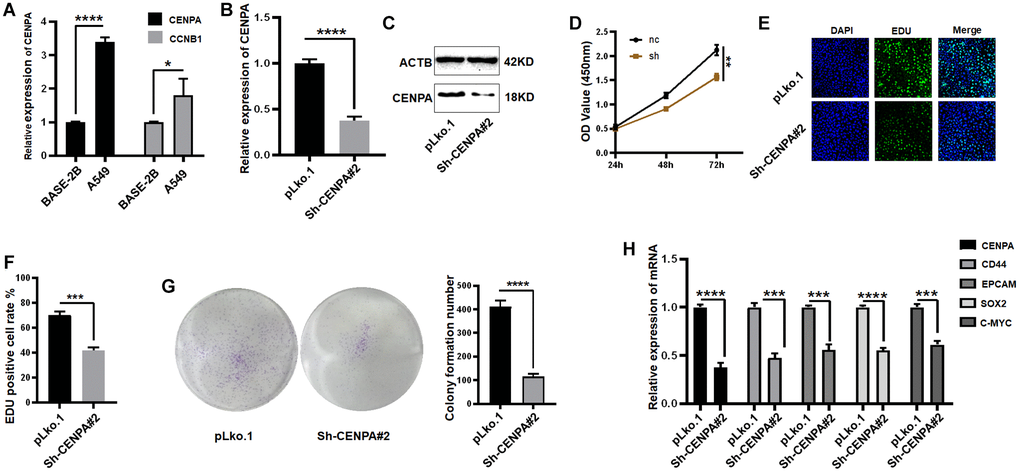
Figure 11. Identification of a risk prognostic gene regulating tumor stemness in lung adenocarcinoma cells in vitro. (A) Application of QPCR to compare CENPA and CCNB1 mRNA expression in tumor cells and normal epithelial cells. (B and C) QPCR and western blot to validate the effect of sh-RNA knockdown. (D–G) The effect of knocking down CENPA on cell proliferation ability was examined by CCK-8, EDU and clone formation respectively. (H) QPCR detection of tumor stem cell biomarkers. (*P < 0.05; **P < 0.01; ***P < 0.001; ****P < 0.0001).
A stable cell line was constructed by knocking down CENPA in the A549 cell by means of stable expression of small hairpin RNA. The knockdown efficiency of small hairpin RNA was approximately 65% (Figure 11B and 11C). CCK-8 assay was utilized to test the impact of CENPA knockdown on the proliferative capacity of the cells. The results showed that knockdown of CENPA caused ~26% reduction in proliferative capacity (Figure 11D). Subsequent EDU and colony formation assays also yielded similar results (Figure 11E–11G). We then equally explored the effect of knockdown CENPA on the maintenance of tumor stemness.
First, we used QPCR to detect several commonly used biomarkers of cancer stem cells, which are CD44, EpCAM, SOX2, C-MYC. As shown in Figure 11H, when CENPA was knocked down, the levels of these cancer stem cell biomarkers were significantly decreased. Then we utilized western blot and immunofluorescence techniques to the detect protein level expression of these biomarkers (Figure 12A and 12B). The results were consistent with the mRNA levels. The knockdown of CENPA would affect the expression of these indicators.
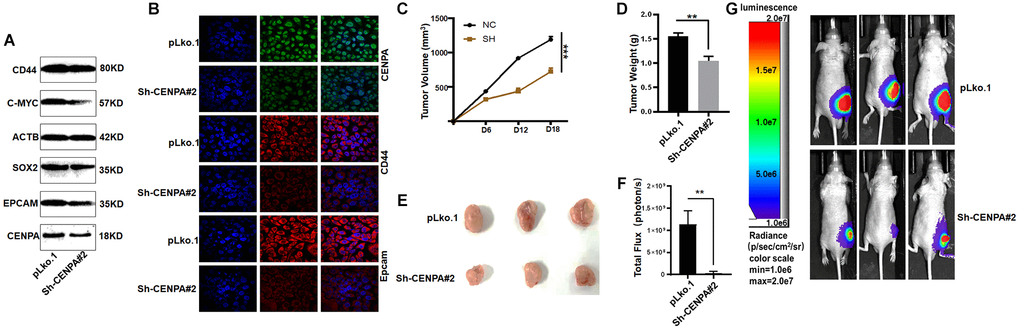
Figure 12. Validating the effect of CENPA on tumors in vivo. (A and B) Validation of protein expression levels of cancer stem cell biomarkers by western blot and immunofluorescence. (C) Tumor volume curve of control group and knockdown group. (D) Tumor weights in control and knockdown groups. (E) Image of xenograft tumors in different groups of mice. (F and G) Animal imaging technology to detect differences between control and knockdown groups. (*P < 0.05; **P < 0.01; ***P < 0.001; ****P < 0.0001).
To more accurately evaluate the effect of CENPA on tumors in vivo, CENPA-knockdown stably transfected cell lines and control cells were injected subcutaneously into immunodeficient nude mice at the same time. The object of this experiment is to test whether CENPA affects tumor growth in vivo. After 18 days of in vivo incubation, we found a significant decrease in tumor volume and weight in the knockdown group compared to the control group. The average decrease in tumor weight in the experimental group was 0.5 grams and average decrease in tumor volume was 460 cubic millimetres (Figure 12C–12E). The results obtained from the animal imaging technique were similar to those described above, with the control group showing a significantly higher fluorescence signal than the test (Figure 12F and 12G). Such results suggest that CENPA expression is strongly associated with tumorigenesis and progression.
Discussion
Tumor stem cells play an integral role in the development, progression, metastasis, invasion, drug resistance and recurrence of various tumors [7, 20]. It is therefore particularly significant to identify genes that are highly associated with tumor stem cell properties and to investigate the mechanisms by which these genes regulate tumor stemness. Malta et al. used the innovative one-class logistic regression machine-learning (OCLR) algorithm in combination with public data from TCGA database to obtain two cancer stemness indices, one (mRNAsi) for gene expression assessment and the other (mDNAsi) for gene epigenetic modification assessment. This parameter has been used to identify tumor stem cell-associated genes in a variety of cancers, such as endometrial cancer, gastric cancer, pancreatic cancer, etc. We then screened for differentially expressed genes in preparation for subsequent studies.
We correlated mRNAsi with gene expression through WGCNA. By the correlation coefficients of the different modules, we selected the module with the largest positive association with mRNAsi. We then extracted the expression data of the genes in this module and performed functional enrichment analysis. The results showed that these key genes are mainly responsible for and involved in cell cycle, chromosome segregation, centrosome assignment, etc. These results are consistent with the current view that tumor stem cells possess a strong capacity for self-renewal [21]. By using the Protein-Protein Interaction Networks and the software Cytoscape, we screened ten hub genes, of which CDC20 is marked in red for high correlation. Previous findings have discovered that CDC20 plays a significant function in the maintenance of tumor stem cell properties. Knockdown of CDC20 inhibited the expression of stem cell properties, self-renewal capacity, chemoresistance, invasiveness and tumorigenicity-related genes in prostate CSCs. In addition, CDC20 was able to promote the degradation of core members of the Axin1 and β-linked protein disruption complexes, followed by reduced phosphorylation of β-linked proteins, thereby promoting the entry of β-linked proteins into the nucleus to enhance the self-renewal capacity of CD44+ prostate CSCs [22].
The mRNAsi-based risk model has been applied to many cancers. According to this, we created a six-gene risk model. And the results of the Kaplan-Meier analysis showed that patients in the high-risk group possess a poor prognosis. Risk score and clinicopathological stage could be used as independent prognostic factors after univariate and multivariate Cox regression analysis. This suggests that this risk model can be used in conjunction with clinicopathological stage to determine a patient’s prognostic risk, allowing for individual precision in the treatment and management of patients.
All of the above risk-associated genes are involved in the cell cycle .Never in mitosis gene A-related kinase 2 (NEK2) is a cell cycle-regulating serine-threonine protein kinase, and several reports have focused on its role in chromosome instability, tumorigenesis and resistance to chemotherapy [23–25]. It has been found to be abnormal expressed in various tumors such as colon, prostate and pancreas [26–30]. Serine threonine protein kinase (TTK), also known as monopolar spindle1, is an indispensable component of the spindle assembly checkpoint, and is overexpressed in various tumors and also plays a momentous function in the development and maintaining tumor stem cells [31]. Its main function is responsible for chromosome segregation and DNA damage repair [32]. In triple negative breast cancer, overexpression of TTK is associated with tumor progression and prognosis, and its knockdown inhibits cancer cell invasion and proliferation [33, 34]. Protein Regulator of Cytokinesis 1(PRC1) is a microtubule-associated protein. In ovarian and cholangiocarcinoma, patient with abnormal expression of PRC1 had poor prognosis [35, 36]. In this study, our findings were consistent with previous studies in which PRC1 was highly expressed in lung adenocarcinoma and correlated with patient prognosis [37]. CCNB1 and CCNA2 are up-regulated in a variety of tumors and promote tumor proliferation, and also have a prognostic role [38, 39]. In ovarian, hepatocellular and prostate cancers, CENPA functions as a promoter of tumor growth, proliferation and migration [40–42]. In this study, we also found that patients who are high in CENPA expression in lung adenocarcinoma hold a poor prognosis, which is consistent with previous findings [43]. Subsequently, CENPA was found to own the ability to regulate tumor stemness and proliferation in in vivo and in vitro studies However, our study appears to be the first to suggest that CENPA not only regulates tumor stemness but also has an independent prognostic effect in lung adenocarcinoma. This provides a new direction and target for follow-up research and treatment.
In summary, we have analyzed mRNAsi-related genes in lung adenocarcinoma and developed a risk model. This provides a new way to study the stem cell mechanism of lung adenocarcinoma and the prognosis of patients. In addition, it has been experimentally verified that CENPA has the ability to regulate tumor stemness. However, some limitations of our study still exist. Firstly, this study was unable to validate the risk model using external data sets because no clinical information was available for lung adenocarcinoma in databases such as GEO and ICGC. Second, the mechanisms by which CENPA regulates tumor cell stemness need to be investigated in more detail. In future studies, we will apply more comprehensive clinical information and data sets for validation and will design more detailed in vivo and in vitro experiments to verify its regulatory mechanisms.
Supplementary Materials
Author Contributions
Y.Q.Y., X.H.L. and J.P.L. designed research; Y.X., H.L., Y.Q.Y and Q.B.Z. performed research. Y.X., Y.Q.Y., C.L., and C.C.X. analyzed data. Y.Q.Y. wrote the paper. Y.X., Y.Q.Y., H.L., H.M, Z. and J.W. participated in the revision of the manuscript. All authors read and approved the final manuscript.
Conflicts of Interest
The authors declare no conflicts of interest related to this study.
Funding
This work was financially supported by National Natural Science Foundation of China (No. 31501149, 31770815, 31570764) and Hubei Natural Science Foundation (No. 2021CFB230, 2017CFB537) and Educational Commission of Hubei (B2020001), Science and Education Joint Project of Hunan Natural Science and Technology Fund (2020JJ7072), Hubei Province Technology Innovation Special Major Project (2019ACA168), Wuhan Municipal Health Commission Project (WX21Q49).
References
- 1. Coleman MP, Quaresma M, Berrino F, Lutz JM, De Angelis R, Capocaccia R, Baili P, Rachet B, Gatta G, Hakulinen T, Micheli A, Sant M, Weir HK, et al, and CONCORD Working Group. Cancer survival in five continents: a worldwide population-based study (CONCORD). Lancet Oncol. 2008; 9:730–56. https://doi.org/10.1016/S1470-2045(08)70179-7 [PubMed]
- 2. GBD 2015 Mortality and Causes of Death Collaborators. Global, regional, and national life expectancy, all-cause mortality, and cause-specific mortality for 249 causes of death, 1980-2015: a systematic analysis for the Global Burden of Disease Study 2015. Lancet. 2016; 388:1459–544. https://doi.org/10.1016/S0140-6736(16)31012-1 [PubMed]
- 3. Wang W, He J, Lu H, Kong Q, Lin S. KRT8 and KRT19, associated with EMT, are hypomethylated and overexpressed in lung adenocarcinoma and link to unfavorable prognosis. Biosci Rep. 2020; 40:BSR20193468. https://doi.org/10.1042/BSR20193468 [PubMed]
- 4. Dai ZT, Xiang Y, Wang Y, Bao LY, Wang J, Li JP, Zhang HM, Lu Z, Ponnambalam S, Liao XH. Prognostic value of members of NFAT family for pan-cancer and a prediction model based on NFAT2 in bladder cancer. Aging (Albany NY). 2021; 13:13876–97. https://doi.org/10.18632/aging.202982 [PubMed]
- 5. Langfelder P, Horvath S. WGCNA: an R package for weighted correlation network analysis. BMC Bioinformatics. 2008; 9:559. https://doi.org/10.1186/1471-2105-9-559 [PubMed]
- 6. Liang W, Sun F, Zhao Y, Shan L, Lou H. Identification of Susceptibility Modules and Genes for Cardiovascular Disease in Diabetic Patients Using WGCNA Analysis. J Diabetes Res. 2020; 2020:4178639. https://doi.org/10.1155/2020/4178639 [PubMed]
- 7. Eun K, Ham SW, Kim H. Cancer stem cell heterogeneity: origin and new perspectives on CSC targeting. BMB Rep. 2017; 50:117–25. https://doi.org/10.5483/bmbrep.2017.50.3.222 [PubMed]
- 8. Plaks V, Kong N, Werb Z. The cancer stem cell niche: how essential is the niche in regulating stemness of tumor cells? Cell Stem Cell. 2015; 16:225–38. https://doi.org/10.1016/j.stem.2015.02.015 [PubMed]
- 9. Thakur R, Kumari N, Mishra DP. Isolation and characterization of cancer stem cells. Protocol Handbook for Cancer Biology. 2021; 87–105. https://doi.org/10.1016/B978-0-323-90006-5.00007-0
- 10. Malta TM, Sokolov A, Gentles AJ, Burzykowski T, Poisson L, Weinstein JN, Kamińska B, Huelsken J, Omberg L, Gevaert O, Colaprico A, Czerwińska P, Mazurek S, et al, and Cancer Genome Atlas Research Network. Machine Learning Identifies Stemness Features Associated with Oncogenic Dedifferentiation. Cell. 2018; 173:338–54.e15. https://doi.org/10.1016/j.cell.2018.03.034 [PubMed]
- 11. Ritchie ME, Phipson B, Wu D, Hu Y, Law CW, Shi W, Smyth GK. limma powers differential expression analyses for RNA-sequencing and microarray studies. Nucleic Acids Res. 2015; 43:e47. https://doi.org/10.1093/nar/gkv007 [PubMed]
- 12. Ito K, Murphy D. Application of ggplot2 to Pharmacometric Graphics. CPT Pharmacometrics Syst Pharmacol. 2013; 2:e79. https://doi.org/10.1038/psp.2013.56 [PubMed]
- 13. Chin CH, Chen SH, Wu HH, Ho CW, Ko MT, Lin CY. cytoHubba: identifying hub objects and sub-networks from complex interactome. BMC Syst Biol. 2014 (Suppl 4); 8:S11. https://doi.org/10.1186/1752-0509-8-S4-S11 [PubMed]
- 14. Doncheva NT, Morris JH, Gorodkin J, Jensen LJ. Cytoscape StringApp: Network Analysis and Visualization of Proteomics Data. J Proteome Res. 2019; 18:623–32. https://doi.org/10.1021/acs.jproteome.8b00702 [PubMed]
- 15. Yu G, Wang LG, Han Y, He QY. clusterProfiler: an R package for comparing biological themes among gene clusters. OMICS. 2012; 16:284–7. https://doi.org/10.1089/omi.2011.0118 [PubMed]
- 16. Friedman J, Hastie T, Tibshirani R. Regularization Paths for Generalized Linear Models via Coordinate Descent. J Stat Softw. 2010; 33:1–22. https://doi.org/10.18637/jss.v033.i01 [PubMed]
- 17. Lee TF, Chao PJ, Ting HM, Chang L, Huang YJ, Wu JM, Wang HY, Horng MF, Chang CM, Lan JH, Huang YY, Fang FM, Leung SW. Using multivariate regression model with least absolute shrinkage and selection operator (LASSO) to predict the incidence of Xerostomia after intensity-modulated radiotherapy for head and neck cancer. PLoS One. 2014; 9:e89700. https://doi.org/10.1371/journal.pone.0089700 [PubMed]
- 18. Subramanian A, Tamayo P, Mootha VK, Mukherjee S, Ebert BL, Gillette MA, Paulovich A, Pomeroy SL, Golub TR, Lander ES, Mesirov JP. Gene set enrichment analysis: a knowledge-based approach for interpreting genome-wide expression profiles. Proc Natl Acad Sci U S A. 2005; 102:15545–50. https://doi.org/10.1073/pnas.0506580102 [PubMed]
- 19. Mootha VK, Lindgren CM, Eriksson KF, Subramanian A, Sihag S, Lehar J, Puigserver P, Carlsson E, Ridderstråle M, Laurila E, Houstis N, Daly MJ, Patterson N, et al. PGC-1alpha-responsive genes involved in oxidative phosphorylation are coordinately downregulated in human diabetes. Nat Genet. 2003; 34:267–73. https://doi.org/10.1038/ng1180 [PubMed]
- 20. Zhang Z, Chen X, Zhang J, Dai X. Cancer stem cell transcriptome landscape reveals biomarkers driving breast carcinoma heterogeneity. Breast Cancer Res Treat. 2021; 186:89–98. https://doi.org/10.1007/s10549-020-06045-y [PubMed]
- 21. Yang L, Shi P, Zhao G, Xu J, Peng W, Zhang J, Zhang G, Wang X, Dong Z, Chen F, Cui H. Targeting cancer stem cell pathways for cancer therapy. Signal Transduct Target Ther. 2020; 5:8. https://doi.org/10.1038/s41392-020-0110-5 [PubMed]
- 22. Zhang Q, Huang H, Liu A, Li J, Liu C, Sun B, Chen L, Gao Y, Xu D, Su C. Cell division cycle 20 (CDC20) drives prostate cancer progression via stabilization of β-catenin in cancer stem-like cells. EBioMedicine. 2019; 42:397–407. https://doi.org/10.1016/j.ebiom.2019.03.032 [PubMed]
- 23. Hayward DG, Fry AM. Nek2 kinase in chromosome instability and cancer. Cancer Lett. 2006; 237:155–66. https://doi.org/10.1016/j.canlet.2005.06.017 [PubMed]
- 24. Lee MY, Moreno CS, Saavedra HI. E2F activators signal and maintain centrosome amplification in breast cancer cells. Mol Cell Biol. 2014; 34:2581–99. https://doi.org/10.1128/MCB.01688-13 [PubMed]
- 25. Lin S, Zhou S, Jiang S, Liu X, Wang Y, Zheng X, Zhou H, Li X, Cai X. NEK2 regulates stem-like properties and predicts poor prognosis in hepatocellular carcinoma. Oncol Rep. 2016; 36:853–62. https://doi.org/10.3892/or.2016.4896 [PubMed]
- 26. Tsunoda N, Kokuryo T, Oda K, Senga T, Yokoyama Y, Nagino M, Nimura Y, Hamaguchi M. Nek2 as a novel molecular target for the treatment of breast carcinoma. Cancer Sci. 2009; 100:111–6. https://doi.org/10.1111/j.1349-7006.2008.01007.x [PubMed]
- 27. Wang S, Li W, Lv S, Wang Y, Liu Z, Zhang J, Liu T, Niu Y. Abnormal expression of Nek2 and β-catenin in breast carcinoma: clinicopathological correlations. Histopathology. 2011; 59:631–42. https://doi.org/10.1111/j.1365-2559.2011.03941.x [PubMed]
- 28. Zhou W, Yang Y, Xia J, Wang H, Salama ME, Xiong W, Xu H, Shetty S, Chen T, Zeng Z, Shi L, Zangari M, Miles R, et al. NEK2 induces drug resistance mainly through activation of efflux drug pumps and is associated with poor prognosis in myeloma and other cancers. Cancer Cell. 2013; 23:48–62. https://doi.org/10.1016/j.ccr.2012.12.001 [PubMed]
- 29. Naro C, Barbagallo F, Chieffi P, Bourgeois CF, Paronetto MP, Sette C. The centrosomal kinase NEK2 is a novel splicing factor kinase involved in cell survival. Nucleic Acids Res. 2014; 42:3218–27. https://doi.org/10.1093/nar/gkt1307 [PubMed]
- 30. Kokuryo T, Hibino S, Suzuki K, Watanabe K, Yokoyama Y, Nagino M, Senga T, Hamaguchi M. Nek2 siRNA therapy using a portal venous port-catheter system for liver metastasis in pancreatic cancer. Cancer Sci. 2016; 107:1315–20. https://doi.org/10.1111/cas.12993 [PubMed]
- 31. Park JH, Chung S, Matsuo Y, Nakamura Y. Development of small molecular compounds targeting cancer stem cells. Medchemcomm. 2016; 8:73–80. https://doi.org/10.1039/c6md00385k [PubMed]
- 32. Wei JH, Chou YF, Ou YH, Yeh YH, Tyan SW, Sun TP, Shen CY, Shieh SY. TTK/hMps1 participates in the regulation of DNA damage checkpoint response by phosphorylating CHK2 on threonine 68. J Biol Chem. 2005; 280:7748–57. https://doi.org/10.1074/jbc.M410152200 [PubMed]
- 33. Tang J, Lu M, Cui Q, Zhang D, Kong D, Liao X, Ren J, Gong Y, Wu G. Overexpression of ASPM, CDC20, and TTK Confer a Poorer Prognosis in Breast Cancer Identified by Gene Co-expression Network Analysis. Front Oncol. 2019; 9:310. https://doi.org/10.3389/fonc.2019.00310 [PubMed]
- 34. Zhang L, Jiang B, Zhu N, Tao M, Jun Y, Chen X, Wang Q, Luo C. Mitotic checkpoint kinase Mps1/TTK predicts prognosis of colon cancer patients and regulates tumor proliferation and differentiation via PKCα/ERK1/2 and PI3K/Akt pathway. Med Oncol. 2019; 37:5. https://doi.org/10.1007/s12032-019-1320-y [PubMed]
- 35. Bu H, Li Y, Jin C, Yu H, Wang X, Chen J, Wang Y, Ma Y, Zhang Y, Kong B. Overexpression of PRC1 indicates a poor prognosis in ovarian cancer. Int J Oncol. 2020; 56:685–96. https://doi.org/10.3892/ijo.2020.4959 [PubMed]
- 36. Wang Q, Lu S, Chen Y, He H, Lu W, Lin K. Analysis of transcriptome in the relationship between expression of PRC1 protein and prognosis of patients with cholangiocarcinoma. J Int Med Res. 2021; 49:300060521989200. https://doi.org/10.1177/0300060521989200 [PubMed]
- 37. Zhan P, Zhang B, Xi GM, Wu Y, Liu HB, Liu YF, Xu WJ, Zhu QQ, Cai F, Zhou ZJ, Miu YY, Wang XX, Jin JJ, et al. PRC1 contributes to tumorigenesis of lung adenocarcinoma in association with the Wnt/β-catenin signaling pathway. Mol Cancer. 2017; 16:108. https://doi.org/10.1186/s12943-017-0682-z [PubMed]
- 38. Brcic L, Heidinger M, Sever AZ, Zacharias M, Jakopovic M, Fediuk M, Maier A, Quehenberger F, Seiwerth S, Popper H. Prognostic value of cyclin A2 and B1 expression in lung carcinoids. Pathology. 2019; 51:481–6. https://doi.org/10.1016/j.pathol.2019.03.011 [PubMed]
- 39. Ersvær E, Kildal W, Vlatkovic L, Cyll K, Pradhan M, Kleppe A, Hveem TS, Askautrud HA, Novelli M, Wæhre H, Liestøl K, Danielsen HE. Prognostic value of mitotic checkpoint protein BUB3, cyclin B1, and pituitary tumor-transforming 1 expression in prostate cancer. Mod Pathol. 2020; 33:905–15. https://doi.org/10.1038/s41379-019-0418-2 [PubMed]
- 40. Saha AK, Contreras-Galindo R, Niknafs YS, Iyer M, Qin T, Padmanabhan K, Siddiqui J, Palande M, Wang C, Qian B, Ward E, Tang T, Tomlins SA, et al. The role of the histone H3 variant CENPA in prostate cancer. J Biol Chem. 2020; 295:8537–49. https://doi.org/10.1074/jbc.RA119.010080 [PubMed]
- 41. Zhang Y, Yang L, Shi J, Lu Y, Chen X, Yang Z. The Oncogenic Role of CENPA in Hepatocellular Carcinoma Development: Evidence from Bioinformatic Analysis. Biomed Res Int. 2020; 2020:3040839. https://doi.org/10.1155/2020/3040839 [PubMed]
- 42. Han J, Xie R, Yang Y, Chen D, Liu L, Wu J, Li S. CENPA is one of the potential key genes associated with the proliferation and prognosis of ovarian cancer based on integrated bioinformatics analysis and regulated by MYBL2. Transl Cancer Res. 2021; 10:4076–86. https://doi.org/10.21037/tcr-21-175 [PubMed]
- 43. Zhou H, Bian T, Qian L, Zhao C, Zhang W, Zheng M, Zhou H, Liu L, Sun H, Li X, Zhang J, Liu Y. Prognostic model of lung adenocarcinoma constructed by the CENPA complex genes is closely related to immune infiltration. Pathol Res Pract. 2021; 228:153680. https://doi.org/10.1016/j.prp.2021.153680 [PubMed]