Submit an Article
Navigate
Home
Editorial Board
Editorial Policies
Current Volume
Archive
Scientific Integrity
Publication Ethics Statements
Interviews with Outstanding Authors
Newsroom
Sponsored Conferences
Podcast
Contact
Special Collections
Submit an Article
Online ISSN: 1945-4589
Research Paper
|
Volume 14, Issue 13
|
pp. 5537–5553
CENPA regulates tumor stemness in lung adenocarcinoma
Back to article
Figure 10
(10 of 12)
−
100%
+
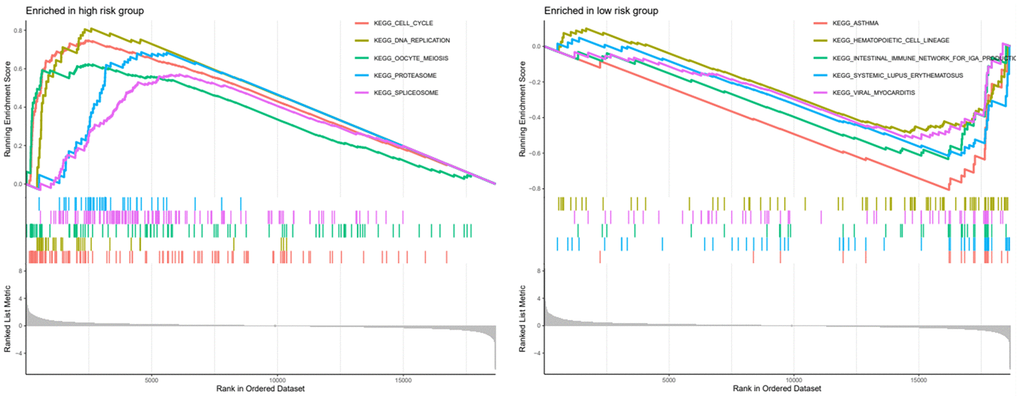
Figure 10.
GSEA analysis of high and low risk groups and presentation of the top five analysis results.