


Introduction
Gastric cancer (GC) is a fatal disease ranking the third cause leading to death in tumors, which is a serious public health problem [1]. The molecular heterogeneity of cancer is a main factor that determines the clinical outcome. In cancer research, histological normality also implies molecular normality. However, this assumption cannot be applied to normal tissues adjacent to tumors (NAT) [2]. Although there is no specific pathological change in NAT, it has changed at the molecular level [3]. Compared with healthy tissues, NAT has molecular changes already, such as transcription and epigenetic aberrations [4], allele imbalances and changes in telomere length [5]. In addition, the tumor microenvironment will also promote cell cancerization [6]. Therefore, it is difficult to obtain accurate differential genes, and easy to miss some important genes when taking NAT as a healthy sample [7].
Here, we introduce the Genotype-Tissue Expression (GTEx) project: the data comes from the autopsy samples of 714 healthy donors, covering the information of genotype, gene expression, histology, and clinical data in 53 organizations [8, 9]. This project provides a new perspective for studying the genetic variation of tumors and changes in cell biology [10]. The Cancer Genome Atlas (TCGA), a landmark cancer genomics program, molecularly characterized over 20,000 primary cancer and matched normal samples spanning 33 cancer types.
Long non-coding RNA (lncRNA) has abnormal expression in GC [11, 12]. They promote GC cell proliferation, migration and inhibit cell apoptosis [13, 14]. Therefore, lncRNAs can be used as biomarkers for early detecting of GC. And a combination of multiple lncRNAs can increase the accuracy of prediction [15].
In this study, we integrated the GTEx and TCGA databases to compare the differential genes between healthy and cancer samples. Five lncRNAs were finally selected out to make a prognostic model. TCGA database verified that the prognostic model could predict overall survival (OS) in GC patients.
Results
Patients characteristics
Original RNA-Seq expression and clinical data of healthy tissues from 191 donors were recruited on the GTEx website (https://gtexportal.org/) before January 28, 2020. Raw RNA-seq expression and clinical data of 375 GC patients were downloaded from the TCGA database (https://www.cancer.gov/) until January 31, 2020. All the characteristics of the healthy donors and GC patients are shown in Table 1.
Table 1. Summary clinical characteristics of patients.
| Characteristics | Normal group (GTEx n=191) | Cancer group (TCGA n=375) | |||||||||||||||||||||||||||||||||||||||||||||||||||||||||||||||||||||||||||||||||||||||||||||||||
| Age category | |||||||||||||||||||||||||||||||||||||||||||||||||||||||||||||||||||||||||||||||||||||||||||||||||||
| <60/≥60/NA | 156/35/0 | 112/259/4 | |||||||||||||||||||||||||||||||||||||||||||||||||||||||||||||||||||||||||||||||||||||||||||||||||
| Gender | |||||||||||||||||||||||||||||||||||||||||||||||||||||||||||||||||||||||||||||||||||||||||||||||||||
| Male/ Female | 110/81 | 241/134 | |||||||||||||||||||||||||||||||||||||||||||||||||||||||||||||||||||||||||||||||||||||||||||||||||
| Vital status | |||||||||||||||||||||||||||||||||||||||||||||||||||||||||||||||||||||||||||||||||||||||||||||||||||
| Alive/ Dead | 0/191 | 244/131 | |||||||||||||||||||||||||||||||||||||||||||||||||||||||||||||||||||||||||||||||||||||||||||||||||
| Race | |||||||||||||||||||||||||||||||||||||||||||||||||||||||||||||||||||||||||||||||||||||||||||||||||||
| White/ Black/ Asian/ NA | NA | 237/11/74/53 | |||||||||||||||||||||||||||||||||||||||||||||||||||||||||||||||||||||||||||||||||||||||||||||||||
| Death Circumstances | |||||||||||||||||||||||||||||||||||||||||||||||||||||||||||||||||||||||||||||||||||||||||||||||||||
| D0/D1/D2/D3/D4 | 168/3/13/3/4 | NA | |||||||||||||||||||||||||||||||||||||||||||||||||||||||||||||||||||||||||||||||||||||||||||||||||
| Tumor stage | |||||||||||||||||||||||||||||||||||||||||||||||||||||||||||||||||||||||||||||||||||||||||||||||||||
| I/ II/ III/ IV/ NA | NA | 53/111/150/38/23 | |||||||||||||||||||||||||||||||||||||||||||||||||||||||||||||||||||||||||||||||||||||||||||||||||
| T stage | |||||||||||||||||||||||||||||||||||||||||||||||||||||||||||||||||||||||||||||||||||||||||||||||||||
| T1/ T2/ T3/ T4/ NA | NA | 19/80/168/100/8 | |||||||||||||||||||||||||||||||||||||||||||||||||||||||||||||||||||||||||||||||||||||||||||||||||
| M stage | |||||||||||||||||||||||||||||||||||||||||||||||||||||||||||||||||||||||||||||||||||||||||||||||||||
| M0/ M1/ MX | NA | 330/25/20 | |||||||||||||||||||||||||||||||||||||||||||||||||||||||||||||||||||||||||||||||||||||||||||||||||
| N stage | |||||||||||||||||||||||||||||||||||||||||||||||||||||||||||||||||||||||||||||||||||||||||||||||||||
| N0/ N1 / N2/N3/NX | NA | 111/97/75/74/18 | |||||||||||||||||||||||||||||||||||||||||||||||||||||||||||||||||||||||||||||||||||||||||||||||||
| Histologic grade | |||||||||||||||||||||||||||||||||||||||||||||||||||||||||||||||||||||||||||||||||||||||||||||||||||
| G1/ G2/ G3/ GX | NA | 10/137/219/9 | |||||||||||||||||||||||||||||||||||||||||||||||||||||||||||||||||||||||||||||||||||||||||||||||||
| Death Circumstances: D0: Ventilator Case; D1: Violent and fast death; D2: Fast death of natural causes; D3: Intermediate death; D4: Slow death; NA, NX, MX, GX: Clinical data are unknown. | |||||||||||||||||||||||||||||||||||||||||||||||||||||||||||||||||||||||||||||||||||||||||||||||||||
Selection of differential lncRNAs and establishment of the prognostic model
A total of 1641 differential genes were screened out, among which 886 were up-regulated (54.0%) and 755 were down-regulated (46.0%). 11 differential lncRNAs most relevant to the patient's OS were screened out according to the P value (P <0.001) (Table 2).
Table 2. lncRNA predictors by univariate cox analysis.
| LncRNA | HR | z | p-value | ||||||||||||||||||||||||||||||||||||||||||||||||||||||||||||||||||||||||||||||||||||||||||||||||
| LINC00919 | 1.570357 | 4.733196 | 2.21E-06* | ||||||||||||||||||||||||||||||||||||||||||||||||||||||||||||||||||||||||||||||||||||||||||||||||
| AC010457.1 | 1.333 | 4.462278 | 8.11E-06* | ||||||||||||||||||||||||||||||||||||||||||||||||||||||||||||||||||||||||||||||||||||||||||||||||
| MIR217HG | 1.398173 | 3.899361 | 9.64E-05* | ||||||||||||||||||||||||||||||||||||||||||||||||||||||||||||||||||||||||||||||||||||||||||||||||
| AL022316.1 | 0.804911 | -3.73495 | 0.000188* | ||||||||||||||||||||||||||||||||||||||||||||||||||||||||||||||||||||||||||||||||||||||||||||||||
| TRHDE-AS1 | 1.135597 | 3.70907 | 0.000208* | ||||||||||||||||||||||||||||||||||||||||||||||||||||||||||||||||||||||||||||||||||||||||||||||||
| AP000695.1 | 1.290631 | 3.609454 | 0.000307* | ||||||||||||||||||||||||||||||||||||||||||||||||||||||||||||||||||||||||||||||||||||||||||||||||
| AC107021.2 | 1.291236 | 3.569529 | 0.000358* | ||||||||||||||||||||||||||||||||||||||||||||||||||||||||||||||||||||||||||||||||||||||||||||||||
| AP000695.2 | 1.2453 | 3.473397 | 0.000514* | ||||||||||||||||||||||||||||||||||||||||||||||||||||||||||||||||||||||||||||||||||||||||||||||||
| AC005586.1 | 0.771899 | -3.32525 | 0.000883* | ||||||||||||||||||||||||||||||||||||||||||||||||||||||||||||||||||||||||||||||||||||||||||||||||
| AC037198.1 | 1.202342 | 3.320859 | 0.000897* | ||||||||||||||||||||||||||||||||||||||||||||||||||||||||||||||||||||||||||||||||||||||||||||||||
| LINC02408 | 1.217608 | 3.318819 | 0.000904* | ||||||||||||||||||||||||||||||||||||||||||||||||||||||||||||||||||||||||||||||||||||||||||||||||
| HR, Hazard ratio; *: P<0.001. | |||||||||||||||||||||||||||||||||||||||||||||||||||||||||||||||||||||||||||||||||||||||||||||||||||
Multivariate cox analysis was performed on the obtained differential genes. A 5-lncRNA prognosis model was established with the highest AIC (Akaike Information Criterion) score of 1456.13 (Table 3).
Table 3. The detailed information of 5 lncRNAs for GC patients.
| LncRNA | Coef | Exp (coef) | Se (coef) | z | Pr (>|z|) | ||||||||||||||||||||||||||||||||||||||||||||||||||||||||||||||||||||||||||||||||||||||||||||||
| AL022316.1 | -0.23105 | 0.7937 | 0.059712 | -3.86943 | 0.000109** | ||||||||||||||||||||||||||||||||||||||||||||||||||||||||||||||||||||||||||||||||||||||||||||||
| AC037198.1 | 0.143174 | 1.15393 | 0.055549 | 2.577431 | 0.009954* | ||||||||||||||||||||||||||||||||||||||||||||||||||||||||||||||||||||||||||||||||||||||||||||||
| AP000695.1 | 0.197343 | 1.218162 | 0.07356 | 2.682756 | 0.007302* | ||||||||||||||||||||||||||||||||||||||||||||||||||||||||||||||||||||||||||||||||||||||||||||||
| TRHDE-AS1 | 0.064235 | 1.066343 | 0.035917 | 1.788421 | 0.073708 | ||||||||||||||||||||||||||||||||||||||||||||||||||||||||||||||||||||||||||||||||||||||||||||||
| LINC00919 | 0.453674 | 1.574085 | 0.098805 | 4.591625 | 4.40E-06*** | ||||||||||||||||||||||||||||||||||||||||||||||||||||||||||||||||||||||||||||||||||||||||||||||
| Coef, coefficient; *: P<0.01; **: P<0.001; ***: P<0.0001. | |||||||||||||||||||||||||||||||||||||||||||||||||||||||||||||||||||||||||||||||||||||||||||||||||||
A forest plot showed the hazard ratio of five lncRNAs. The P value of this model was 6.8811E-11 and the C-index was 0.67 (Figure 1).
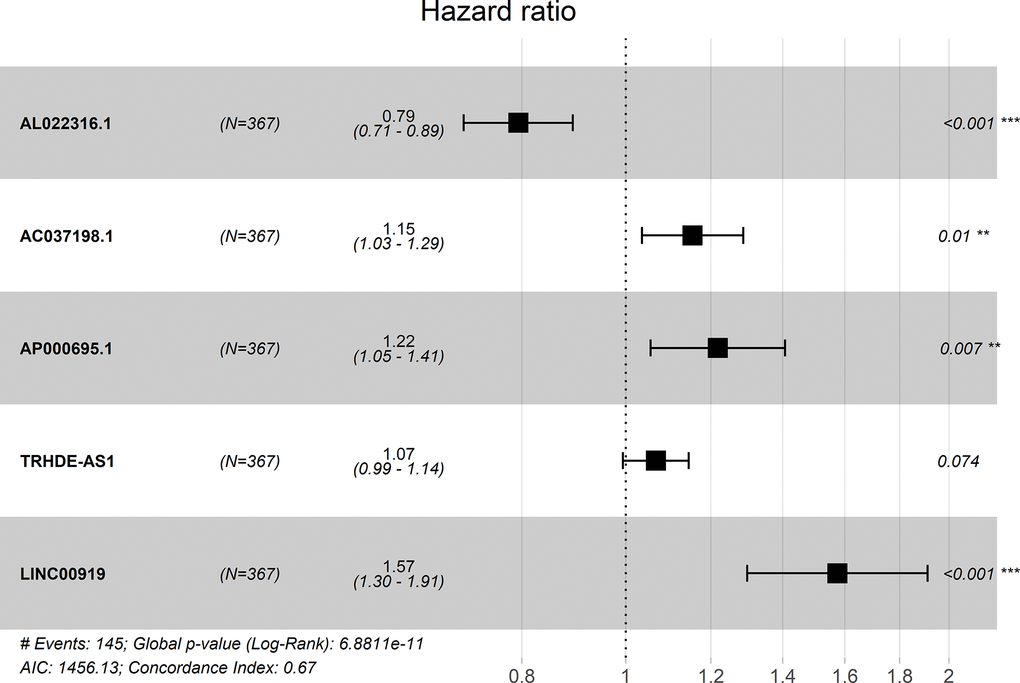
Figure 1. Forest plot for the association between five-lncRNA and risk value.
Evaluation on the prognostic model
The risk score of each patient can be calculated based on the expression level of 5-lncRNA and the coefficient value. The risk score formula is: (-0.23105×expression level of AL022316.1) + (0.143174×expression level of AC037198.1) + (0.197343×expression level of AP000695.1) + (0.064235×expression level of TRHDE-AS1) + (0.453674×expression level of LINC00919). All 375 patients were divided into high- and low-risk group according to the median risk score of 1.027. K-M curve suggested that the OS in the high-risk group was significantly lower than that in the low-risk group (P <0.001). The 5-year survival rate was 0.1 ± 0.058 (95% CI: 0.033-0.309) in high-risk group, and 0.575 ± 0.061 (95% CI: 0.467-0.708) in low-risk group (Figure 2A).
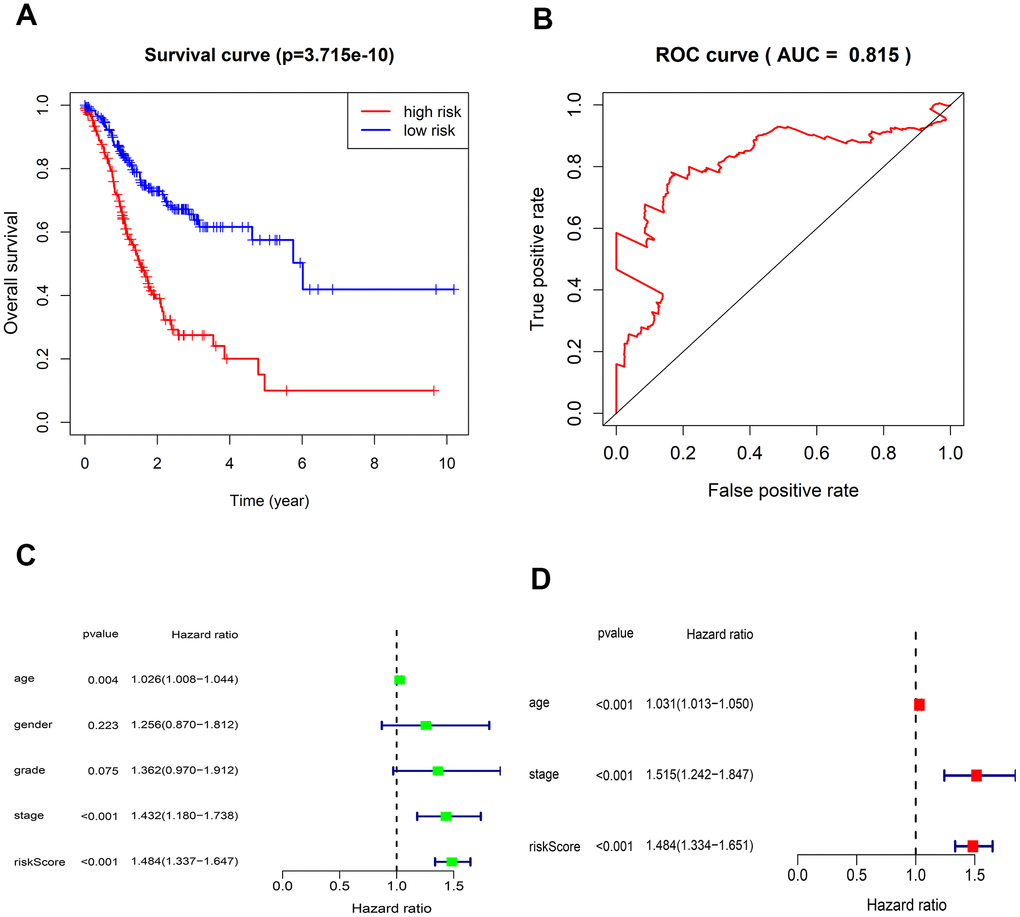
Figure 2. Kaplan-Meier survival and ROC curves for the five-lncRNA in TCGA. (A) The different OS between the high- and low-risk groups were determined by the log-rank test (p = 3.715e-10). (B) ROC curve for predicting 5-year survival with an AUC of 0.815. (C) Univariate Cox analysis evaluated the independent prognostic value of traditional clinical features and risk scores for OS in GC from TCGA. (D) Multivariate Cox analysis evaluates the independent prognostic value of traditional clinical features and risk scores for OS in GC.
The AUC value of the 5-lncRNA prognosis model is 0.815, implying high accuracy and specificity (Figure 2B). The C-index value is 0.6664 (95% CI: 61.9-71.3%, P <3.563102E-12), which further proves the accuracy of the model. Univariate analysis showed that the risk score was significantly related to OS. Other variables like age and Stage were also associated with OS (Figure 2C). Multivariate analysis showed that the 5-lncRNA model was an independent prognostic factor in GC (Figure 2D).
Risks scores were sorted in order (Figure 3A), and we found that survival time of patients decreased and mortality rate increased as the risk value increased (Figure 3B). Moreover, expressions of the 4 lncRNAs (AC037198.1; AP000695.1; TRHDE-AS1; LINC00919) were negative to the risk score. While the expression of lncRNA (AL022316.1) was positive to the risk score.
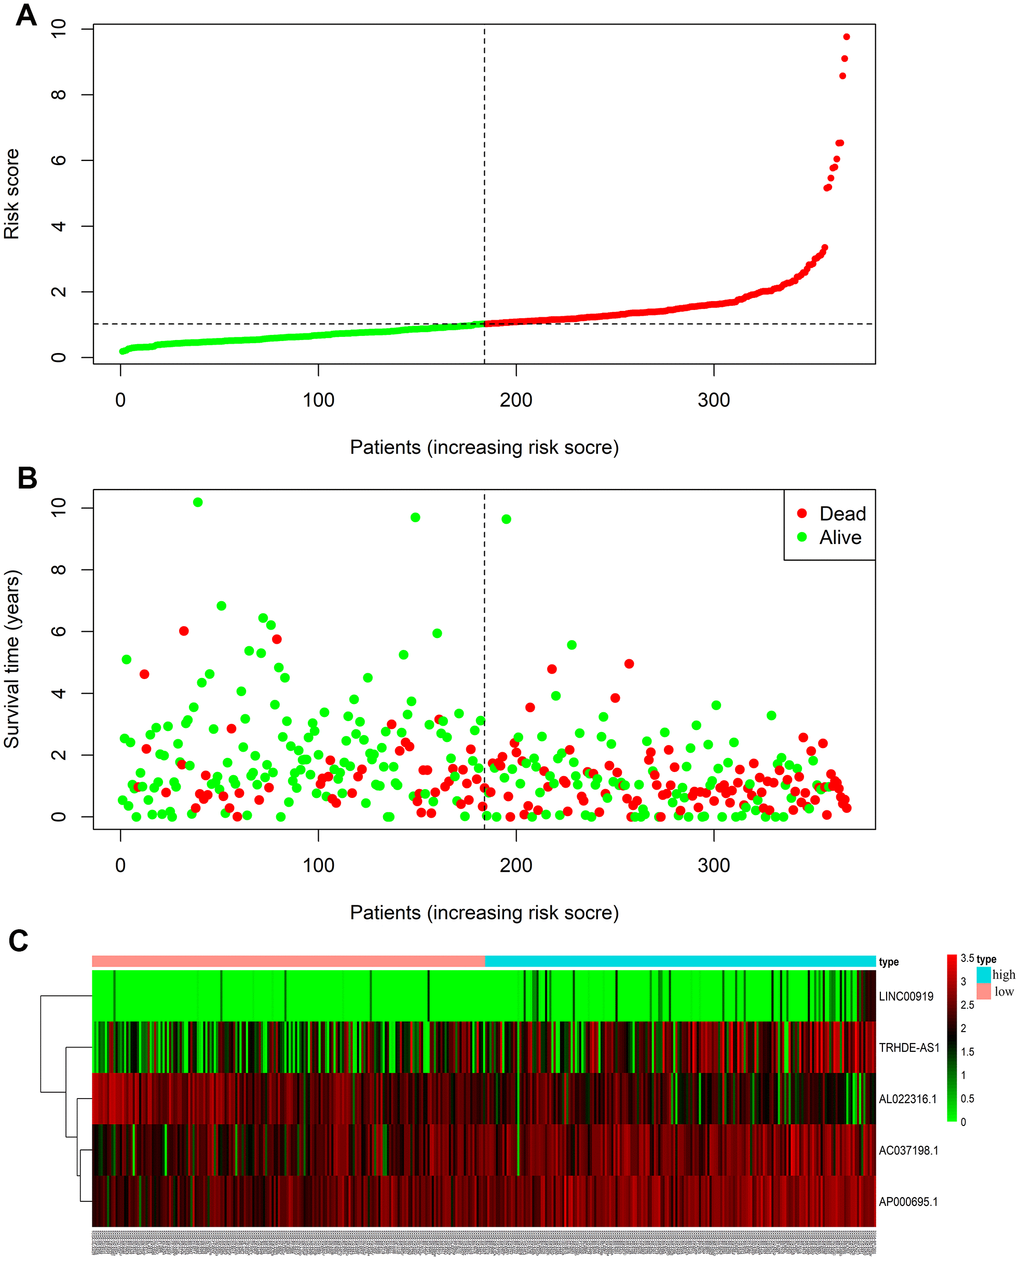
Figure 3. LncRNA predictive risk-score analysis of GC patients in TCGA database (The black dotted line represents the median signature cut-off dividing patients into low- and high-risk groups). (A) LncRNA risk score distribution in low- and high-risk groups (The green dots represent the low-risk patients, and red means the high-risk group). (B) The survival status and time of GC patients in low- and high-risk groups (The green dots represent alive, and red means dead). (C) Heatmap of the five-lncRNA expression profiles in GC patients.
Biological function analyses of lncRNA
We performed Gene Ontology (GO) and Kyoto Encyclopedia of Genes and Genomes (KEGG) analyses on 1197 co-expression proteins of 5-lncRNA. GO illustrated that the 5-lncRNA prognosis model had 55 GO terms, and the first 15 were shown in Figure 4A, mainly containing extracellular matrix structural constituent and biomolecules binding. The 5 lncRNAs act on 36 major pathways, the most 15 pathways were shown in Figure 4B, mainly including PI3K-AKT signaling pathway (Figure 4C), Focal adhesion (Figure 4D), MAPK signaling pathway (Figure 4E). These 5 lncRNAs affect the progress of GC through the high expression of related signaling pathway proteins.
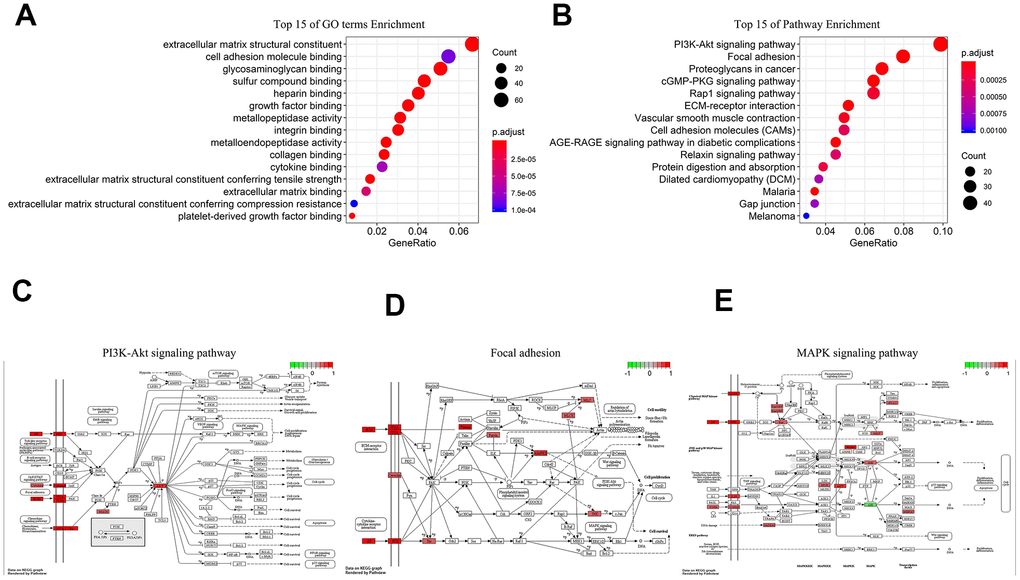
Figure 4. Biological analysis of 5-lncRNA (Green represents low expression, Red means high expression). (A) Top 15 enrichment terms in GO. (B) Top 15 pathways in KEGG. (C) PI3K-AKT signaling pathway. (D) Focal adhesion. (E) MAPK signaling pathway.
Immune microenvironment with different risk values
CIBERSORT method and LM22 gene matrix were combined to analyze immune microenvironment.
And the result of 22 immune cells in GC from the TCGA were exhibited in Figure 5A. Specific immune cells in high-risk patients are activated, such as T cells CD4 memory resting, Monocytes, Macrophages, Dendritic cells resting and Eosinophils (Figure 5B, 5D–5G). Only T cell follicular helper immune cells were highly expressed in the low-risk group (Figure 5C).
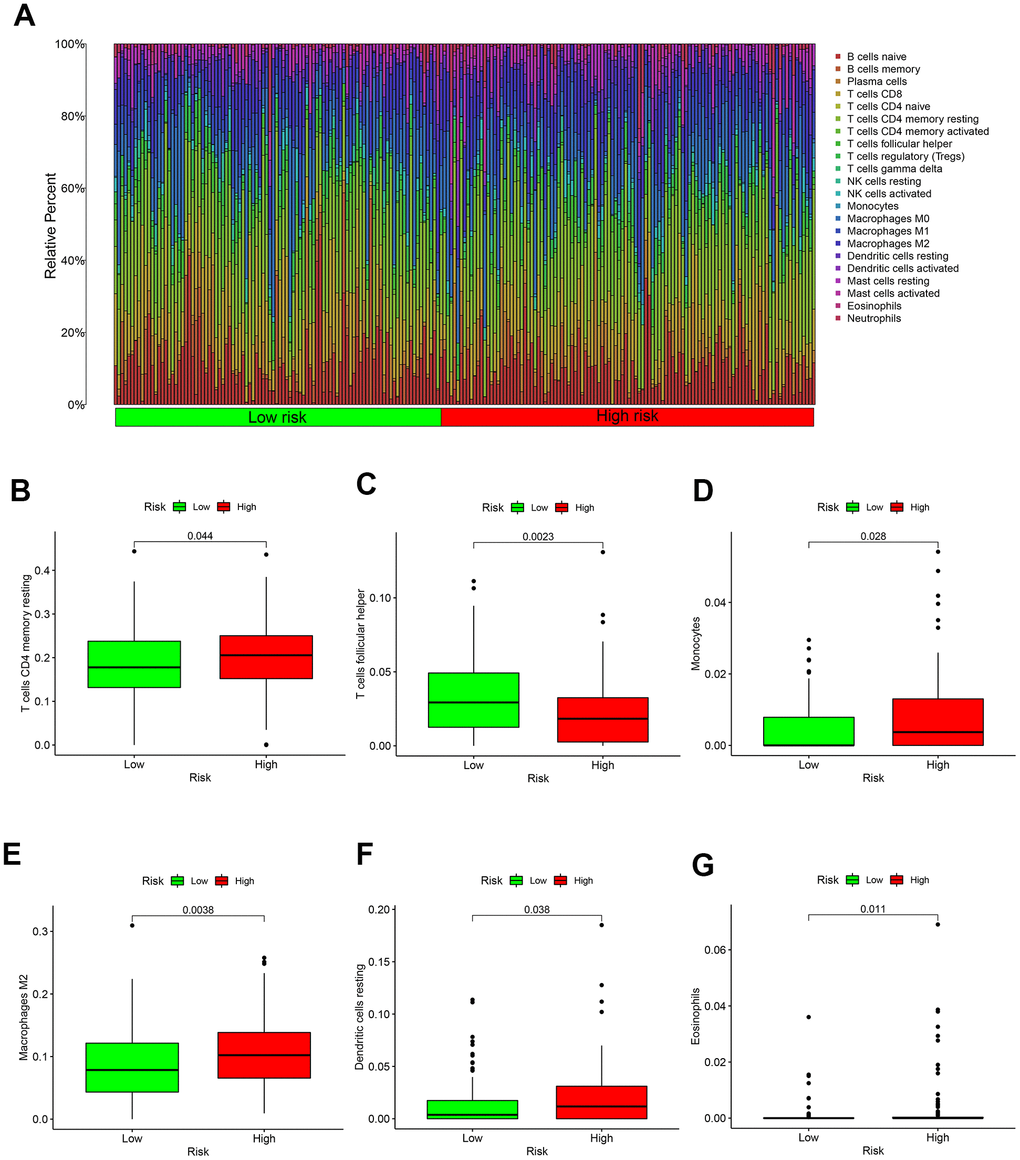
Figure 5. Immune microenvironment in different risk groups. (A) The relative proportion of 22 kinds of immune cell infiltration in high- and low-risk groups. (B) Box plot showing the expression of T cells CD4 memory resting in low- and high-risk groups. (C) Box plot showing the expression of T cells follicular helper in low- and high-risk groups. (D) Box plot showing the expression of Monocytes in low- and high-risk groups. (E) Box plot showing the expression of Macrophages in low- and high-risk groups. (F) Box plot showing the expression of Dendritic cells resting in low- and high-risk groups. (G) Box plot showing the expression of Eosinophils in low- and high-risk groups.
Discussion
LncRNA plays an important role in the occurrence and progression of GC [16, 17]. Multiple lncRNA prognostic models can evaluate the OS [15]. In this study, we screened out 11 lncRNAs most relevant to the OS in GC, and finally a brand-new prognostic model made up of 5-lncRNA was established after multivariate cox analysis. This prognostic model can evaluate the OS of GC patients precisely, with an AUC value of 0.815.
Many cancer studies currently use the TCGA database, and the exploration of cancer-related biomarkers is often based on the comparison between NAT and cancer samples [18]. Cai et al. set up a 9-lncRNA prognosis model (ADAMTS9-AS1, LINC01614, OVAAL, LINC02408, FLJ42969, LINC01446, CYMP-AS1, LINC01210, LINC01775) on the basis of TCGA database [19]. Cheng et al. promoted a 3-lncRNA prognostic model (CYP4A22-AS1, RP11-108M12.3AP000695.6) in GC [20]. Although their K-M analysis has good results, the AUC values are not ideal enough (AUC <0.8). In addition, both the two studies used NAT as a normal control group.
Aral et al. proposed that NAT was different from healthy tissues and tumor tissues [21]. And a recent research pointed out that NAT and tumor tissue have the same clonal origin, and many oncogenes are simultaneously expressed [22]. Furthermore, Nakashima et al. demonstrated that the molecular level of NAT tended to become cancerized [23]. Hence NAT can only be used as an intermediate state between healthy tissue and cancer tissue, which cannot be easily regarded as normal tissue [21]. A loss of many important lncRNAs will occur when using NAT as controls [7].
The GTEx database has sequencing of stomach tissues from healthy donors [10]. We are the first to use GTEx healthy samples as a control group to search for target genes, and finally obtained a brand new 5-lncRNA model. These 5 lncRNAs have not been reported in other articles. The prognosis model of 5-lncRNA has a higher AUC value than other models [19, 20]. We believe that in cancer research, healthy tissues are more suitable to serve as normal controls than NAT, and potential lncRNAs biomarkers related to the OS of GC patients can be obtained. In addition, the prognosis model of 5-lncRNA has a better accuracy than the original method (AUC value > 0.8).
With the emerging of deeper research, the role of some lncRNAs in GC has been revealed [24, 25]. However, functions of the vast majority of lncRNAs are still unclear. We performed GO and KEGG analysis on the five lncRNAs. GO analysis suggested that the main functions of this 5-lncRNA model were extracellular matrix structural constituent and biomolecules binding. KEGG showed that proteins co-expressed to the 5-lncRNA model was mainly enriched in PI3K-AKT signaling pathway, Focal adhesion, and MAPK signaling pathway. The top three signaling pathways happen to be important pathways in GC [26–29]. Therefore, we are more convinced that GTEx healthy samples can help us to discover potential lncRNAs to serve as novel biomarkers in GC.
Of course, there are some limitations about our study. First, healthy tissues and GC tissues were from different databases, and specimen collection and sequencing methods might be different. Although we used the original RNA-seq expression data and corrected them at the gene level, we still cannot completely eliminate the differences. Second, we lack information about the ethnicity of donors in GTEx database, so it is not possible to further clarify whether there are deviations between various populations. Third, although we have made multi-factor adjusted analysis on this model, age is a suspected confounding factor, which needs large scale of later researches to define exactly.
In conclusion, our study held the point that there was a significant difference between NAT and healthy tissue. And we proposed that healthy tissues were more suitable to be controls to obtain more potential biomarkers. The 5-lncRNA prognostic model can predict the survival risk of GC patients, but the detailed molecular mechanism might need to be evaluated by further research in the future. In the near future, we hope more biological experiments to be carried out to verify our results.
Materials and Methods
Datasets collections
RNA-seq expression and clinical information of healthy gastric tissue were downloaded from GTEx database (https://gtexportal.org/). RNA-seq expression and clinical data of GC were downloaded from TCGA database (https://cancergenome.nih.gov/). All the above records are publicly open all over the world. There’s no need for admission from the Ethics Committee.
The selection of differential lncRNAs
The "limma" package was used to correct the gene expression levels in healthy and GC tissues separately in R software. The "edgeR" package was used to compare the lncRNA expression levels between healthy and GC tissues, and differential lncRNAs were screened out with |log2(fold change)| ≥2 and P <0.05 as a criterion.
Construction of GC-lncRNA risk score
According to the OS of 375 GC patients in the TCGA database, univariate cox analysis was performed on each differential gene. And differential genes most relevant to OS were selected according to P value (P <0.001). Then multivariate cox analysis on the selected differential genes was carried out to get the prognostic lncRNAs considering the AIC value. The coefficient values of these selected differential genes were also obtained. Afterwards, a prognosis model predicting OS in GC patients was established. The risk scoring formula of the model is:
Evaluation of the prognostic model
The risk value of each patient was calculated according to the scoring formula of the model. And patients were divided into high- and low-risk groups with the median risk value. Survival curves of the high- and low-risk groups were made by K-M method. Meanwhile the ROC curve of the prognostic model was drawn, and its AUC value was calculated. The consistency test on AUC value was performed using R package "survcomp." Univariate and multivariate cox regression analyses were to determine whether the prognostic model is an independent factor or not. Finally, the risk curve of the prognostic model was obtained based on the risk score ranking.
Analysis on biological function of the prognostic lncRNAs
In order to predict the biological effects of related lncRNAs, we performed GO (Gene Ontology) and KEGG (Kyoto Encyclopedia of Genes and Genomes) analyses of the target 5 lncRNAs. We calculated the expression levels of all protein-coding genes (PCGs) corresponding to 5 lncRNAs through the R package "clusterProfiler." mRNAs with |Pearson correlation coefficient|> 0.40 and P <0.01 were considered to have co-expression.
Immune microenvironment analysis
In order to evaluate the relative abundance of tumor-infiltrating immune cells in different risk groups, we used the CIBERSORT algorithm. This is a new calculation method developed by Newman et al., which uses a set of reference gene expression values (547 genes) to quantify the abundance of 22 immune cells [30]. Here we used CIBERSORT to evaluate the proportion of 22 immune cells in all GC patients from TCGA. And immune cell situation both in high- and low-risk groups were investigated.
Author Contributions
C.C. and L.Y. carried out the study design, analysis and interpretation of data, and drafted the manuscript together. X.Z. and Y.H. participated in the study and the acquisition of data. K.Z. conceived the study, participating in its design and coordination, and helped in drafting the manuscript. All authors have read and approved the final manuscript.
Conflicts of Interest
The authors declare that they have no conflicts of interest.
References
- 1. Bray F, Ferlay J, Soerjomataram I, Siegel RL, Torre LA, Jemal A. Global cancer statistics 2018: GLOBOCAN estimates of incidence and mortality worldwide for 36 cancers in 185 countries. CA Cancer J Clin. 2018; 68:394–424. https://doi.org/10.3322/caac.21492 [PubMed]
- 2. Russi S, Calice G, Ruggieri V, Laurino S, La Rocca F, Amendola E, Lapadula C, Compare D, Nardone G, Musto P, De Felice M, Falco G, Zoppoli P. Gastric Normal Adjacent Mucosa Versus Healthy and Cancer Tissues: Distinctive Transcriptomic Profiles and Biological Features. Cancers (Basel). 2019; 11:1248. https://doi.org/10.3390/cancers11091248 [PubMed]
- 3. Curtius K, Wright NA, Graham TA. An evolutionary perspective on field cancerization. Nat Rev Cancer. 2018; 18:19–32. https://doi.org/10.1038/nrc.2017.102 [PubMed]
- 4. Heaphy CM, Griffith JK, Bisoffi M. Mammary field cancerization: molecular evidence and clinical importance. Breast Cancer Res Treat. 2009; 118:229–39. https://doi.org/10.1007/s10549-009-0504-0 [PubMed]
- 5. Heaphy CM, Bisoffi M, Fordyce CA, Haaland CM, Hines WC, Joste NE, Griffith JK. Telomere DNA content and allelic imbalance demonstrate field cancerization in histologically normal tissue adjacent to breast tumors. Int J Cancer. 2006; 119:108–16. https://doi.org/10.1002/ijc.21815 [PubMed]
- 6. Meurette O, Mehlen P. Notch Signaling in the Tumor Microenvironment. Cancer Cell. 2018; 34:536–48. https://doi.org/10.1016/j.ccell.2018.07.009 [PubMed]
- 7. de Assumpção PP, Khayat AS, Thomaz Araújo TM, Barra WF, Ishak G, Cruz Ramos AM, Dos Santos SE, Dos Santos ÂK, Demachki S, de Assumpção PB, Calcagno DQ, Dos Santos NP, de Assumpção MB, et al. Traps and trumps from adjacent-to-tumor samples in gastric cancer research. Chin J Cancer Res. 2018; 30:564–67. https://doi.org/10.21147/j.issn.1000-9604.2018.05.10 [PubMed]
- 8. Battle A, Brown CD, Engelhardt BE, Montgomery SB, and GTEx Consortium, Laboratory, Data Analysis & Coordinating Center (LDACC)—Analysis Working Group, and Statistical Methods groups—Analysis Working Group, and Enhancing GTEx (eGTEx) groups, and NIH Common Fund,and NIH/NCI, and NIH/NHGRI, and NIH/NIMH,and NIH/NIDA, and Biospecimen Collection Source Site—NDRI, and Biospecimen Collection Source Site—RPCI, Biospecimen Core Resource—VARI, and Brain Bank Repository—University of Miami Brain Endowment Bank, and Leidos Biomedical—Project Management, and ELSI Study, and Genome Browser Data Integration & Visualization—EBI, and Genome Browser Data Integration & Visualization— and UCSC Genomics Institute, University of California Santa Cruz. Lead analysts: Laboratory, Data Analysis & Coordinating Center (LDACC), and NIH program management, and Biospecimen collection, and Pathology, and eQTL manuscript working group. Genetic effects on gene expression across human tissues. Nature. 2017; 550:204–13. https://doi.org/10.1038/nature24277 [PubMed]
- 9. eGTEx Project. Enhancing GTEx by bridging the gaps between genotype, gene expression, and disease. Nat Genet. 2017; 49:1664–70. https://doi.org/10.1038/ng.3969 [PubMed]
- 10. GTEx Consortium. Human genomics. The Genotype-Tissue Expression (GTEx) pilot analysis: multitissue gene regulation in humans. Science. 2015; 348:648–60. https://doi.org/10.1126/science.1262110 [PubMed]
- 11. Zhang G, Li S, Lu J, Ge Y, Wang Q, Ma G, Zhao Q, Wu D, Gong W, Du M, Chu H, Wang M, Zhang A, Zhang Z. LncRNA MT1JP functions as a ceRNA in regulating FBXW7 through competitively binding to miR-92a-3p in gastric cancer. Mol Cancer. 2018; 17:87. https://doi.org/10.1186/s12943-018-0829-6 [PubMed]
- 12. Zhao Y, Liu Y, Lin L, Huang Q, He W, Zhang S, Dong S, Wen Z, Rao J, Liao W, Shi M. The lncRNA MACC1-AS1 promotes gastric cancer cell metabolic plasticity via AMPK/Lin28 mediated mRNA stability of MACC1. Mol Cancer. 2018; 17:69. https://doi.org/10.1186/s12943-018-0820-2 [PubMed]
- 13. Shuai Y, Ma Z, Liu W, Yu T, Yan C, Jiang H, Tian S, Xu T, Shu Y. TEAD4 modulated LncRNA MNX1-AS1 contributes to gastric cancer progression partly through suppressing BTG2 and activating BCL2. Mol Cancer. 2020; 19:6. https://doi.org/10.1186/s12943-019-1104-1 [PubMed]
- 14. Wang CJ, Zhu CC, Xu J, Wang M, Zhao WY, Liu Q, Zhao G, Zhang ZZ. The lncRNA UCA1 promotes proliferation, migration, immune escape and inhibits apoptosis in gastric cancer by sponging anti-tumor miRNAs. Mol Cancer. 2019; 18:115. https://doi.org/10.1186/s12943-019-1032-0 [PubMed]
- 15. Wu B, Wang K, Fei J, Bao Y, Wang X, Song Z, Chen F, Gao J, Zhong Z. Novel three-lncRNA signature predicts survival in patients with pancreatic cancer. Oncol Rep. 2018; 40:3427–37. https://doi.org/10.3892/or.2018.6761 [PubMed]
- 16. Chen JF, Wu P, Xia R, Yang J, Huo XY, Gu DY, Tang CJ, De W, Yang F. STAT3-induced lncRNA HAGLROS overexpression contributes to the malignant progression of gastric cancer cells via mTOR signal-mediated inhibition of autophagy. Mol Cancer. 2018; 17:6. https://doi.org/10.1186/s12943-017-0756-y [PubMed]
- 17. Zhang Y, Zhang Q, Zhang M, Yuan M, Wang Z, Zhang J, Zhou X, Zhang Y, Lin F, Na H, Ren S, Zuo Y. DC - SIGNR by influencing the lncRNA HNRNPKP2 upregulates the expression of CXCR4 in gastric cancer liver metastasis. Mol Cancer. 2017; 16:78. https://doi.org/10.1186/s12943-017-0639-2 [PubMed]
- 18. Erstad DJ, Fuchs BC, Tanabe KK. Molecular signatures in hepatocellular carcinoma: A step toward rationally designed cancer therapy. Cancer. 2018; 124:3084–104. https://doi.org/10.1002/cncr.31257 [PubMed]
- 19. Cai C, Yang L, Tang Y, Wang H, He Y, Jiang H, Zhou K. Prediction of Overall Survival in Gastric Cancer Using a Nine-lncRNA. DNA Cell Biol. 2019; 38:1005–12. https://doi.org/10.1089/dna.2019.4832 [PubMed]
- 20. Cheng P. A prognostic 3-long noncoding RNA signature for patients with gastric cancer. J Cell Biochem. 2018; 119:9261–69. https://doi.org/10.1002/jcb.27195 [PubMed]
- 21. Aran D, Camarda R, Odegaard J, Paik H, Oskotsky B, Krings G, Goga A, Sirota M, Butte AJ. Comprehensive analysis of normal adjacent to tumor transcriptomes. Nat Commun. 2017; 8:1077. https://doi.org/10.1038/s41467-017-01027-z [PubMed]
- 22. Jakubek YA, Chang K, Sivakumar S, Yu Y, Giordano MR, Fowler J, Huff CD, Kadara H, Vilar E, Scheet P. Large-scale analysis of acquired chromosomal alterations in non-tumor samples from patients with cancer. Nat Biotechnol. 2020; 38:90–96. https://doi.org/10.1038/s41587-019-0297-6 [PubMed]
- 23. Nakashima T, Tomita H, Hirata A, Ishida K, Hisamatsu K, Hatano Y, Kanayama T, Niwa A, Noguchi K, Kato K, Miyazaki T, Tanaka T, Shibata T, Hara A. Promotion of cell proliferation by the proto-oncogene DEK enhances oral squamous cell carcinogenesis through field cancerization. Cancer Med. 2017; 6:2424–39. https://doi.org/10.1002/cam4.1157 [PubMed]
- 24. Feng L, Li H, Li F, Bei S, Zhang X. LncRNA KCNQ1OT1 regulates microRNA-9-LMX1A expression and inhibits gastric cancer cell progression. Aging (Albany NY). 2020; 12:707–17. https://doi.org/10.18632/aging.102651 [PubMed]
- 25. Li D, Wang J, Zhang M, Hu X, She J, Qiu X, Zhang X, Xu L, Liu Y, Qin S. LncRNA MAGI2-AS3 Is Regulated by BRD4 and Promotes Gastric Cancer Progression via Maintaining ZEB1 Overexpression by Sponging miR-141/200a. Mol Ther Nucleic Acids. 2020; 19:109–23. https://doi.org/10.1016/j.omtn.2019.11.003 [PubMed]
- 26. Huang Y, Zhang J, Hou L, Wang G, Liu H, Zhang R, Chen X, Zhu J. LncRNA AK023391 promotes tumorigenesis and invasion of gastric cancer through activation of the PI3K/Akt signaling pathway. J Exp Clin Cancer Res. 2017; 36:194. https://doi.org/10.1186/s13046-017-0666-2 [PubMed]
- 27. Liu J, Pan C, Guo L, Wu M, Guo J, Peng S, Wu Q, Zuo Q. A new mechanism of trastuzumab resistance in gastric cancer: MACC1 promotes the Warburg effect via activation of the PI3K/AKT signaling pathway. J Hematol Oncol. 2016; 9:76. https://doi.org/10.1186/s13045-016-0302-1 [PubMed]
- 28. Shen Z, Ye Y, Kauttu T, Seppänen H, Vainionpää S, Wang S, Mustonen H, Puolakkainen P. Novel focal adhesion protein kindlin-2 promotes the invasion of gastric cancer cells through phosphorylation of integrin β1 and β3. J Surg Oncol. 2013; 108:106–12. https://doi.org/10.1002/jso.23353 [PubMed]
- 29. Ma W, Xu Z, Wang Y, Li W, Wei Z, Chen T, Mou T, Cheng M, Luo J, Luo T, Chen Y, Yu J, Zhou W, Li G. A Positive Feedback Loop of SLP2 Activates MAPK Signaling Pathway to Promote Gastric Cancer Progression. Theranostics. 2018; 8:5744–57. https://doi.org/10.7150/thno.28898 [PubMed]
- 30. Newman AM, Steen CB, Liu CL, Gentles AJ, Chaudhuri AA, Scherer F, Khodadoust MS, Esfahani MS, Luca BA, Steiner D, Diehn M, Alizadeh AA. Determining cell type abundance and expression from bulk tissues with digital cytometry. Nat Biotechnol. 2019; 37:773–82. https://doi.org/10.1038/s41587-019-0114-2 [PubMed]