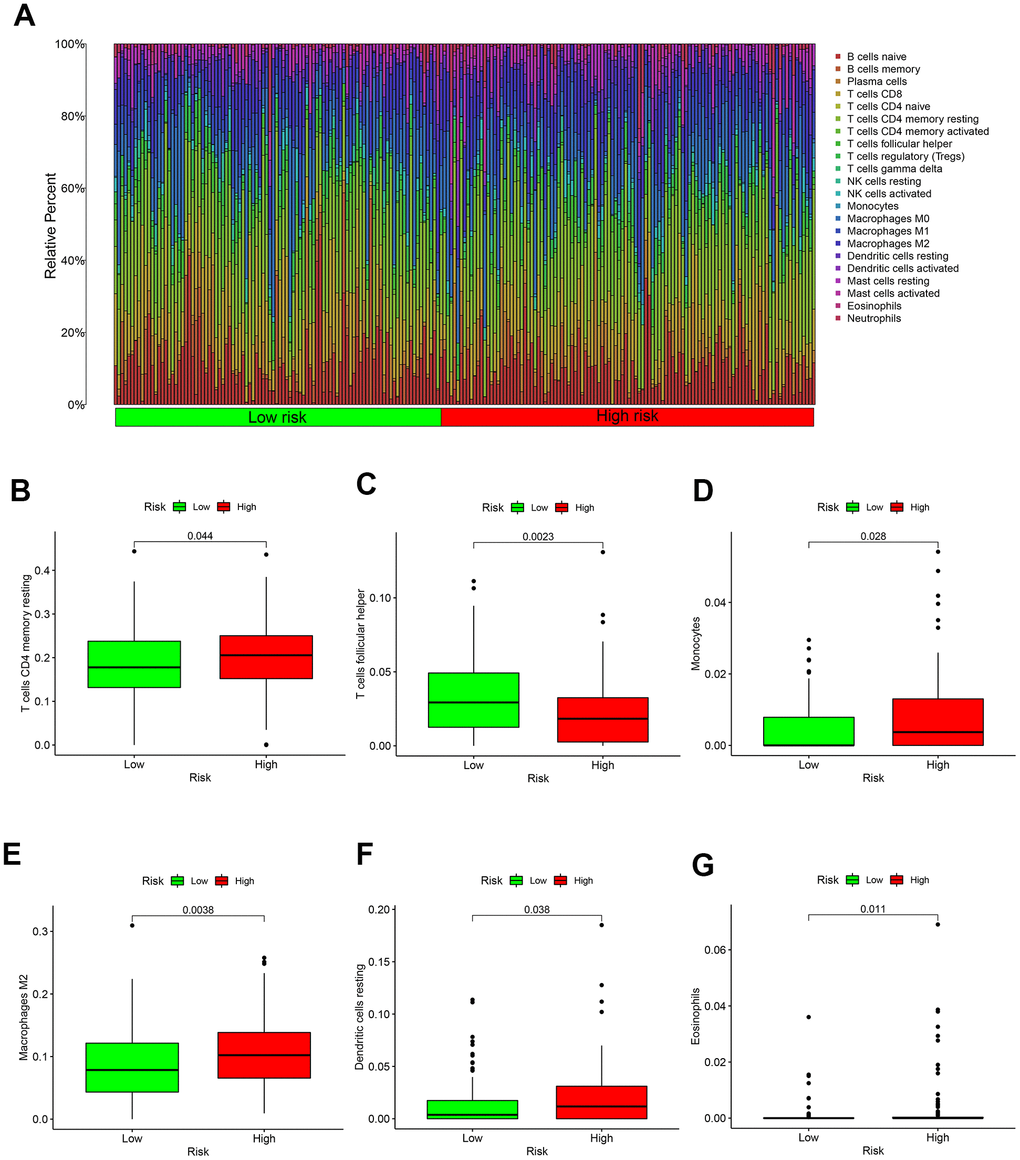
Figure 5.Immune microenvironment in different risk groups. (A) The relative proportion of 22 kinds of immune cell infiltration in high- and low-risk groups. (B) Box plot showing the expression of T cells CD4 memory resting in low- and high-risk groups. (C) Box plot showing the expression of T cells follicular helper in low- and high-risk groups. (D) Box plot showing the expression of Monocytes in low- and high-risk groups. (E) Box plot showing the expression of Macrophages in low- and high-risk groups. (F) Box plot showing the expression of Dendritic cells resting in low- and high-risk groups. (G) Box plot showing the expression of Eosinophils in low- and high-risk groups.