Submit an Article
Navigate
Home
Editorial Board
Editorial Policies
Current Volume
Archive
Scientific Integrity
Publication Ethics Statements
Interviews with Outstanding Authors
Newsroom
Sponsored Conferences
Podcast
Contact
Special Collections
Submit an Article
Online ISSN: 1945-4589
Research Paper
|
Volume 13, Issue 21
|
pp. 24349–24359
A five-lncRNA model predicting overall survival in gastric cancer compared with normal tissues
Back to article
Figure 4
(4 of 5)
−
100%
+
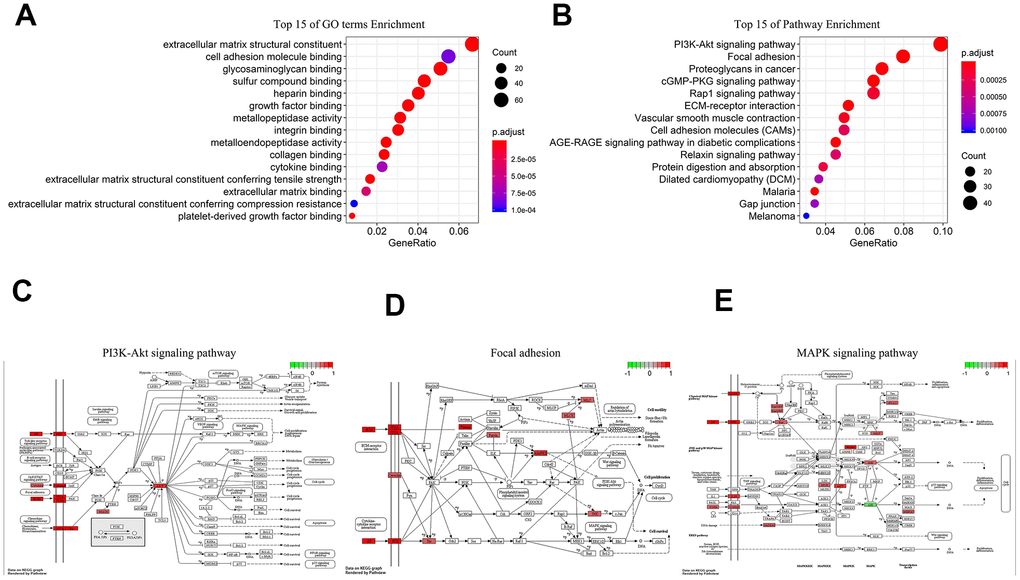
Figure 4.
Biological analysis of 5-lncRNA (Green represents low expression, Red means high expression).
(
A
) Top 15 enrichment terms in GO. (
B
) Top 15 pathways in KEGG. (
C
) PI3K-AKT signaling pathway. (
D
) Focal adhesion. (
E
) MAPK signaling pathway.