


Introduction
Ovarian cancer (OC) is a malignant tumor of the reproductive system with high morbidity and fatality rate in female individuals [1]. Due to the lack of specific symptoms and screening methods in the early stage, OC is usually diagnosed in the advanced stage. Meanwhile, the recurrence rate is as high as 70% due to drug resistance to chemotherapy, which is the main reason why ovarian cancer is difficult to cure [2]. Although surgery combined with conventional chemotherapy has made significant progress in OC therapy, the vast majority of advanced patients relapse within 5 years due to the widespread metastasis of OC [3, 4]. Although many biomarkers have been identified as important predictors of OC, few can be used as independent predictors. Therefore, the development of early biomarkers of ovarian cancer would provide help for OC early diagnosis and therapy.
Long non-coding RNA (LncRNA) belongs to a non-coding RNA with a length of more than 200bp, which plays an important role in many diseases, especially in tumors [5, 6]. In recent years, the abnormal expression of LncRNA in malignant tumors has attracted wide attention [7]. At present, it is believed that LncRNA is associated with the occurrence and development of tumors, and it participates in the biological behaviors of many kinds of malignant tumors, such as gene transcription, cell proliferation, cell differentiation, cell cycle regulation, apoptosis, metabolism, drug resistance [7]. Chen et al. revealed that PVT1 is significantly upregulated in OC. Through online prediction that PVT1 has a miR-214 binding site, PVT1 promotes OC cell proliferation, migration, invasion and inhibits OC cell apoptosis by binding miR-214 [8]. Tao et al. found that MALAT1 was upregulated in OC, and the proliferation ability of ovarian cancer cells decreased after knockout of MALAT1. It was predicted online that miR-211 could bind directly, and then it was confirmed that miR-211 could target PHD finger protein 19 (PHF 19), Ghislin, one of the members of multicomb inhibition complex 2. It was suggested that silencing PHF19 could inhibit melanoma cell proliferation and improve the ability of melanoma cells to migrate across endothelium. In the study of Tao et al., PHF19 was upregulated after knockout of miR-211, and the ability of cancer cell proliferation and migration was enhanced. It is suggested that MALAT1/miR-211/PHF19 axis is involved in controlling cancer cell proliferation and progression in ovarian cancer [9]. Hu et al. found that MALAT1 regulates the expression of ubiquitin E3 ligase MARCH7 and autophagy-associated protein ATG7 by binding to miR-200a. MARCH7 and ATG7 are overexpressed in ovarian cancer. It is predicted online that the binding sites of MARCH7 and MALAT1 are the same with miR-200a [10].
Epithelial-mesenchymal transition (EMT) refers to the process of transforming epithelial cells into stromal cells and gaining the ability of invasion and migration. EMT performs crucial function in tumor development [11, 12]. The EMT process results in changes in cell morphology, loss of adhesion, and stem cell-like characteristics. Most of cells undergoing EMT process showed decreased epithelial genes level, such as E-cadherin, cytokeratin, ZO-1 and dense protein, and increased mesenchymal gene levels, including N-cadherin, vimentin, fibronectin and MUC1 [13]. LncRNAs regulated tumor progression via EMT progression. Ga Won Yim et al. studied the expression of HOXA11 as in ovarian cancer and its relationship with the occurrence and development of OC, and found that HOXA11as could promote MMP-2, MMP-9 and vascular endothelialgrowth factor (VEGF) can promote the EMT process of ovarian cancer [14]. Yanhui Lou et al. found that the high expression of LINC-ROR in OC can promote the EMT process of ovarian cancer [15].
As an oncogenic lncRNA, MAFG-AS1 promotes tumor growth in different cancer. While its role in OC is still unknown. Here, we investigate the function of MAFG-AS1 in OC. We conducted the effect of MAFG-AS1 on autophagy and EMT through miR-24-3p/ B4GAT1 pathway in OC.
Results
MAFG-AS1 is abnormal upregulation in OC tissues and cell lines
Firstly, we used bioinformatics to detect the lncRNA genes level in tumor tissues and adjacent tissues from OC patients (Figure 1A). MAFG-AS1 was significantly higher than other lncRNAs. Suggesting LncRNA MAFG-AS1 may involve in the progression of OC. Then we detected the expression level of MAFG-AS1 in 32 paired OC patients. The upregulated MAFG-AS1 was observed in prostate tissues of OC patients (Figure 1B). Meanwhile, we detected the MAFG-AS1 level in different OC cell lines (A2780, OVCAR3, SKOV3). Compared with IOSE80 cells, the expression of MAFG-AS1 was increased in A2780, OVCAR3, SKOV3 cell lines (Figure 1C). Further, we found that epithelial-mesenchymal transition (EMT)-related proteins (N-cadherin, MMP2, MMP7) were increased and E-cadherin was decreased in OC cell lines (Figure 1D). Meanwhile, RNA-seq analysis validated that the expression of MAFG-AS1 was elevated in ovarian cancer SKOV3 cell line compared with normal ovarian epithelial cell IOSE80 line (Figure 1E).
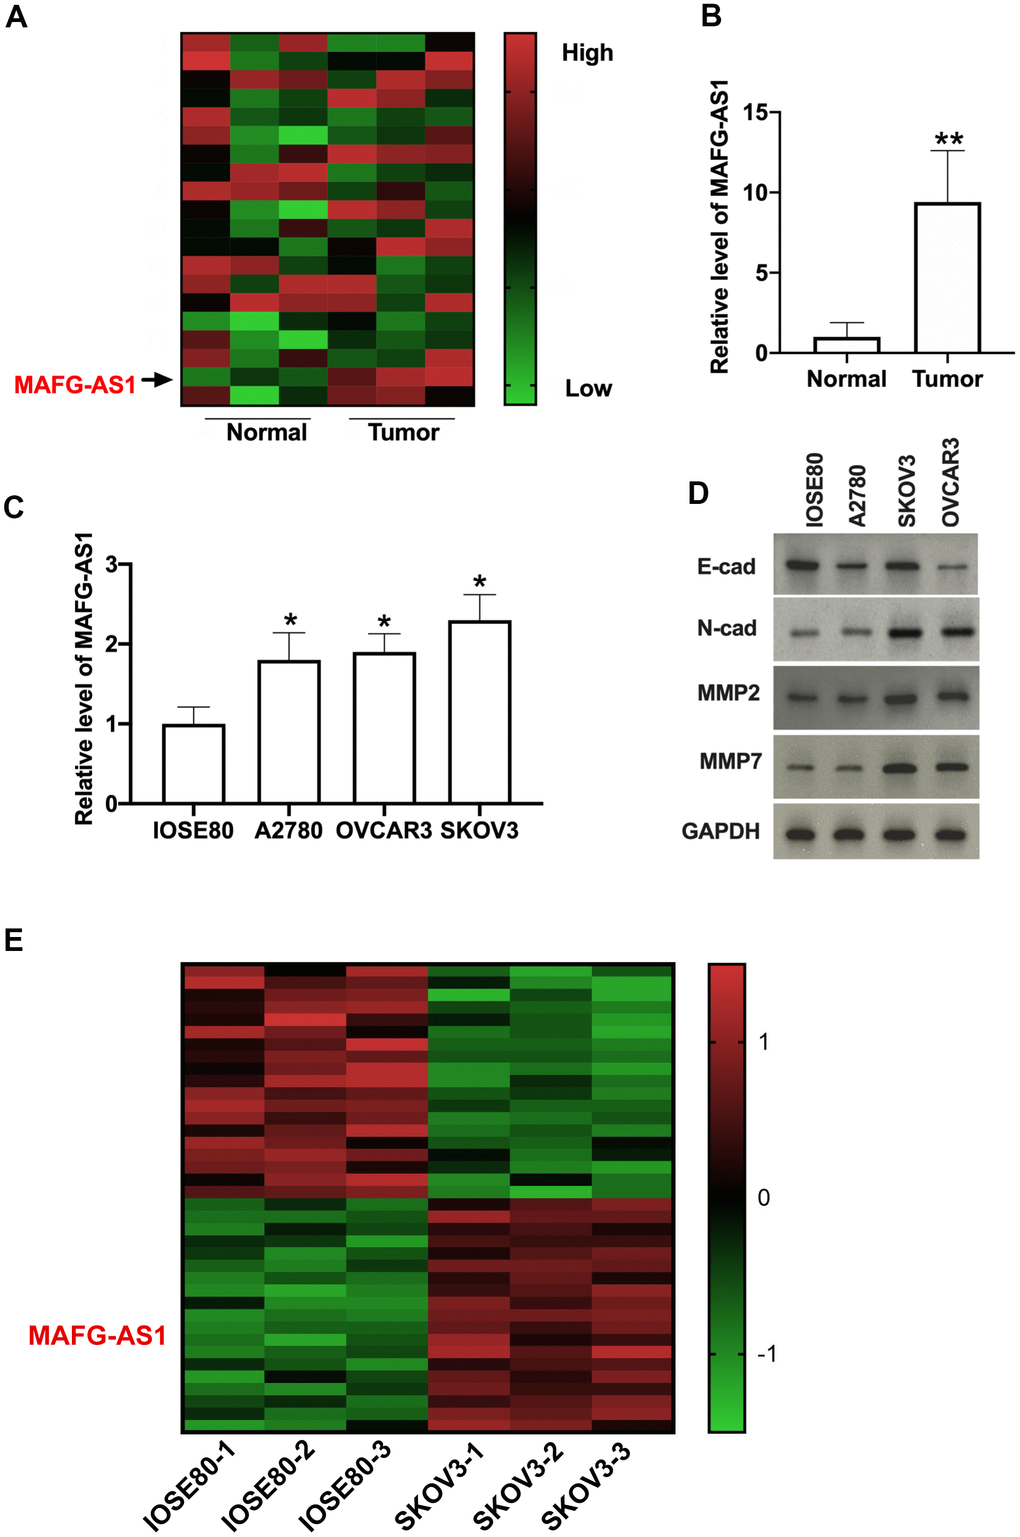
Figure 1. MAFG-AS1 is upregulated in OC tissues and cell lines. (A) Heat map of lncRNA chips. (B) Relative MAFG-AS1 expression was examined by qRT-PCR in OC tissues compared with the normal tissues. n = 32, **P<0.01. (C) MAFG-AS1 expression in OC cell lines was quantified by qRT-PCR. n = 4, *P<0.05. (D) The protein level of E-cadherin, N-cadherin, MMP2, MMP7 in OC cell lines. (E) Heatmap of differentially expressed lncRNAs in the RNA-seq analysis of OC cell lines.
Knockdown of MAFG-AS1 regulated the progression of OC
Next, we constructed the siRNA for silencing the expression of MAFG-AS1. QRT-PCR was performed to explore the level of MAFG-AS1 in SKOV3 cells (Figure 2A). CCK-8 assay was employed to detected cell viability. The knockdown of MAFG-AS1 inhibited cell viability in OC cell lines (Figure 2B). Further clone formation analysis showed that si-MAFG-AS1 prevented clone formation (Figure 2C). EdU assay results showed that si-MAFG-AS1 remitted cell proliferation in SKOV3 cells (Figure 2D) The treatment of si-MAFG-AS1 prevented sphere formation ability of OC cells (Figure 2E). The knockdown of MAFG-AS1 inhibited the migration and invasion capacity of OC cell lines, as shown with the Transwell chamber assay (Figure 2F). Determination of apoptotic protein level with Western blot. The results showed that si-MAFG-AS1 induced apoptosis in OC cells (Figure 2G). Silencing of MAFG-AS1 also remitted the EMT progression in SKOV3 cells (Figure 2H). Further, we found that si-MAFG-AS1 prevented autophagy-associated protein expression in OC cells (Figure 2I). Taken together, knockdown of MAFG-AS1 could block OC progression in vitro.
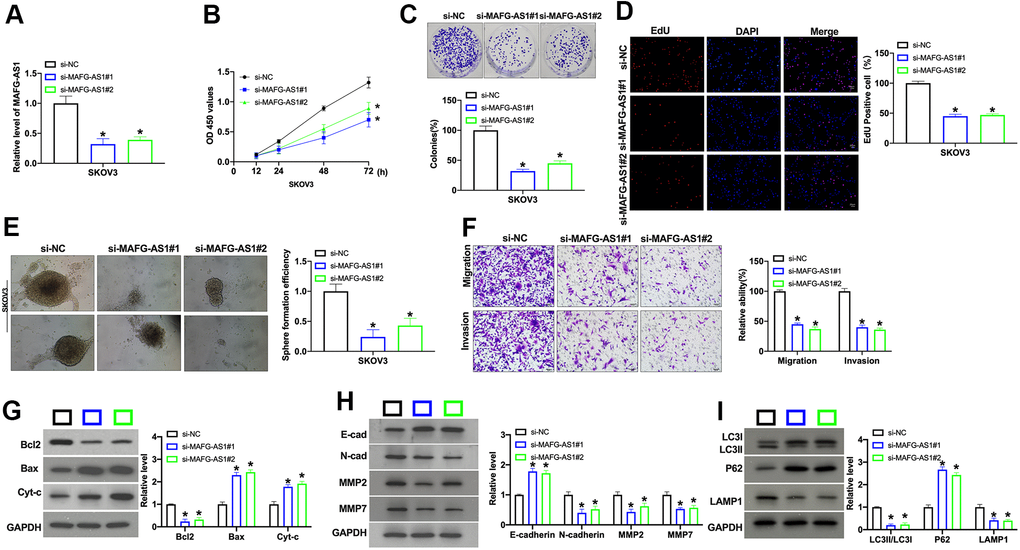
Figure 2. Silencing of MAFG-AS1 prevents cell development in OC cells. (A) The knockdown efficiency of siRNA was confirmed by qRT-PCR. n = 4, *P<0.05. (B) The cell viability of MAFG-AS1 on OC cells was detected by CCK-8 assay. n = 6, *P<0.05. (C) Clone formation assay was used to detect proliferation. n = 4, *P<0.05. (D) The proliferative ability of OC cells transfected with MAFG-AS1 siRNA was assessed by EdU staining assay. (E) Pictures of tumor spheres formed by OC cells and the quantity of sphere formation efficiency. Scale bar: 100 μm. (F) The migration and invasion of MAFG-AS1 knockdown OC cells were measured by Transwell assay. n = 4, *P<0.05. (G) The protein level of Bcl1, Bax, and Cytochrome c was detected by Western blot. n = 4, *P<0.05. (H) The protein level of E-cadherin, N-cadherin, MMP2, MMP7 was detected by Western blot. n = 4, *P<0.05. (I) The protein level of LC3, P62, LAMP1 was detected by Western blot. n = 4, *P<0.05.
MAFG-AS1 interacts with miR-24-3p in OC cells
Next, we found that MAFG-AS1 was located in cytoplasm (Figure 3A). MiR-24-3p, miR-143-3p, and miR-147b were predicted as a target of MAFG-AS1 by bioinformatics website (Figure 3B). Then we detected the level of miR-24-3p, miR-143-3p, and miR-147b in SKOV3 cells after si-MAFG-AS1 transfection. The results performed that the level of miR-24-3p, not miR-143-3p, and miR-147b was down-regulation after MAFG-AS1 overexpression (Figure 3C). We observed that miR-24-3p was significant down-regulation in OC cell lines (Figure 3D). Database revealed that there was a negative relationship between MAFG-AS1 and miR-24-3p (Figure 3E). Bioinformatics prediction of binding sites between MAFG-AS1 and miR-24-3p were shown in Figure 3F. Luciferase assay report performed that MAFG-AS1 could interact with miR-24-3p (Figure 3F). Next, we used anti-AGO2 RIP in cells. Endogenous MAFG-AS1 pull-down by AGO2 was enriched in cells after miR-24-3p transfection, indicating the interaction of MAFG-AS1 with miR-24-3p (Figure 3G). Biotin pull down assay also verified similar results (Figure 3H). Immunofluorescence in situ hybridization confirmed the double RNA co-localization of MAFG-AS1 and miR-24-3p to verify the interaction between MAFG-AS1 and miR-24-3p (Figure 3I).
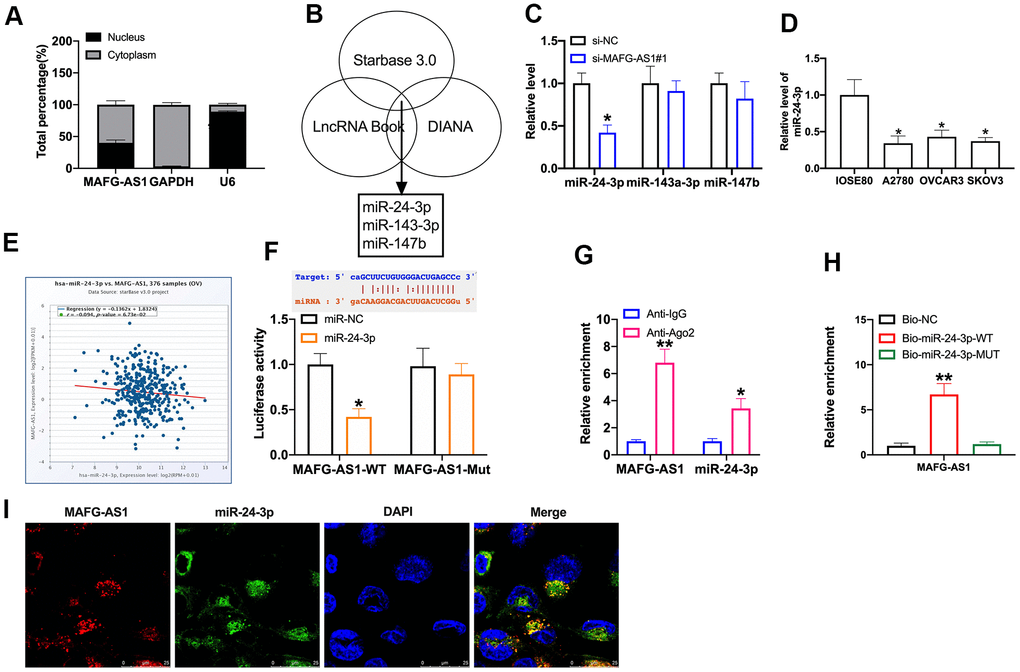
Figure 3. MiR-24-3p is downstream target of MAFG-AS1. (A) The level of MAFG-AS1 in cytoplasm and nucleus. (B) Bioinformatics website predicted the target of MAFG-AS1. (C) The level of miR-24-3p, miR-143-3p, and miR-147b in SKOV3 after siMAFG-AS1 transfection. n = 6, *P<0.05. (D) MiR-24-3p expression in OC cell lines was quantified by qRT-PCR. n = 4, *P<0.05. (E) The relationship between MAFG-AS1 and miR-24-3p. (F) Luciferase reporter assay was used to determine the luciferase activity in HEK-293T cells of indicated groups. n = 3, *P<0.05. (G) The enrichment of miR-24-3p and MAFG-AS1 in AGO2 and IgG detected by RIP assay. n = 3, *P<0.05. (H) Biotin-RNA pull-down assay. n = 3, *P<0.05. (I) FISH assay.
MiR-24-3p could bind with 3’UTR of B4GAT1
TargetScan, PITA, miRanda, miRap websits were carried out to predict the downstream target of miR-24-3p (Figure 4A). Overexpression of miR-24-3p or silencing of MAFG-AS1 inhibited the level of B4GAT1 (Figure 4B–4E). Database revealed that there was a negative relationship between miR-24-3p and B4GAT1 (Figure 4F). The prediction binding sites were shown in Figure 4G. Luciferase assay verified that B4GAT1 was an underlying target of miR-24-3p (Figure 4G).
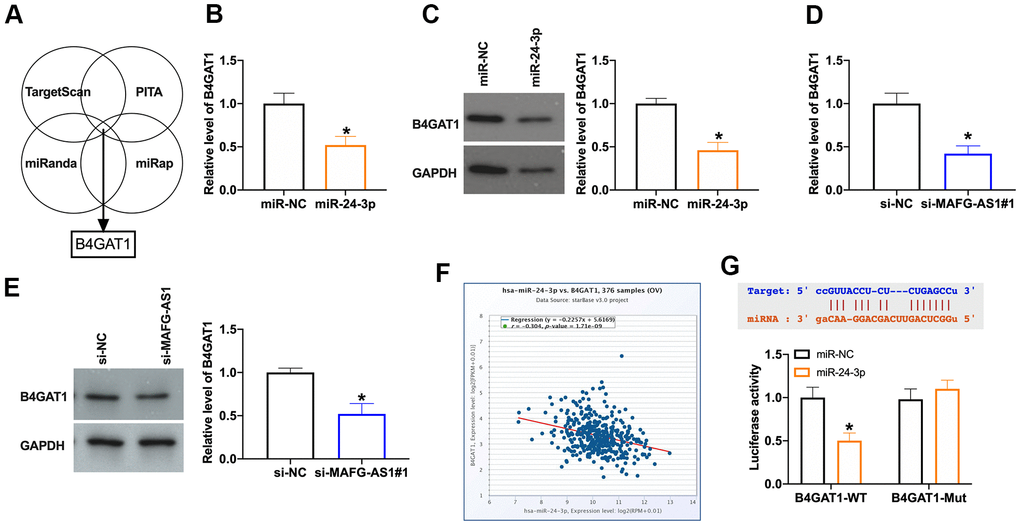
Figure 4. MiR-24-3p could bind with 3’UTR of B4GAT1. (A) Bioinformatics website predicted the target of miR-24-3p. (B) The level of B4GAT1 in SKOV3 after miR-24-3p transfection. n = 5, *P<0.05. (C) The protein level of B4GAT1 was detected by Western blot. n = 4, *P<0.05. (D) The level of B4GAT1 in SKOV3 after si-MAFG-AS1 transfection. n = 5, *P<0.05. (E) The protein level of B4GAT1 was detected by Western blot. n = 4, *P<0.05. (F) The relationship between B4GAT1 and miR-24-3p. (G) Luciferase reporter assay was used to determine the luciferase activity in HEK-293T cells of indicated groups. n = 3, *P<0.05.
MAFG-AS1 regulates tumor progression via miR-24-3p/B4GAT1 axis
Next, we would confirm the mechanism of MAFG-AS1. We co-transfected MAFG-AS1 vector with si-miR-24-3p mimic/B4GAT1. CCK-8 assay performed that si-MAFG-AS1 decreased the cell viability, which was prevented by si-miR-24-3p and B4GAT1 (Figure 5A). Colony formation assay indicated that si-miR-24-3p/B4GAT1 could promote the colony formation after si-MAFG-AS1 co-transfection (Figure 5B). Si-miR-24-3p/ B4GAT1 recovered the proliferation ability inhibited by si-MAFG-AS1 (Figure 5C). Migration and invasion ability was conducted by the transwell invasion system. Si-miR-24-3p/ B4GAT1 induces the decreased migration and invasion ability induced by si-MAFG-AS1 (Figure 5D). Further, flow cytometry results showed that si-MAFG-AS1 induced apoptosis, and si-miR-24-3p/B4GAT1 restored the apoptosis level (Figure 5E). Then, we found that si-miR-24-3p/B4GAT1 recovered the EMT progression and autophagy which was inhibited by si-MAFG-AS1 in SKOV3 cells (Figure 5F, 5G).
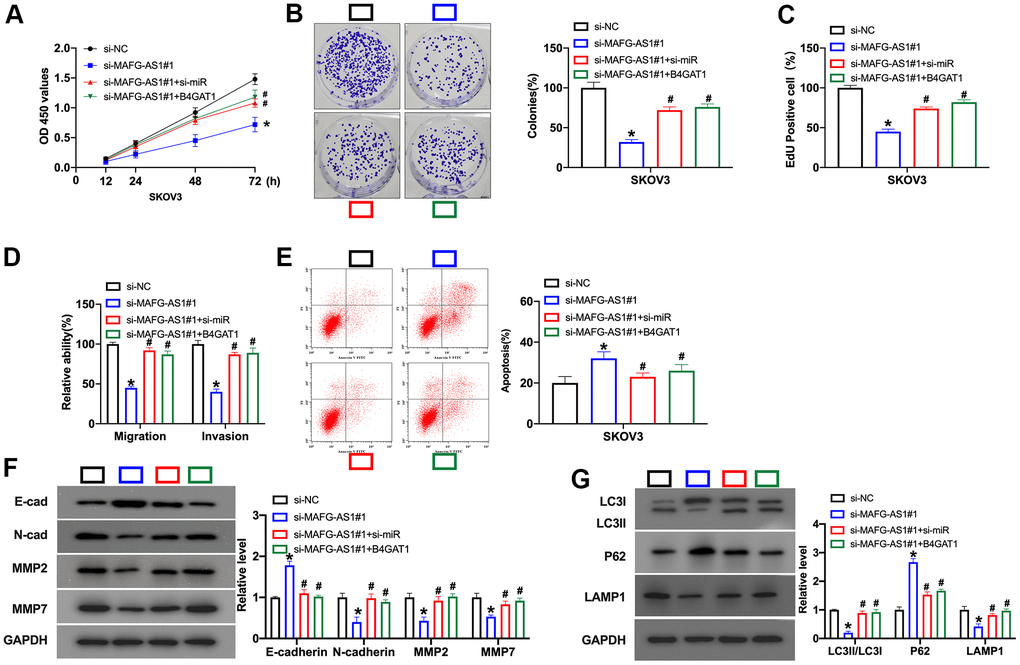
Figure 5. Silencing of MAFG-AS1 prevents cell development in OC cells via miR-24-3p/B4GAT1 signal. (A) The cell viability was detected by CCK-8 assay. n = 6, *P<0.05. (B) Clone formation assay was used to detect proliferation. n = 4, *P<0.05. (C) The proliferative ability of OC cells was assessed by EdU staining assay. (D) The migration and invasion ability of OC cells was measured by Transwell assay. n = 4, *P<0.05. (E) The apoptosis level was detected by flow cytometry. n = 4, *P<0.05. (F) The protein level of E-cadherin, N-cadherin, MMP2, MMP7 was detected by Western blot. n = 4, *P<0.05. (G) The protein level of LC3, P62, LAMP1 was detected by Western blot. n = 4, *P<0.05.
Silencing of MAFG-AS1 inhibits tumor growth
Further, we created xenograft nude mice model for exploring the function of MAFG-AS1. MAFG-AS1 was silenced using lentivirus, Len-si-MAFG-AS1 or Len-si-NC were injected via the tail vein, after 1 week, SKOV3 cell culture suspension (about 5 × 10⁶ cells) was subcutaneously injected into the skin of the posterior left upper limb of nude mice. Len-si-MAFG-AS1 markedly inhibited tumor growth (Figure 6A–6C). The tumor tissue was sectioned for Western blot. The results performed that down-regulation of MAFG-AS1 induced apoptosis, inhibited EMT process and autophagy (Figure 6D–6F).
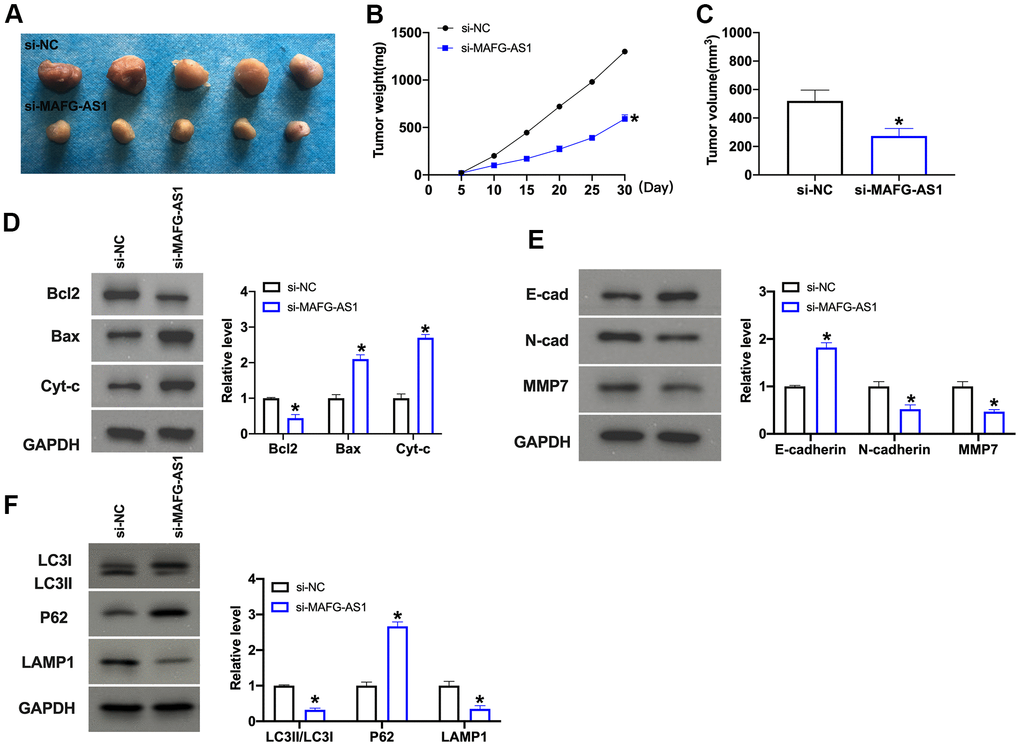
Figure 6. MAFG-AS promotes OC progression through EMT and autophagy in vivo. (A–C) Growth curve and tumor weight of xenografts from mice in indicated groups. n = 5, *P<0.05. (D) The protein level of Bcl1, Bax, and Cytochrome c was detected by Western blot. n = 4, *P<0.05. (E) The protein level of E-cadherin, N-cadherin, MMP2, MMP7 was detected by Western blot. n = 4, *P<0.05. (F) The protein level of LC3, P62, LAMP1 was detected by Western blot. n = 4, *P<0.05.
Discussion
Ovarian cancer cell migration and invasion are closely correlated with the tumor treatment effectiveness and serve as the leading cause of death in patients. Tumor cell migration, invasion process with various biological molecules, and mutual adjustment of regulatory pathways are closely related. The research on OC cell migration and invasion is mainly concentrated in neurotrophic factors and adhesion factors [4, 16, 17]. In recent years, studies have found that lncRNA can participate in biological processes, such as cell proliferation, apoptosis and migration, and abnormal expression of lncRNA can promote or inhibit tumor genesis and development [18, 19]. The effect of lncRNAs on ovarian cancer progression has been reported. For example, Wang et al. found that the level of ADAMTS9-AS2 in ovarian cancer was significantly decreased, which could weaken the proliferation and invasion of OC cells, and inhibit the EMT process and tumor growth in vivo. Through online prediction, ADAMTS9-AS2 can be used as the ceRNA of miR-182-5p. The addition of miR-182-5p analogue could weaken the inhibitory effect of ADAMTS9-AS2 overexpression on the proliferation and invasion of ovarian cancer cells. Therefore, ADAMTS9-AS2 can reduce the proliferation and invasion of ovarian cancer cells by regulating the miR-182-5p/FOXF2 axis [20]. Despite the wide investigations of the function of lncRNAs in ovarian cancer, the understanding of the role of lncRNAs in autophagy and EMT is still limited. Moreover, there are few studies on the function of lncRNA MAFG-ASl in ovarian cancer and other cancers. It has been reported that MAFG-AS1 is involved in the regulation of the malignant phenotype of ovarian cancer by targeting NFKB1-dependent IGF1 [21]. MAFG-AS1 promotes pancreatic cancer progression by regulating miR-3196 [22]. MAFG-AS1 enhances bladder urothelial carcinoma progression by HuR/PTBP1 signaling [23]. MAFG-AS1 contributes to colorectal cancer progression by modulating miR-147b/NDUFA4 axis [24]. In the present study, we identified that lncRNA MAFG-AS1 levels were upregulated in clinical ovarian cancer tissues. Silencing of MAFG-AS1 attenuated cell proliferation, migration and invasion in ovarian cancer cells. Meanwhile, MAFG-AS1 knockdown reduced autophagy and EMT in ovarian cancer cells. These data suggest that lncRNA MAFG-AS1 contributes to autophagy and EMT of ovarian cancer. Our finding provides new evidence of the crucial function of lncRNA MAFG-AS1 in ovarian cancer development, improving the understanding of the regulatory mechanisms of autophagy and EMT of ovarian cancer. The clinical significance of lncRNA MAFG-AS1 in ovarian cancer should be explored by more studies in the future.
The previous investigations have presented several examples of the function of lncRNA/miRNA axis in ovarian cancer, including EMT process. During EMT, epithelial cancer cells undergo a series of molecular, morphological and functional changes, accompanied by the loss of E-cadherin and the increase of N-cadherin, which leads to the impairment of epithelial-cell junction and cell polarity, the acquisition of mesenchymal motility cell phenotype, and the unstable binding with fibroblasts, endothelial cells and pericytes expressing N-cadherin [25, 26]. These changes promote the migration and infiltration of cancer cells through stromal tissue and the spread of the whole organism. Yong et al. found that the expression of NEAT1 is upregulated in ovarian cancer, which promotes cancer cell proliferation, migration, invasion and tumor growth in vivo. Using online database, it is predicted that the expression of miR-506 is upregulated after miR-506, NEAT1 knockdown, and has a significant effect on EMT. NEAT1 knockout significantly weakened the migration and invasion ability of ovarian cancer cells, while inhibition of miR-506 blocked the effect of NEAT1 knockout. In addition, inhibition of miR-506 can significantly enhance the invasive ability of cancer cells, and promote the expression of EMT key molecular protein zinc finger E-box binding box protein 1 (zinc finger E-box binding homeobox 1 ZEB1), vimentin (vimentin) and Snail family zinc finger protein 2 (snail family transcriptional repressor 2). These results suggest that NEAT1 regulates the proliferation, migration and EMT of ovarian cancer cells through ceRNA, as miR-506 [27]. It was found that the expression of H19 increased gradually in SKOV3 and OVCAR3 cells stimulated by TGF- β. In SKOV3 and OVCAR3 cells, the expression of H19 was down-regulated, and the epithelial marker E-cadherin was upregulated, while the stromal cell markers Snail and viment were down-regulated. The upregulation of H19 expression showed the opposite effect, indicating that H19 can promote the EMT process of ovarian cancer [28]. TUG1 (taurine upregulated gene 1) is located on human chromosome 22q122 and is related to the formation of photoreceptors and retina. It has been reported that the expression of TUG1 is upregulated in colorectal cancer, non-small cell lung cancer and glioma, and promotes the occurrence and development of tumors. Defeng Kuang et al. found that TUG1 can significantly promote the proliferation, invasion and migration of ovarian cancer cells and inhibit their apoptosis [29]. In our mechanism investigation, we found that lncRNA MAFG-AS1 induced B4GAT1 expression by sponging miR-24-3p in ovarian cancer cells and miR-24-3p/B4GAT1 axis was involved in MAFG-AS1-mediated ovarian cancer. Our finding provides innovative insight into the mechanism by which MAFG-AS1 contributes to ovarian cancer by regulating miR-24-3p/B4GAT1 axis. MiR-24-3p/B4GAT1 axis may be just one of the downstream targets of MAFG-AS1 and other mechanisms need to be identified in future investigations.
Conclusion
In conclusion, our study provides evidence that functional suppression of MAFG-AS1 could enhance tumor progression by reduction of autophagy and reversal of EMT via miR-24-3p/B4GAT1 signaling pathway in OC cells. Further study would be conducted to further confirm our conclusion for finding a new treatment method for patients with OC.
Materials and Methods
Clinical samples
The tumor tissues were isolated from 32 OC patients in Jinan Maternity and Child Care Hospital. All the cases were confirmed as OC by pathological diagnosis, except for patients with other malignant tumors and patients who received radiotherapy, chemotherapy and other treatment for OC before operation. The specimens used in the experiment were discussed and approved by the ethics committee of Jinan Maternity and Child Care Hospital, and the informed consent of the patients was obtained.
Cell culture
The human OC cell lines (A2780, OVCAR3, SKOV3, IOSE80) were cultured. Cell lines were purchased from the Science Cell Laboratory. Cells were cultured in RPMI-1640 with 10 % FBS and 100 μL/mL penicillin and streptomycin and placed at 37° C with 5% CO2.
RNA-Seq analysis
The RNA-seq analysis was performed to explore the potential correlation of lncRNAs with ovarian cancer. Total RNA was extracted from 3 IOSE80 cells and 3 SKOV3 cells. Meanwhile, the RNA-seq analysis was performed to explore the potential lncRNAs. The RNA sequencing assay was performed at KangChen Bio-tech (Shanghai, China) using Illumina HiSeq 4000 (Illumina, San Diego, CA, USA). Solexa pipeline version 1.8 was used to align the reads to the genome, generate raw counts corresponding to each known gene and calculate the RPKM (reads per kilobase per million) values. The differential expression lncRNAs were identified through fold change and P value (fold change ≥ 2 and P value < 0.05).
EdU assay
SKOV3 cells were inoculated in 24-well plates to normal growth stage. Add 200μL 50μmol/L EDU medium to each well, incubate in the incubator for 2 h, and wash with PBS. The cells were fixed with paraformaldehyde and incubated at room temperature for 10 min. Add 200 μl of glycine at the concentration of 2 mg/mL and incubate for 5 min, then wash with PBS on the shaking table for 5 min. Add 100μL PBS containing 0.5% Triton X-100 to each well, and incubate on shaking table for 10 min, wash with PBS twice, 5 min each time. Apollo staining was performed for 30 min in dark at room temperature, and 1×Hoechst 33342 DNA staining solution was incubated for 20 min in dark at room temperature. After PBS cleaning, photos were taken and counted under fluorescence microscope, and the results were analyzed.
CCK-8 assay
Cells were inoculated in 96-well plates with a density of 5 x 10³ cells/well and adhered to the wall after 24 h. After treatment and culture, CCK8 reagent 10 μl was added to each well and cultured in 5% CO2 incubator at 37° C for 2 h. The absorbance (A450 value) was measured by ELX800UV microplate analyzer and the proliferation inhibition rate was calculated.
Western blot
Add lysate to tissues or cells, centrifuge, take supernatant (test the concentration, add 5xLoading Buffer + 50μl B mercaptoethanol), boil for 5 min at 100° C, and store in refrigerator at -20° C. Preparation of SDS-PAGE glue, separation glue, adding sample, electrophoresis, film transfer, sealing solution for 1 hour, adding primary antibody, 4° C overnight, GAPDH(1:2000, mouse monoclonal antibody) as internal reference, PBST washing for 3 times, 1: The secondary antibody was diluted with 5 000 blocking solution for 1 hour, washed with PBST for 3 times, and the ECL substrate was developed for color development.
QRT-PCR
Total RNA was extracted by adding Trizol reagent, and reverse transcription was performed according to the reverse transcription kit. The qRTPCR reaction system was prepared as follows: 2XSTBR Green Taq PCR MIX5 μL, cDNA sample 1.6 μL, positive and negative primers 0.2 μL each, ddH2O 3 μL. The procedure was set at 95° C for 5 min, 95° C for 10 s, 60° C for 10 s, and 72° C for 10 s. The cycle was repeated for 40 times, and the final extension at 72° C was 10 min. GAPDH and U6 were used as internal reference genes for lncRNA and miRNA, respectively. The relative expression levels of lncRNA and miRNA were calculated by 2-ΔΔ CT method.
Clone formation assay
The transfected SKOV3 monollayer cells were digested with trypsin and blown into single cells, which were suspended in the culture medium of RPMI1640 containing 10%FBS. After gradient dilution (containing 50, 100 and 200 cells, respectively), the cells were inoculated in the culture dish containing 10 mL of pre-heated culture medium at 37° C, and gently rotated to make the cells evenly dispersed. Place in an incubator at 37° C and 5%CO2 for 2 ~ 3 weeks; When visible cell clones appeared in the petri dish, the culture was stopped, the supernatant was discarded, PBS was gently washed twice, methanol was fixed for 15 min, and GIEMSA was stained for 10 ~ 30min. After washing the staining solution, the cells were left to dry, observed and counted.
Transwell assay
Pretreatment of Transwell invasion experiment: Matrigel matrix gel and FBS free medium were diluted at 1:100, and then matrix gel (100 μL) was added after soaking in the invasion chamber. UV disinfection and sterilization were performed overnight. Meanwhile, 200 μL and 600 μL FBS free medium were added in the upper and lower invasion chamber, respectively. After being resuspended, the cell density was adjusted to 1.5 x10'/mL. FBS medium was added to the lower chamber of Transwell, resuspended cells were added to the upper chamber, and the culture was continued for 40 h. The chambers were fixed with ethanol. After crystal violet staining, non-invasive stromal cells were erased, 5 fields were randomly selected under the microscope for observation and counting, and the experiment was repeated for 3 times.
Luciferase assay
In the dual luciferase assay, WT-MAFG-AS1, Mut- MAFG-AS1 and miR-24-3p mimic were co-transfected into HEK-293T cells, and then incubated in an incubator for further 48h. Cells were collected and the dual luciferase activity was detected in each group according to the instructions of the dual luciferase reporter gene assay kit.
Nude mouse transplantation tumor experiment
10 nude mice were selected and their body weight was measured before inoculation. SKOV3 cells at logarithmic growth stage were collected in a clean table and digested with trypsin containing EDTA(mass fraction 0.01%), then suspended in serum-free medium. The cell density was adjusted to 2.5x10⁷ /mL. SKOV3 cell culture suspension (about 5 × 10⁶ cells) was subcutaneously injected into the skin of the posterior left upper limb of nude mice. The mass of the nude mice and the longest diameter (a, mm) and shortest diameter (b, mm) of the subcutaneous graft tumor were measured every 5 days to estimate the volume (V, mm). The animal study was reviewed and approved by Jinan Maternity and Child Care Hospital.
Statistical analysis
Prism 8.0 software was used for statistical analysis; the data were expressed as mean ±SEM. T-test was used for the comparison between the two groups, and one-way ANOVA was used for the comparison among the groups. P < 0.05 was statistically significant, and the experiments were repeated more than 3 times.
Author Contributions
Huapeng Yu made substantial contributions to the conception and design of the study; Qirong Li contributed to the acquisition, analysis and interpretation of the data; all authors participated in drafting the manuscript; Huapeng Yu and Qirong Li revised it critically; all authors read and approved the final version of the manuscript.
Conflicts of Interest
The authors declare that they have no conflicts of interest.
References
- 1. Kuroki L, Guntupalli SR. Treatment of epithelial ovarian cancer. BMJ. 2020; 371:m3773. https://doi.org/10.1136/bmj.m3773 [PubMed]
- 2. Armstrong DK, Walker JL. Role of Intraperitoneal Therapy in the Initial Management of Ovarian Cancer. J Clin Oncol. 2019; 37:2416–19. https://doi.org/10.1200/JCO.19.00671 [PubMed]
- 3. Vergote I, Harter P, Chiva L. Is There a Role for Intraperitoneal Chemotherapy, Including HIPEC, in the Management of Ovarian Cancer? J Clin Oncol. 2019; 37:2420–23. https://doi.org/10.1200/JCO.19.00091 [PubMed]
- 4. Gershenson DM, Okamoto A, Ray-Coquard I. Management of Rare Ovarian Cancer Histologies. J Clin Oncol. 2019; 37:2406–15. https://doi.org/10.1200/JCO.18.02419 [PubMed]
- 5. Kopp F, Mendell JT. Functional Classification and Experimental Dissection of Long Noncoding RNAs. Cell. 2018; 172:393–407. https://doi.org/10.1016/j.cell.2018.01.011 [PubMed]
- 6. Boon RA, Jaé N, Holdt L, Dimmeler S. Long Noncoding RNAs: From Clinical Genetics to Therapeutic Targets? J Am Coll Cardiol. 2016; 67:1214–26. https://doi.org/10.1016/j.jacc.2015.12.051 [PubMed]
- 7. Schmitt AM, Chang HY. Long Noncoding RNAs in Cancer Pathways. Cancer Cell. 2016; 29:452–63. https://doi.org/10.1016/j.ccell.2016.03.010 [PubMed]
- 8. Chen Y, Du H, Bao L, Liu W. LncRNA PVT1 promotes ovarian cancer progression by silencing miR-214. Cancer Biol Med. 2018; 15:238–50. https://doi.org/10.20892/j.issn.2095-3941.2017.0174 [PubMed]
- 9. Tao F, Tian X, Ruan S, Shen M, Zhang Z. miR-211 sponges lncRNA MALAT1 to suppress tumor growth and progression through inhibiting PHF19 in ovarian carcinoma. FASEB J. 2018; 32:6330–43. https://doi.org/10.1096/fj.201800495RR [PubMed]
- 10. Hu J, Zhang L, Mei Z, Jiang Y, Yi Y, Liu L, Meng Y, Zhou L, Zeng J, Wu H, Jiang X. Interaction of E3 Ubiquitin Ligase MARCH7 with Long Noncoding RNA MALAT1 and Autophagy-Related Protein ATG7 Promotes Autophagy and Invasion in Ovarian Cancer. Cell Physiol Biochem. 2018; 47:654–66. https://doi.org/10.1159/000490020 [PubMed]
- 11. Brabletz T, Kalluri R, Nieto MA, Weinberg RA. EMT in cancer. Nat Rev Cancer. 2018; 18:128–34. https://doi.org/10.1038/nrc.2017.118 [PubMed]
- 12. De Craene B, Berx G. Regulatory networks defining EMT during cancer initiation and progression. Nat Rev Cancer. 2013; 13:97–110. https://doi.org/10.1038/nrc3447 [PubMed]
- 13. Pastushenko I, Brisebarre A, Sifrim A, Fioramonti M, Revenco T, Boumahdi S, Van Keymeulen A, Brown D, Moers V, Lemaire S, De Clercq S, Minguijón E, Balsat C, et al. Identification of the tumour transition states occurring during EMT. Nature. 2018; 556:463–68. https://doi.org/10.1038/s41586-018-0040-3 [PubMed]
- 14. Yim GW, Kim HJ, Kim LK, Kim SW, Kim S, Nam EJ, Kim YT. Long Non-coding RNA HOXA11 Antisense Promotes Cell Proliferation and Invasion and Predicts Patient Prognosis in Serous Ovarian Cancer. Cancer Res Treat. 2017; 49:656–68. https://doi.org/10.4143/crt.2016.263 [PubMed]
- 15. Lou Y, Jiang H, Cui Z, Wang L, Wang X, Tian T. Linc-ROR induces epithelial-to-mesenchymal transition in ovarian cancer by increasing Wnt/β-catenin signaling. Oncotarget. 2017; 8:69983–94. https://doi.org/10.18632/oncotarget.19545 [PubMed]
- 16. Morice P, Gouy S, Leary A. Mucinous Ovarian Carcinoma. N Engl J Med. 2019; 380:1256–66. https://doi.org/10.1056/NEJMra1813254 [PubMed]
- 17. Reavis HD, Drapkin R. The tubal epigenome - An emerging target for ovarian cancer. Pharmacol Ther. 2020; 210:107524. https://doi.org/10.1016/j.pharmthera.2020.107524 [PubMed]
- 18. Bhan A, Soleimani M, Mandal SS. Long Noncoding RNA and Cancer: A New Paradigm. Cancer Res. 2017; 77:3965–81. https://doi.org/10.1158/0008-5472.CAN-16-2634 [PubMed]
- 19. Huarte M. The emerging role of lncRNAs in cancer. Nat Med. 2015; 21:1253–61. https://doi.org/10.1038/nm.3981 [PubMed]
- 20. Wang A, Jin C, Li H, Qin Q, Li L. LncRNA ADAMTS9-AS2 regulates ovarian cancer progression by targeting miR-182-5p/FOXF2 signaling pathway. Int J Biol Macromol. 2018; 120:1705–13. https://doi.org/10.1016/j.ijbiomac.2018.09.179 [PubMed]
- 21. Bai Y, Ren C, Wang B, Xue J, Li F, Liu J, Yang L. LncRNA MAFG-AS1 promotes the malignant phenotype of ovarian cancer by upregulating NFKB1-dependent IGF1. Cancer Gene Ther. 2021. [Epub ahead of print]. https://doi.org/10.1038/s41417-021-00306-8 [PubMed]
- 22. Ye L, Feng W, Weng H, Yuan C, Liu J, Wang Z. MAFG-AS1 aggravates the progression of pancreatic cancer by sponging miR-3196 to boost NFIX. Cancer Cell Int. 2020; 20:591. https://doi.org/10.1186/s12935-020-01669-y [PubMed]
- 23. Xiao M, Liu J, Xiang L, Zhao K, He D, Zeng Q, Zhang Q, Xie D, Deng M, Zhu Y, Zhang Y, Liu Y, Bo H, et al. MAFG-AS1 promotes tumor progression via regulation of the HuR/PTBP1 axis in bladder urothelial carcinoma. Clin Transl Med. 2020; 10:e241. https://doi.org/10.1002/ctm2.241 [PubMed]
- 24. Cui S, Yang X, Zhang L, Zhao Y, Yan W. LncRNA MAFG-AS1 promotes the progression of colorectal cancer by sponging miR-147b and activation of NDUFA4. Biochem Biophys Res Commun. 2018; 506:251–58. https://doi.org/10.1016/j.bbrc.2018.10.112 [PubMed]
- 25. Nieto MA, Huang RY, Jackson RA, Thiery JP. EMT: 2016. Cell. 2016; 166:21–45. https://doi.org/10.1016/j.cell.2016.06.028 [PubMed]
- 26. Puisieux A, Brabletz T, Caramel J. Oncogenic roles of EMT-inducing transcription factors. Nat Cell Biol. 2014; 16:488–94. https://doi.org/10.1038/ncb2976 [PubMed]
- 27. Yong W, Yu D, Jun Z, Yachen D, Weiwei W, Midie X, Xingzhu J, Xiaohua W. Long noncoding RNA NEAT1, regulated by LIN28B, promotes cell proliferation and migration through sponging miR-506 in high-grade serous ovarian cancer. Cell Death Dis. 2018; 9:861. https://doi.org/10.1038/s41419-018-0908-z [PubMed]
- 28. Li J, Huang Y, Deng X, Luo M, Wang X, Hu H, Liu C, Zhong M. Long noncoding RNA H19 promotes transforming growth factor-β-induced epithelial-mesenchymal transition by acting as a competing endogenous RNA of miR-370-3p in ovarian cancer cells. Onco Targets Ther. 2018; 11:427–40. https://doi.org/10.2147/OTT.S149908 [PubMed]
- 29. Braga EA, Fridman MV, Moscovtsev AA, Filippova EA, Dmitriev AA, Kushlinskii NE. LncRNAs in Ovarian Cancer Progression, Metastasis, and Main Pathways: ceRNA and Alternative Mechanisms. Int J Mol Sci. 2020; 21:8855. https://doi.org/10.3390/ijms21228855 [PubMed]