


Introduction
Liver cancer represents a type of frequent human malignancy responsible for the mortality in both men and women worldwide [1]. In China, every year nearly 0.5 million people are diagnosed with liver cancer, and around 0.3 million people die from this disease [2]. Hepatocellular carcinoma (HCC) is the main type of liver cancer. Various factors including nonalcoholic steatohepatitis, alcoholism, viral infection and smoking are shown to contribute to the development of HCC [3]. The 5-year overall survival (OS) of these patients is less than 30% and varies among different populations [3]. Up to date, the current treatment strategies for HCC are quite limited [3]. Moreover, the high heterogeneity in HCC as well as the complex risk factors make the prognosis prediction very difficult. Therefore, it is of paramount importance to further explore possible mechanisms underlying the pathophysiology of HCC.
Recently, omics studies have been conducted to explore possible mechanisms underlying the HCC pathophysiology [4, 5]. The great progress in high-throughput technologies have enabled the scientists to reconstruct the regulatory signaling pathways involved in cancer biology [4, 5]. Using microarray screening techniques, differentially expressed gene (DEG) profiles between normal and cancerous tissues have been identified in HCC studies. Studies have performed the high throughput microarray analysis in different HCC stages, which could be key to identify potential biomarkers of for HCC prognosis [6, 7]. Zhang et al., performed bioinformatics analysis and found that 9 weighted genes participated in HCC pathophysiology [8, 9]. Zhang et al., performed analysis using The Cancer Genome Atlas (TCGA) RNA sequencing data and found that transketolase and olfactomedin 2 could serve as novel prognostic biomarker for HCC patients [10]. Xiao et al., performed the bioinformatics analysis and experimental validation showing that upregulation of centromere protein M promotes hepatocarcinogenesis through multiple mechanisms [11]. However, due to the large amount of the existing microarray datasets, sufficient mining of these datasets has been a great challenging in the HCC studies. Thus, more efforts should be invested to further explore these microarray datasets, in order to decipher the complex molecular mechanisms underlying HCC pathophysiology.
This explored the Gene Expression Omnibus (GEO) microarray datasets related to HCC progression. In this study, a final of 5 microarray datasets were included the analysis. The common DEGs compared between HCC tissues and normal tissues among all these datasets were identified. These common DEGs were subjected to enrichment analysis to reveal their potential actions in HCC progression. Furthermore, the hub genes were derived from the protein-protein interaction (PPI) network constructed from common DEGs. Expression profiles and prognostic potentials of the hub genes in HCC were further explored using series of online tools including Gene Expression Profiling Interactive Analysis (GEPIA) [12], UALCAN [13] and Kaplan-Meier (KM) plotter [14] databases, respectively. Finally, Kinesin Family Member 20A (KIF20A), one of the hub genes, was further subjected to the experimental validating studies, so as to confirm the role of KIF20A in the pathophysiology of HCC.
Results
Screening of common DEGs among GSE84598, GSE87630, GSE101685, GSE101728 and GSE121248 microarray datasets
The DEGs in different microarray datasets were analyzed using GEO2R tool. In GSE84598, 1163 DEGs (up-regulation: 395 and down-regulation: 768) were screened between normal liver and HCC tissues (Figure 1A); in GSE87630, 1959 DEGs (up-regulation: 905 and down-regulation: 1054) were screened between normal liver and HCC tissues (Figure 1B); in GSE101685, 829 DEGs (up-regulation: 284 and down-regulation: 545) were screened between normal liver and HCC tissues (Figure 1C); in GSE101728, 2596 DEGs (up-regulation: 1172 up-regulated and down-regulation: 1424) were screened between normal liver and HCC tissues (Figure 1D); in GSE121248, 1545 DEGs (up-regulation: 663 and down-regulation: 882) were screened between normal liver and HCC tissues (Figure 1E). As shown in Figure 1F, 1G, 39 up-regulated and 138 down-regulated common DEGs among the five datasets were detected.
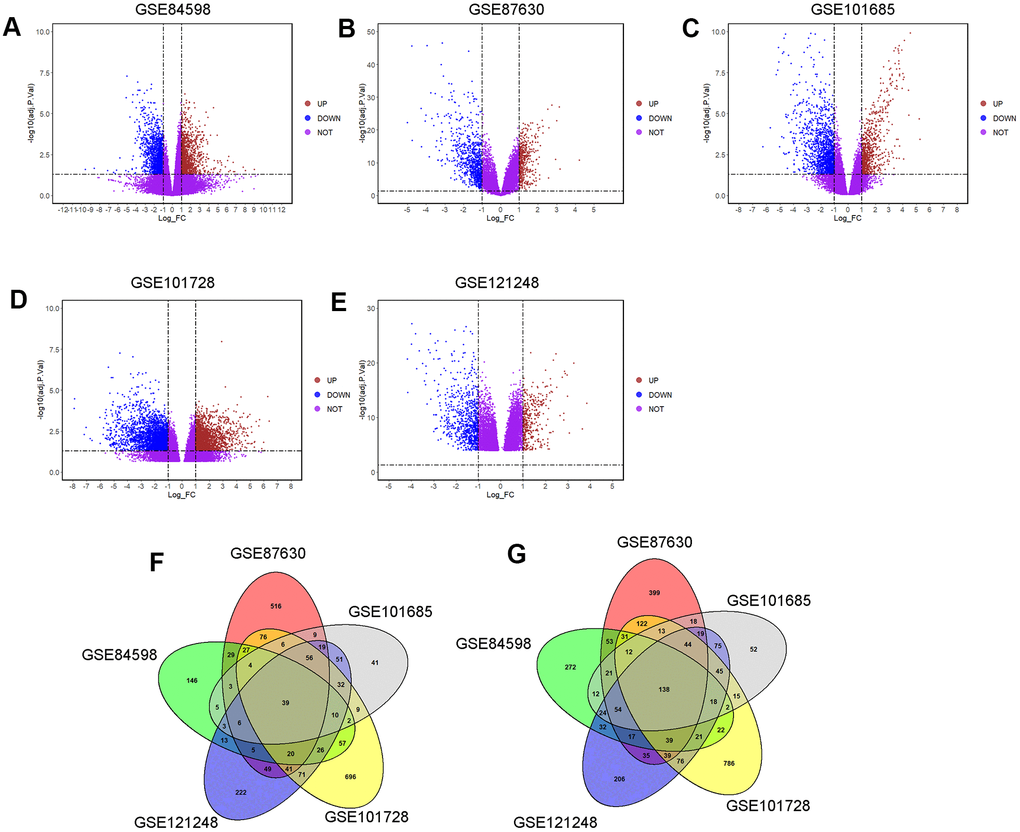
Figure 1. Identification of common DEGs among GSE84598, GSE87630, GSE101685, GSE101728 and GSE121248 microarray datasets. The DEGs in datasets: (A) GSE84598, (B) GSE87630, (C) GSE101685, (D) GSE101728 and (E) GSE121248 were visualized by the volcano plots. UP = up-regulated DEGs; DOWN= down-regulated DEGs; NOT = Not-significantly DEGs. (F) Venn diagram of the up-regulated common DEGs among the five datasets. A total of 39 up-regulated common DEGs was screened. (G) Venn diagram of the down-regulated common DEGs among the five datasets. A total of 138 down-regulated common DEGs was screened.
Enrichment analysis of common DEGs
Common DEGs were first subjected to Gene Ontology (GO) enrichment analysis. Common DEGs were significantly enriched in “carboxylic acid catabolic process”, “small molecule metabolic process”, “organic acid catabolic process”, “detoxification of copper ion” and so on of the biological process category (Supplementary Figure 1A); in the “pore complex”, “membrane attack complex”, “extracellular vesicle", ”extracellular space” and so on of the cellular component category (Supplementary Figure 1B); in the “monooxygenase activity”, “oxidoreductase activity”, “reduction of molecular oxygen”, “heme binding” and so on of molecular function category (Supplementary Figure 1D). Common DEGs were significantly enriched in KEGG pathways including “tryptophan metabolism”, “prion diseases”, “mineral absorption”, “metabolic pathways”, “complement and coagulation cascades” and “caffeine metabolism” (Supplementary Figure 1D).
PPI network construction and hub genes screening using MCODE
PPI network of the common DEGs was constructed using the Search Tool for the Retrieval of Interacting Genes (STRING) database. Constructed PPI network contains 175 nodes and 346 edges with an average node degree of 3.95 (PP enrichment P-value < 0.001; Figure 2A). Furthermore, the interacted genes were imported into the Cytoscape software, and the MCODE was used for the module analysis. As shown in Figure 2B, one sub-module with MCODE score greater than 5.0 was identified, and this module has a MCODE score of 21.333 and contains 22 nodes and 224 edges (Figure 2B). As such, the 22 genes in this module were selected for the expression and survival analysis.
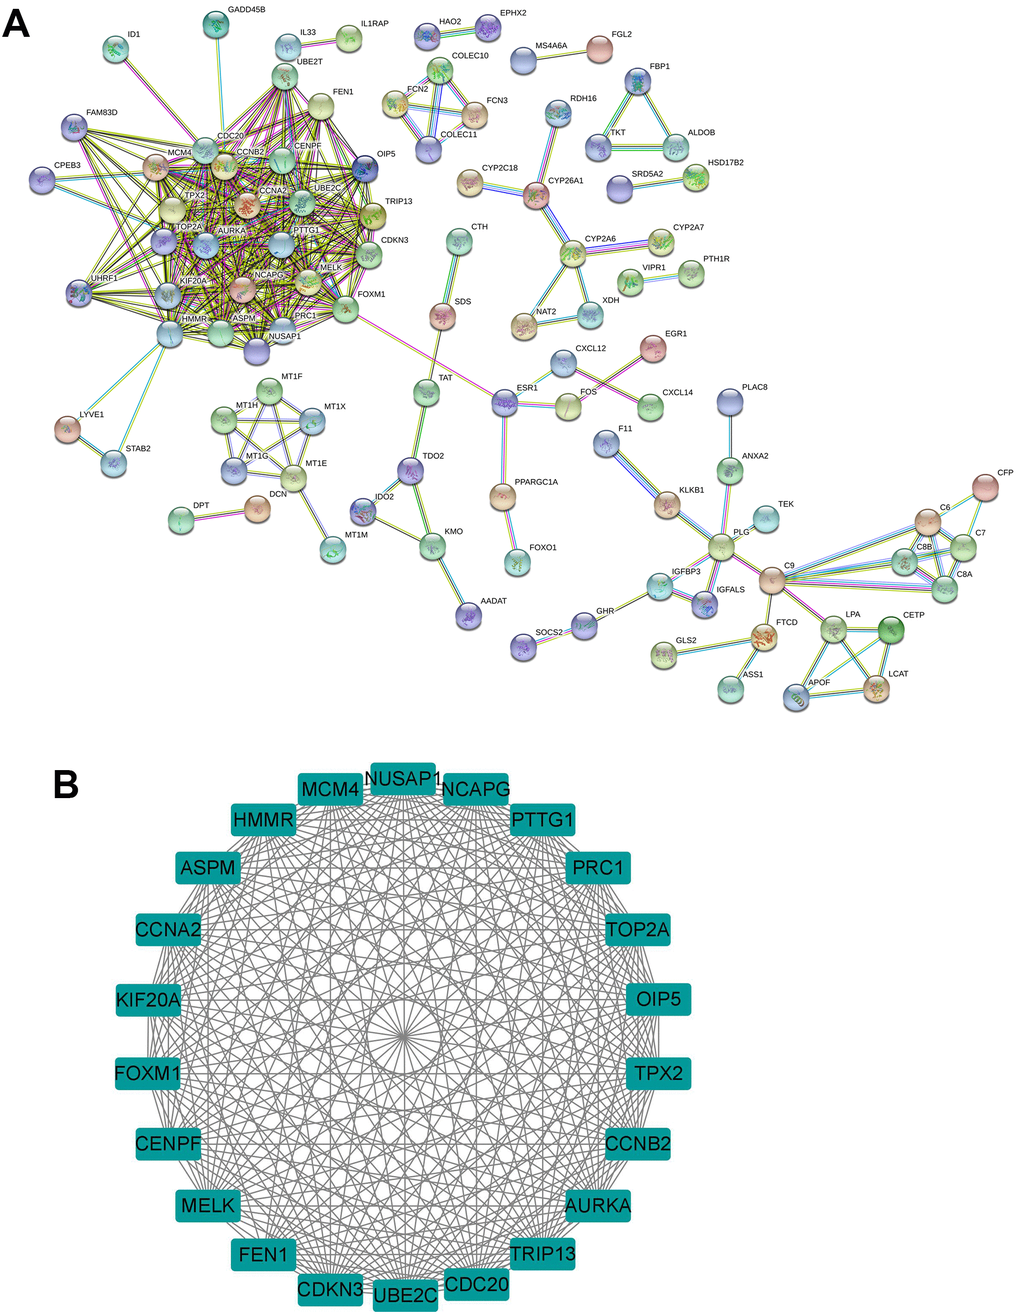
Figure 2. Identification of hub genes from common DEGs. (A) PPI network of the common DEGs was constructed by the STRING database. (B) The sub-module of PPI network as identified by the MCODE tool in Cytoscape.
Hub gene expression analysis
Expression levels of 22 hub genes were analyzed using GEPIA and UALCAN databases. The 22 hub genes (ASPM, AURKA, CCNA2, CCBN2, CDC20, CDKN3, CENPF, FEN1, FOXM1, HMMR, KIF20A, MCM4, MELK, NCAPG, NUSAP1, OIP5, PRC1, PTTG1, TOP2A, TPX2, TRIP13 and UBE2C) were up-regulated n HCC tissues comparing normal liver tissues (Figure 3). Consistently, mRNA expression of 22 hub genes was analyzed by using UALCAN databases, and the heatmap showed that these genes were up-regulated in HCC tissues (Supplementary Figure 2).
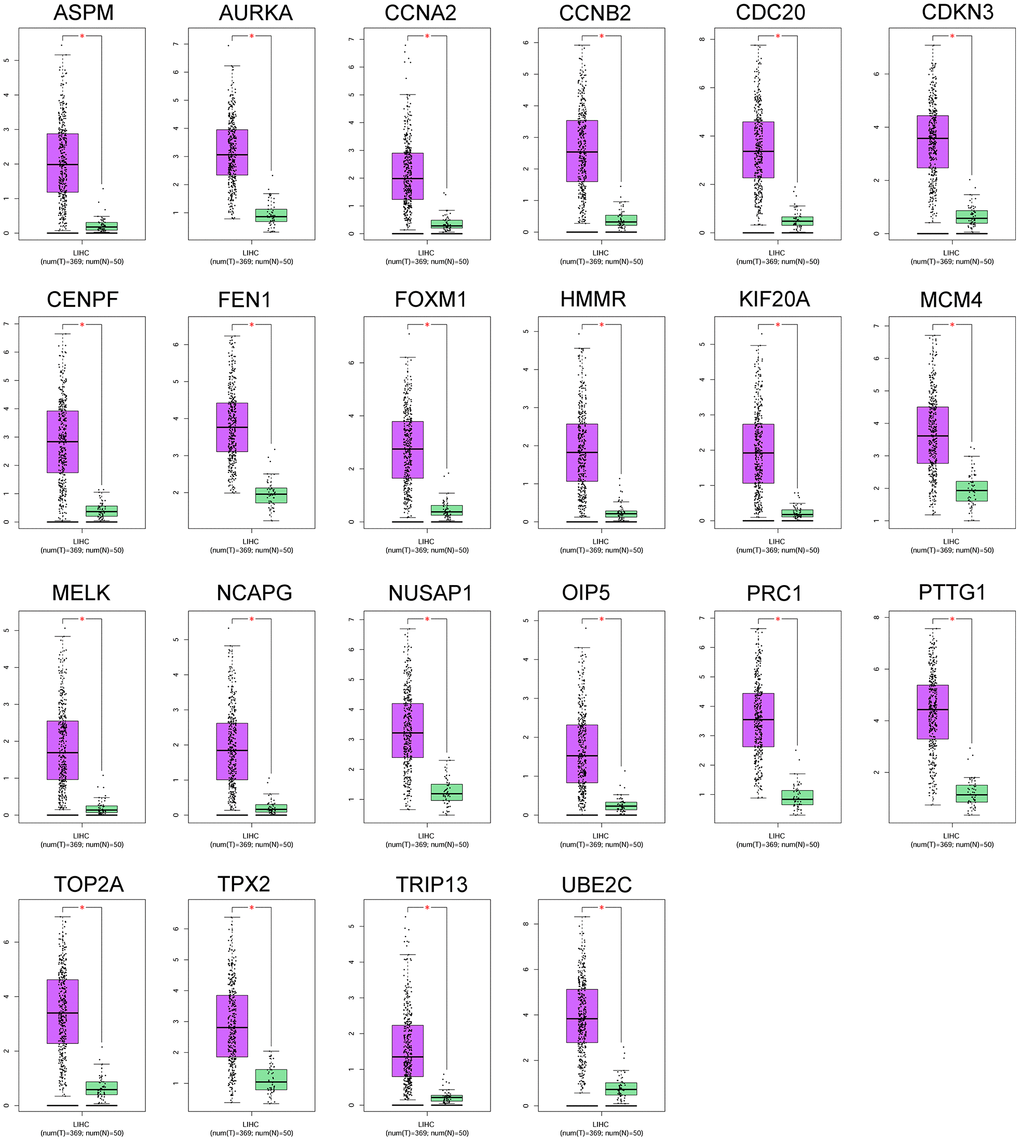
Figure 3. The mRNA expression of 22 hub genes between normal liver tissues and HCC tissues was analyzed by the GEPIA tool. The genes including ASPM, AURKA, CCNA2, CCBN2, CDC20, CDKN3, CENPF, FEN1, FOXM1, HMMR, KIF20A, MCM4, MELK, NCAPG, NUSAP1, OIP5, PRC1, PTTG1, TOP2A, TPX2, TRIP13 and UBE2C were analyzed. N = normal liver tissue group (n = 50); T = HCC tissues group (n = 369); *P<0.05.
Survival analysis of hub genes
KM plotter database was used to perform survival analysis. Among the 22 hub genes, the up-regulated 17 genes (APSM, AURKA, CCNA2, CCNB2, CDC20, FEN1, FOXM1, HMMR, KIF20A, MELK, NCAPG, OIP5, PRC1, PTTG1, TOP2A, TPX2 and TRIP13) were correlated with the shorter OS of patients with HCC (Figure 4); while the other 5 hub genes were not correlated with the OS of patients with HCC. Furthermore, the 17 hub genes were subjected to disease-free survival (DFS) analysis using KM plotter, and the up-regulated 15 hub genes (AURKA, CCNA2, CDC20, CENPF, FOXM1, HMMR, KIF20A, MELK, OIP5, PRC1, PTTG1, TOP2A, TPX2, TRIP13 and UBE2C) were correlated with shorter DFS of HCC patients (Figure 5). Based on the above results, 12 hub genes (AURKA, CCNA2, CDC20, FOXM1, HMMR, KIF20A, OIP5, PRC1, PTTG1, TOP2A, TPX2 and TRIP13) predicting both poor overall survival and DFS of patients with HCC were further confirmed using UALCAN databases. As shown in Figure 6, the up-regulation of AURKA (Figure 6A), CCNA2 (Figure 6B), CDC20 (Figure 6C), FOXM1 (Figure 6D), HMMR (Figure 6E), KIF20A (Figure 6F), PTTG1 (Figure 6I), TOP2A (Figure 6J), TPX2 (Figure 6K) and TRIP13 (Figure 6L) was significantly correlated with shorter OS; while OIP5 (Figure 6G) and PRC1 (Figure 6H) were not correlated with the OS. Thus, 10 hub genes including AURKA, CCNA2, CDC20, FOXM1, HMMR, KIF20A, PTTG1, TOP2A, TPX2 and TRIP13 may predict poor prognosis of the patient with HCC.
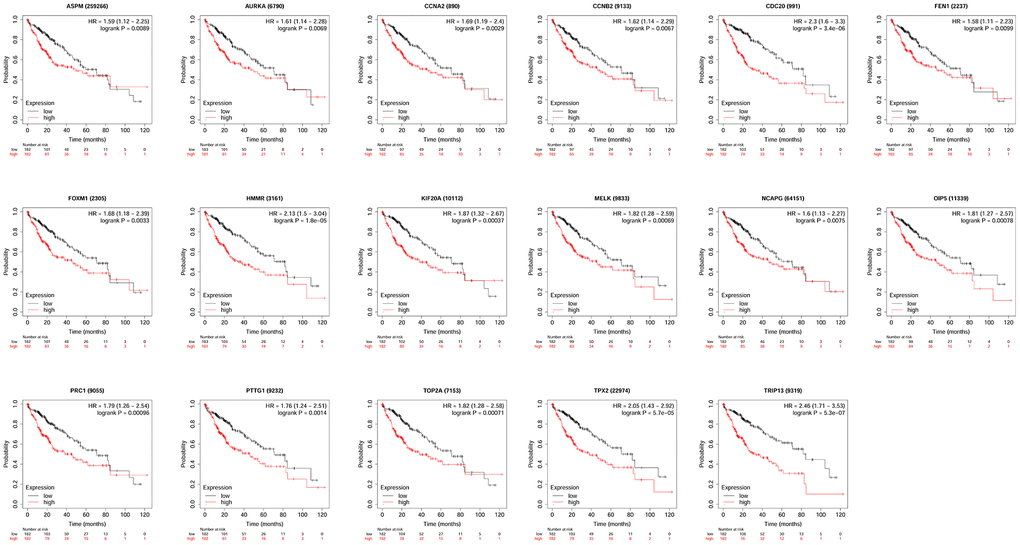
Figure 4. The correlation between the expression of 17 hub genes (APSM, AURKA, CCNA2, CCNB2, CDC20, FEN1, FOXM1, HMMR, KIF20A, MELK, NCAPG, OIP5, PRC1, PTTG1, TOP2A, TPX2 and TRIP13) and the overall survival of patients with HCC was analyzed by KM plotter. A total of 364 patients with HCC (low expression = 182 and high expression = 182) were included in the analysis.
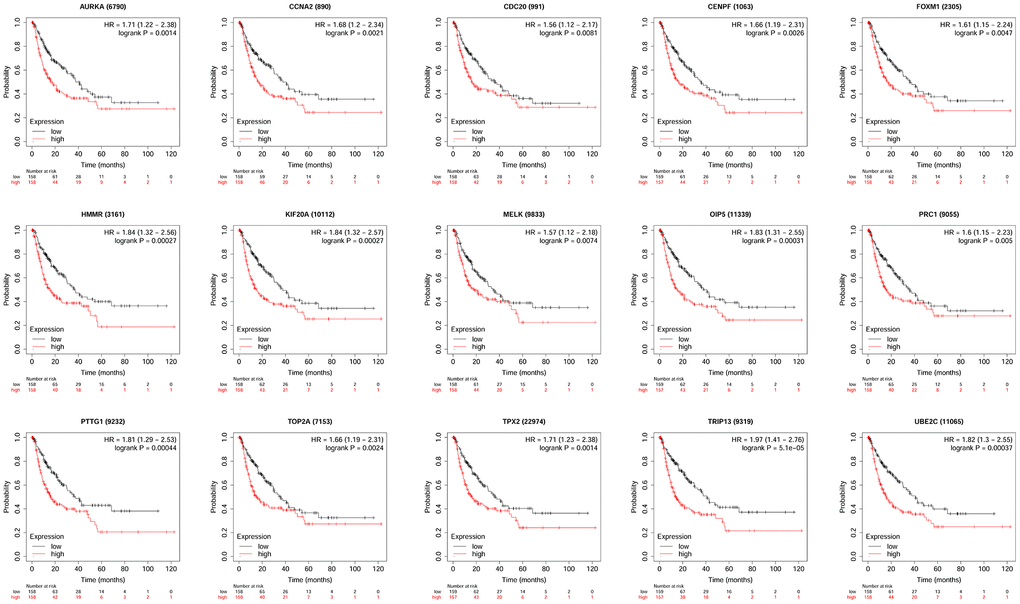
Figure 5. The correlation between the expression of 15 hub genes (AURKA, CCNA2, CDC20, CENPF, FOXM1, HMMR, KIF20A, MELK, OIP5, PRC1, PTTG1, TOP2A, TPX2, TRIP13 and UBE2C) and the disease-free survival of patients with HCC was analyzed by KM plotter. A total of 316 patients with HCC (low expression = 158 and high expression = 158) were included in the analysis.
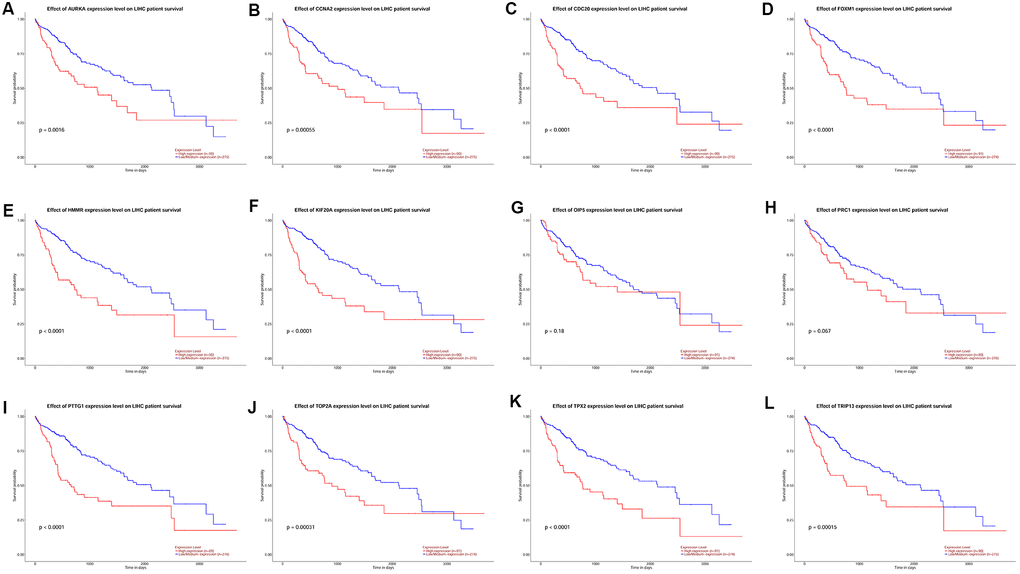
Figure 6. The correlation between the expression of 12 hub genes AURKA (A), CCNA2 (B), CDC20 (C), FOXM1 (D), HMMR (E), KIF20A (F), OIP5 (G), PRC1 (H), PTTG1 (I), TOP2A (J), TPX2 (K) and TRIP13 (L) and the disease-free survival of patients with HCC was analyzed by UALCAN database. A total of 365 patients with HCC (low/medium expression = 274 and high expression = 91) were included in the analysis.
Effects of KIF20A knockdown on the cell proliferation and caspase-3 and -9 activities of HCC cells
Among these genes, KIF20A has not been fully explored, thus, role of KIF20A in the HCC pathophysiology was further explored. KIF20A expression was remarkably up-regulated in the HCC cell lines i.e. HepG2 and SK-Hep1 when compared to normal liver cell line i.e. LO2 (Figure 7A). Furthermore, the in vitro functions of KIF20A in HCC cells were evaluated by the loss-of-function studies. The knockdown of KIF20A in both HepG2 and SK-Hep1 cells was achieved by transfecting these cells with KIF20A; the transfection of KIF20A siRNA significantly decreased the mRNA expression level of KIF20A in HepG2 and SK-Hep1 cells (Figure 7B, 7C). The MTS proliferation assay revealed that silence of KIF20A significantly attenuated the proliferative capacities of both HepG2 and SK-Hep1 cells as compared to the si-NC group (Figure 7D, 7E). Caspase-3 and -9 activity kits were used to measure caspase-3 and -9 activities in HCC cells, respectively. As shown in Figure 7F and 7G, KIF20A knockdown significantly increased the caspase-3 activities in both HepG2 and SK-Hep1 cells (Figure 7F, 7G); and consistent findings for caspase-9 were also detected in the HCC cells with KIF20A siRNA transfection (Figure 7H, 7I).
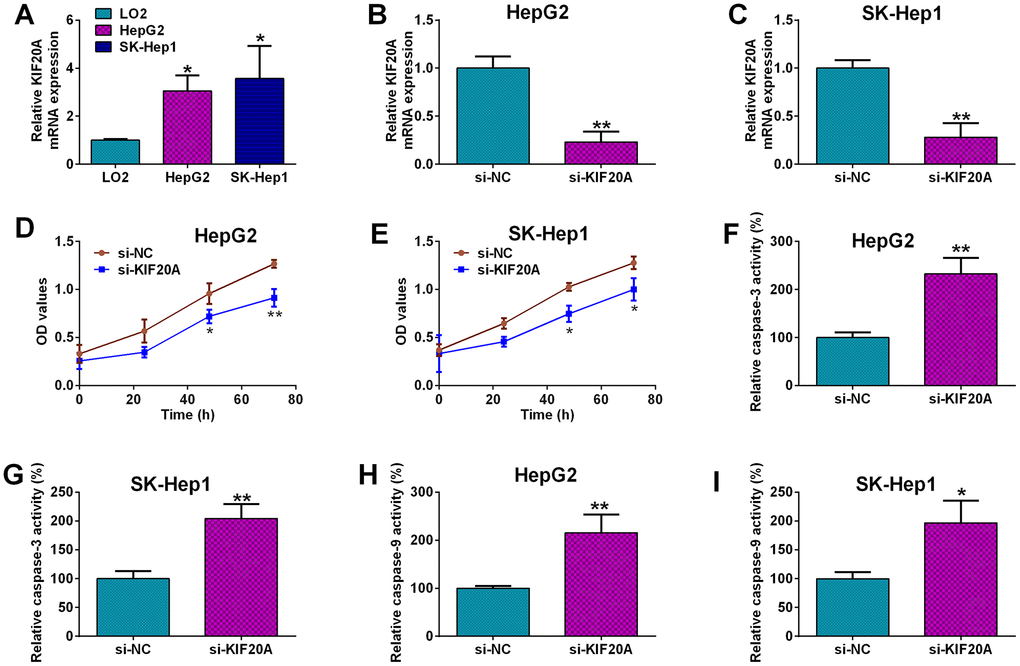
Figure 7. Effects of KIF20A knockdown on the HCC cell proliferation and capsase-3 and -9 activities. (A) qRT-PCR analysis of KIF20A mRNA expression in LO2, HepG2 and SK-Hep1 cells. (B, C) qRT-PCR analysis of KIF20A mRNA expression level in HepG2 (B) and SK-Hep1 cells (C) transfected with si-NC or si-KIF20A. (D, E) MTS assay analysis of cell proliferation of HepG2 (D) and SK-Hep1 cells (E) transfected with si-NC or si-KIF20A. (F, G) Capsase-3 activity analysis of caspase-3 activities of HepG2 (F) and SK-Hep1 cells (G) transfected with si-NC or si-KIF20A. (H, I) Capsase-9 activity analysis of caspase-9 activities of HepG2 (H) and SK-Hep1 cells (I) transfected with si-NC or si-KIF20A.
Effects of KIF20A knockdown on the chemosensitivity of HCC cells
Furthermore, the effects of KIF20A knockdown on the cisplatin-resistance and sorafenib-resistance were analyzed in HepG2 and SK-Hep1 cells. Knockdown of KIF20A significantly increased the chemo-sensitivity to cisplatin in HepG2 cells when compared to si-NC group with the si-KIF20A group exhibiting decreased IC50 values of cisplatin (Figure 8A, 8B); consistent findings were also found in SK-Hep1 cells (Figure 8C, 8D). More importantly, knockdown of KIF20A significantly decreased the IC50 values of sorafenib in both HepG2 (Figure 8E, 8F) and SK-Hep1 cells (Figure 8G, 8H) when compared to si-NC group, suggesting the KIF20A increased the chemo-sensitivity to sorafenib in HCC cell lines.
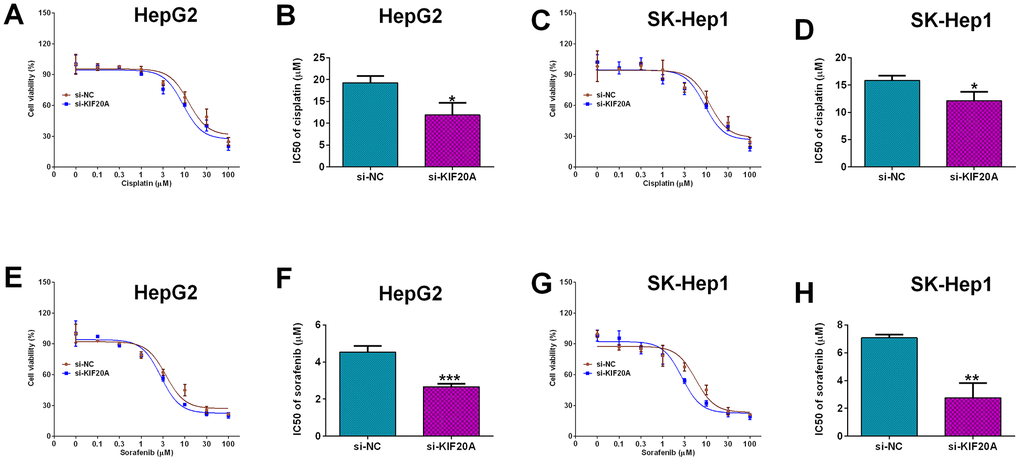
Figure 8. Effects of KIF20A knockdown on the chemo-sensitivity of HCC cells. (A) Cell viability of si-NC or si-KIF20A-transfected HepG2 cells after treatment with different concentrations of cisplatin. (B) IC50 values of cisplatin in HepG2 cells transfected with si-NC or si-KIF20A. (C) Cell viability of si-NC or si-KIF20A-transfected SK-Hep1 cells after treatment with different concentrations of cisplatin. (D) IC50 values of cisplatin in SK-Hep1 cells transfected with si-NC or si-KIF20A. (E) Cell viability of si-NC or si-KIF20A-transfected HepG2 cells after treatment with different concentrations of sorafenib. (F) IC50 values of sorafenib in HepG2 cells transfected with si-NC or si-KIF20A. (G) Cell viability of si-NC or si-KIF20A-transfected SK-Hep1 cells after treatment with different concentrations of sorafenib. (H) IC50 values of sorafenib in SK-Hep1 cells transfected with si-NC or si-KIF20A. N = 3; *P<0.05, **P<0.01 and ***P<0.001.
Discussion
HCC represents a type of frequent human malignancy, and patients with advanced HCC had poor prognosis, though great improvements have been made in the HCC treatment [3]. Recently, the high-throughput technologies using microarray datasets have significantly promoted the discovery of novel targets associated with HCC pathophysiology [5]. Yet, more efforts should be investigated to reveal potential mechanisms underlying HCC progression. This study collected five microarray datasets associated with HCC, and identified a total of 177 common DEGs between normal liver and HCC tissues among these datasets. Further functional enrichment and constructed PPI network screened 22 hub genes from the common DEGs. The 22 hub genes were significantly up-regulated in HCC tissues. The survival analysis showed that 10 hub genes including AURKA, CCNA2, CDC20, FOXM1, HMMR, KIF20A, PTTG1, TOP2A, TPX2 and TRIP13 were correlated with poor prognosis of HCC patients. More importantly, functional studies demonstrated that KIF20A knockdown suppressed HCC cell proliferation and increased the HCC cell chemosensitivity to cisplatin and sorafenib. Collectively, these results indicated that these screened hub genes could potential serve as the key biomarkers for HCC.
This study revealed that 10 hub genes were associated with shorter overall survival and DFS of patients with HCC. Among these hub genes, AURKA, CCNA2, CDC20, TOP2A and TPX2 were associated with the cell division and cell cycle transition based on the functional enrichment analysis. Overexpression of AURKA and TPX2 enhanced HCC progression [15–17], and up-regulation of these genes predicted worse prognosis of patients with HCC [18], which were consistent with our findings. CCNA2 is a member of cyclin family and participates in modulating cell cycle; knockdown of CCNA2 attenuated the HCC tumor growth [19], and CCNA2 activation predicted poor prognosis of HCC [20]. CDC20 interacts with the anaphase-promoting complex/cyclosome in cell cycle and involves in tumor progression. Studies have found that high CDC20 expression might contribute to HCC progression [21], and predicted worse prognosis in HCC patients [22], which was consistent with our findings. TOP2A is a key mediator in regulating chromosome segregation, DNA topological structure, and cell cycle progression. TOP2A was found be to overexpressed in HCC tissues [23], and TOP2A overexpression was correlated with early age onset of HCC, shorter HCC patients survival and chemoresistance [24], which is consistent with our findings that TOP2A predicted poor prognosis of HCC. In terms of FOXM1 and TRIP13, they have been well documented for their oncogenic roles in HCC, and FOXM1 and TRIP13 high expression was associated with the poor prognosis of HCC patients [25, 26]. HMMR is highly expressed in various solid tumors and is involved in tumorigenesis [27–29]. Recently, a study demonstrated that HCC patients with HCC with high increased HMMR level had worse prognosis [30], which is consistent with our findings, suggesting that HMMR is likely to serve as a potential biomarker for HCC prognosis.
KIF20A belongs to the KIF superfamily, and aberrant expression of KIF20A was associated with chromosome instability in HCC [9, 31]. Studies have shown that in G2 phase of cell cycle, KIF20A is accumulated in the nucleus, which results in enhanced pathologic hepatocyte proliferation [31]. Studies have showed that KIF20A high expression was linked to poor survival of HCC patients [32–34], which is consistent with our findings. Our in vitro functional results revealed that KIF20A silence attenuated the proliferation and increased capsase-3 and -9 activities of HCC cells, consistent with studies showing that KIF20A promoted cell proliferation in pancreatic [35], ovarian [36], bladder [37] and lung cancer [38]; caspase-3 and -9 are two key mediators in the apoptotic signaling pathways, and our results may imply that KIF20A knockdown repressed HCC cell proliferation cells via enhancing activities of cell apoptotic signaling pathway. Actions of KIF20A in the chemo-sensitivity of cancer cells have not been reported. In the CRC, the IC50 values of 5-FU and oxaliplatin were elevated in cells with KIF20A overexpression and decreased with KIF20A silence [39]. In ovarian cancer, KIF20A overexpression conferred epithelial ovarian cancer cells resistance to cisplatin [36]. Consistently, our results showed that knockdown of KIF20A enhanced HCC cell chemosensitivity to cisplatin and sorafenib. Collectively, our results suggested that high expression of KIF02A may confer chemoresistance in HCC, which may lead to poor prognosis of HCC patients.
In this study, in vitro functional studies of KIF20A were still limited in the preliminary stage, and further studies may explore down-stream targets of KIF20A in the HCC cells, which may advance our understanding into the role of KIF20A in the HCC development. In addition, in vivo studies by investigating the effects of KIF20A on HCC progression are warranted in the future studies. Moreover, other hub gene expect KIF20A are still worthy of further investigation, in order to further decipher HCC pathophysiology.
In conclusion, this study identified 177 common DEGs among 5 GEO microarray datasets, and found that 10 hub genes (AURKA, CCNA2, CDC20, FOXM1, HMMR, KIF20A, PTTG1, TOP2A, TPX2 and TRIP13) could predict the poor prognosis of HCC patients using comprehensive bioinformatics analysis. Our studies for the first time demonstrated that KIF20A silence suppressed cell proliferation and potentiated chemosensitivity to cisplatin and sorafenib in HCC cells. Further studies may be undertaken to decipher the mechanistic role of these hub genes in HCC progression.
Materials and Methods
Microarray datasets
Five microarray datasets (GSE84598, GSE87630, GSE101685, GSE101728 and GSE121248) analyzed the present study were downloaded from GEO database. In the GSE84598 dataset, the GPL10558 platform was used, and 22 normal liver tissues and 22 HCC tissues were included for analysis. In the GSE87630 dataset, the GPL6947 platform was used, and 30 normal liver tissues and 64 HCC tissues were included for analysis. In the GSE101685 dataset, the GPL570 platform was used, and 8 normal liver tissues and 24 HCC tissues were included for analysis. In the GSE101728 dataset, the GPL21047 platform was used, and 7 normal liver tissues and 7 HCC tissues were included for analysis. In the GSE121248 dataset, the GPL570 platform was used, and 37 normal tissues and 70 HCC tissues were included for analysis.
Screening of the DEGs
DEGs between normal liver tissues and HCC tissues in the collected datasets were analyzed using the GEO2R tool (https://www.ncbi.nlm.nih.gov/geo/geo2r/), which is an online tool for extracting DEGs. The significant DEGs were screened using the following criteria: up-regulated DEGs have an adjusted P-value < 0.05 and log2 fold change (logFC) > 1; down-regulated DEGs have an adjusted P-value < 0.05 and logFC < -1. The common DEGs among different datasets were presented by the Venn diagrams.
Functional enrichment analysis
GO and Kyoto Encyclopedia of Genes and Genomes (KEGG) pathway enrichment analysis of the common DEGs was analysed using the g:Profiler tool [40]. GO terms including biological processes, cellular component and molecular function (P < 0.05 was considered significant enrichment). KEGG is a database resource for revealing high-level functions and effects of the biological pathways. The KEGG pathways with a p value < 0.05 were considered significant enrichment.
PPI and the module analysis
PPI network was constructed using the STRING database [41], which provides uniquely comprehensive coverage of, and ease of access to experimental and predicted interaction information. A combined score of 0.7 was set as the confidential threshold. Furthermore, the module analysis was performed using the MCODE plugin embedded in the Cytoscape software. The parameters for module analysis using MCODE were as follow: degree cutoff = 2, node score cutoff = 0.2, k-core = 2, and max depth = 100.
Expression and survival analysis of hub genes
The mRNA expression of hub genes was analyzed using the GEPIA and UALCAN databases. The correlation between expression levels of hub genes and the overall survival (OS) of patients with HCC was analyzed using the KM plotter and UALCAN analysis; the correlation between expression levels of hub genes and the DFS of patients with HCC was analyzed using KM plotter. GEPIA is a web-based tool established for customized investigation of genomic functionalities based on the resources provided by TCGA and the genotype-tissue expression (GTEx) projects; UALCAN database is a portal for facilitating tumor gene expression and survival analyses; KM plotter is a web tool containing Gene expression data and relapse-free and overall survival information derived from the GEO (Affymetrix microarrays only), RNA-sequencing databases, which integrates gene expression and clinical data simultaneously via a PostgreSQL server.
Cell lines and cell culture
The normal liver cell line (LO2) and the HCC cell lines (HepG2 and SK-Hep1) were obtained from the Chinese Type Culture Collection of the Chinese Academy of Sciences (Shanghai, China). The LO2 cells and SK-Hep1 were cultured in RPMI 1640 medium (Gibco, Waltham, CA, USA) supplemented with 10% heat-inactivated fetal bovine serum (FBS; Gibco); the HepG2 cells were culture in DMEM (Gibco) supplemented with 10% heat-inactivated FBS. All the cells were maintained in a humidified chamber with 5% CO2 at 37° C.
Small interfering RNA (siRNA) transfection and drug treatments in HCC cells
The siRNA designed for silencing KIF20A was purchased from BiboBio (Guangzhou, China). The siRNA sequence for KIF20A was: 5’-GGUGUGAGUAAGCCAGUAU-3’ and the scrambled siRNA was served as the siRNA negative control (si-NC). For the siRNA transfections, cell transfections were done by using the Lipofectamine 3000 reagent (Invitrogen, Carlsbad, CA, USA). The chemicals including cisplatin and sorafenib were purchased from Sigma-Aldrich (St. Louis, MO, USA). For the cisplatin and sorafenib treatment, HCC cells were seeded onto the 96-well plates and were treated with different concentrations of cisplatin or sorafenib for 48 h.
Quantitative real-time PCR analysis
Total RNA from LO2, HepG2 and SK-Hep1 cells was purified using the TRIzol reagent (Invitrogen). Total RNA was transcribed into cDNA using M-MLV reverse transcriptase (Promega, Madison, USA). The synthetized cDNA was subjected to real-time PCR analysis using the SYBR Green Master Mix kit (Takara, Dalian, China) on an ABI7900 Biosystems (Applied Biosystems, Foster City, CA, USA). The relative mRNA expression of KIF20A was normalized to housekeep gene, GAPDH. The expression level of KIF20A was calculated using the comparative threshold cycle method.
MTS proliferation assay
Cell proliferation of HCC cells was evaluated using the MTS cell proliferation assay kit (Beyotime). Briefly, after different treatments, HCC cells were seeded in 96-well plate for indicated time durations, and cell proliferation was detected using the MTS proliferation assay kit. Three independent assays were repeated.
Caspase-3 and caspase-9 activities analysis
The caspase-3 and -9 activities of HCC cells after transfecting with si-NC or si-KIF20A were measured by the commercial caspase-3 and caspase-9 activity assay kits, respectively by following the manufacturer’s protocol. The caspase-3 and caspase-9 assay kits were purchased from Beyotime (Beijing, China).
Statistical analysis
The in vitro data were presented as mean ± standard deviation (SD). The data analysis for the in vitro experiments was performed using the GraphPad Prism Software (Version 6.0; GraphPad Software, La Jolla, CA, USA). Significant differences between treatment groups were analysed using unpaired Student’s t-test or one-way analysis of variance followed by Bonferroni’s post-hoc tests. P < 0.05 was considered statistically significant.
Data availability statement
All the data are available upon reasonable request from the reviewer.
Supplementary Materials
Author Contributions
CW and LZ designed the whole study, wrote and revised the manuscript; CW, XQ and ZQ performed the experiments; CW, ZQ and GD analysed the data; all the authors approved the manuscript for submission.
Conflicts of Interest
The authors declare that they have no conflicts of interest.
Funding
This study was supported by Key Project of Songjiang Science and Technology in Shanghai (2020SJ293).
Editorial Note
This corresponding author has a verified history of publications using a personal email address for correspondence
References
- 1. Bruix J, Han KH, Gores G, Llovet JM, Mazzaferro V. Liver cancer: Approaching a personalized care. J Hepatol. 2015; 62:S144–56. https://doi.org/10.1016/j.jhep.2015.02.007 [PubMed]
- 2. Zheng R, Qu C, Zhang S, Zeng H, Sun K, Gu X, Xia C, Yang Z, Li H, Wei W, Chen W, He J. Liver cancer incidence and mortality in China: Temporal trends and projections to 2030. Chin J Cancer Res. 2018; 30:571–79. https://doi.org/10.21147/j.issn.1000-9604.2018.06.01 [PubMed]
- 3. Llovet JM, Zucman-Rossi J, Pikarsky E, Sangro B, Schwartz M, Sherman M, Gores G. Hepatocellular carcinoma. Nat Rev Dis Primers. 2016; 2:16018. https://doi.org/10.1038/nrdp.2016.18 [PubMed]
- 4. Calderaro J, Ziol M, Paradis V, Zucman-Rossi J. Molecular and histological correlations in liver cancer. J Hepatol. 2019; 71:616–30. https://doi.org/10.1016/j.jhep.2019.06.001 [PubMed]
- 5. Liu XN, Cui DN, Li YF, Liu YH, Liu G, Liu L. Multiple “Omics” data-based biomarker screening for hepatocellular carcinoma diagnosis. World J Gastroenterol. 2019; 25:4199–212. https://doi.org/10.3748/wjg.v25.i30.4199 [PubMed]
- 6. Nault JC, Martin Y, Caruso S, Hirsch TZ, Bayard Q, Calderaro J, Charpy C, Copie-Bergman C, Ziol M, Bioulac-Sage P, Couchy G, Blanc JF, Nahon P, et al. Clinical Impact of Genomic Diversity From Early to Advanced Hepatocellular Carcinoma. Hepatology. 2020; 71:164–82. https://doi.org/10.1002/hep.30811 [PubMed]
- 7. Li C, Xu J. Identification of Potentially Therapeutic Target Genes of Hepatocellular Carcinoma. Int J Environ Res Public Health. 2020; 17:1053. https://doi.org/10.3390/ijerph17031053 [PubMed]
- 8. Zhang Q, Sun S, Zhu C, Zheng Y, Cai Q, Liang X, Xie H, Zhou J. Prediction and analysis of weighted genes in hepatocellular carcinoma using bioinformatics analysis. Mol Med Rep. 2019; 19:2479–88. https://doi.org/10.3892/mmr.2019.9929 [PubMed]
- 9. Li L, Lei Q, Zhang S, Kong L, Qin B. Screening and identification of key biomarkers in hepatocellular carcinoma: Evidence from bioinformatic analysis. Oncol Rep. 2017; 38:2607–18. https://doi.org/10.3892/or.2017.5946 [PubMed]
- 10. Zhang R, Ye J, Huang H, Du X. Mining featured biomarkers associated with vascular invasion in HCC by bioinformatics analysis with TCGA RNA sequencing data. Biomed Pharmacother. 2019; 118:109274. https://doi.org/10.1016/j.biopha.2019.109274 [PubMed]
- 11. Xiao Y, Najeeb RM, Ma D, Yang K, Zhong Q, Liu Q. Upregulation of CENPM promotes hepatocarcinogenesis through mutiple mechanisms. J Exp Clin Cancer Res. 2019; 38:458. https://doi.org/10.1186/s13046-019-1444-0 [PubMed]
- 12. Tang Z, Li C, Kang B, Gao G, Li C, Zhang Z. GEPIA: a web server for cancer and normal gene expression profiling and interactive analyses. Nucleic Acids Res. 2017; 45:W98–102. https://doi.org/10.1093/nar/gkx247 [PubMed]
- 13. Chandrashekar DS, Bashel B, Balasubramanya SA, Creighton CJ, Ponce-Rodriguez I, Chakravarthi BV, Varambally S. UALCAN: A Portal for Facilitating Tumor Subgroup Gene Expression and Survival Analyses. Neoplasia. 2017; 19:649–58. https://doi.org/10.1016/j.neo.2017.05.002 [PubMed]
- 14. Nagy Á, Lánczky A, Menyhárt O, Győrffy B. Validation of miRNA prognostic power in hepatocellular carcinoma using expression data of independent datasets. Sci Rep. 2018; 8:9227. https://doi.org/10.1038/s41598-018-27521-y [PubMed]
- 15. Bai L, Ren Y, Cui T. Overexpression of CDCA5, KIF4A, TPX2, and FOXM1 Coregulated Cell Cycle and Promoted Hepatocellular Carcinoma Development. J Comput Biol. 2020; 27:965–74. https://doi.org/10.1089/cmb.2019.0254 [PubMed]
- 16. Liang B, Jia C, Huang Y, He H, Li J, Liao H, Liu X, Liu X, Bai X, Yang D. TPX2 Level Correlates with Hepatocellular Carcinoma Cell Proliferation, Apoptosis, and EMT. Dig Dis Sci. 2015; 60:2360–72. https://doi.org/10.1007/s10620-015-3730-9 [PubMed]
- 17. Chen C, Song G, Xiang J, Zhang H, Zhao S, Zhan Y. AURKA promotes cancer metastasis by regulating epithelial-mesenchymal transition and cancer stem cell properties in hepatocellular carcinoma. Biochem Biophys Res Commun. 2017; 486:514–20. https://doi.org/10.1016/j.bbrc.2017.03.075 [PubMed]
- 18. Xie W, Wang B, Wang X, Hou D, Su H, Huang H. Nine hub genes related to the prognosis of HBV-positive hepatocellular carcinoma identified by protein interaction analysis. Ann Transl Med. 2020; 8:478. https://doi.org/10.21037/atm.2020.03.94 [PubMed]
- 19. Gopinathan L, Tan SL, Padmakumar VC, Coppola V, Tessarollo L, Kaldis P. Loss of Cdk2 and cyclin A2 impairs cell proliferation and tumorigenesis. Cancer Res. 2014; 74:3870–79. https://doi.org/10.1158/0008-5472.CAN-13-3440 [PubMed]
- 20. Bayard Q, Meunier L, Peneau C, Renault V, Shinde J, Nault JC, Mami I, Couchy G, Amaddeo G, Tubacher E, Bacq D, Meyer V, La Bella T, et al. Cyclin A2/E1 activation defines a hepatocellular carcinoma subclass with a rearrangement signature of replication stress. Nat Commun. 2018; 9:5235. https://doi.org/10.1038/s41467-018-07552-9 [PubMed]
- 21. Li J, Gao JZ, Du JL, Huang ZX, Wei LX. Increased CDC20 expression is associated with development and progression of hepatocellular carcinoma. Int J Oncol. 2014; 45:1547–55. https://doi.org/10.3892/ijo.2014.2559 [PubMed]
- 22. Zhuang L, Yang Z, Meng Z. Upregulation of BUB1B, CCNB1, CDC7, CDC20, and MCM3 in Tumor Tissues Predicted Worse Overall Survival and Disease-Free Survival in Hepatocellular Carcinoma Patients. Biomed Res Int. 2018; 2018:7897346. https://doi.org/10.1155/2018/7897346 [PubMed]
- 23. Panvichian R, Tantiwetrueangdet A, Angkathunyakul N, Leelaudomlipi S. TOP2A amplification and overexpression in hepatocellular carcinoma tissues. Biomed Res Int. 2015; 2015:381602. https://doi.org/10.1155/2015/381602 [PubMed]
- 24. Wong N, Yeo W, Wong WL, Wong NL, Chan KY, Mo FK, Koh J, Chan SL, Chan AT, Lai PB, Ching AK, Tong JH, Ng HK, et al. TOP2A overexpression in hepatocellular carcinoma correlates with early age onset, shorter patients survival and chemoresistance. Int J Cancer. 2009; 124:644–52. https://doi.org/10.1002/ijc.23968 [PubMed]
- 25. Hu G, Yan Z, Zhang C, Cheng M, Yan Y, Wang Y, Deng L, Lu Q, Luo S. FOXM1 promotes hepatocellular carcinoma progression by regulating KIF4A expression. J Exp Clin Cancer Res. 2019; 38:188. https://doi.org/10.1186/s13046-019-1202-3 [PubMed]
- 26. Zhu MX, Wei CY, Zhang PF, Gao DM, Chen J, Zhao Y, Dong SS, Liu BB. Elevated TRIP13 drives the AKT/mTOR pathway to induce the progression of hepatocellular carcinoma via interacting with ACTN4. J Exp Clin Cancer Res. 2019; 38:409. https://doi.org/10.1186/s13046-019-1401-y [PubMed]
- 27. Blanco I, Kuchenbaecker K, Cuadras D, Wang X, Barrowdale D, de Garibay GR, Librado P, Sánchez-Gracia A, Rozas J, Bonifaci N, McGuffog L, Pankratz VS, Islam A, et al, and Teixeira, and BCFR, and SWE-BRCA, and kConFab Investigators, and GEMO. Assessing associations between the AURKA-HMMR-TPX2-TUBG1 functional module and breast cancer risk in BRCA1/2 mutation carriers. PLoS One. 2015; 10:e0120020. https://doi.org/10.1371/journal.pone.0120020 [PubMed]
- 28. Kang HG, Kim WJ, Kang HG, Chun KH, Kim SJ. Galectin-3 Interacts with C/EBPβ and Upregulates Hyaluronan-Mediated Motility Receptor Expression in Gastric Cancer. Mol Cancer Res. 2020; 18:403–13. https://doi.org/10.1158/1541-7786.MCR-19-0811 [PubMed]
- 29. Wang Y, Chen L, Ju L, Qian K, Liu X, Wang X, Xiao Y. Novel Biomarkers Associated With Progression and Prognosis of Bladder Cancer Identified by Co-expression Analysis. Front Oncol. 2019; 9:1030. https://doi.org/10.3389/fonc.2019.01030 [PubMed]
- 30. Lu D, Bai X, Zou Q, Gan Z, Lv Y. Identification of the association between HMMR expression and progression of hepatocellular carcinoma via construction of a co-expression network. Oncol Lett. 2020; 20:2645–54. https://doi.org/10.3892/ol.2020.11844 [PubMed]
- 31. Gasnereau I, Boissan M, Margall-Ducos G, Couchy G, Wendum D, Bourgain-Guglielmetti F, Desdouets C, Lacombe ML, Zucman-Rossi J, Sobczak-Thépot J. KIF20A mRNA and its product MKlp2 are increased during hepatocyte proliferation and hepatocarcinogenesis. Am J Pathol. 2012; 180:131–40. https://doi.org/10.1016/j.ajpath.2011.09.040 [PubMed]
- 32. Shi C, Huang D, Lu N, Chen D, Zhang M, Yan Y, Deng L, Lu Q, Lu H, Luo S. Aberrantly activated Gli2-KIF20A axis is crucial for growth of hepatocellular carcinoma and predicts poor prognosis. Oncotarget. 2016; 7:26206–19. https://doi.org/10.18632/oncotarget.8441 [PubMed]
- 33. Li X, Huang W, Huang W, Wei T, Zhu W, Chen G, Zhang J. Kinesin family members KIF2C/4A/10/11/14/18B/20A/23 predict poor prognosis and promote cell proliferation in hepatocellular carcinoma. Am J Transl Res. 2020; 12:1614–39. [PubMed]
- 34. Lu M, Huang X, Chen Y, Fu Y, Xu C, Xiang W, Li C, Zhang S, Yu C. Aberrant KIF20A expression might independently predict poor overall survival and recurrence-free survival of hepatocellular carcinoma. IUBMB Life. 2018; 70:328–35. https://doi.org/10.1002/iub.1726 [PubMed]
- 35. Stangel D, Erkan M, Buchholz M, Gress T, Michalski C, Raulefs S, Friess H, Kleeff J. Kif20a inhibition reduces migration and invasion of pancreatic cancer cells. J Surg Res. 2015; 197:91–100. https://doi.org/10.1016/j.jss.2015.03.070 [PubMed]
- 36. Li H, Zhang W, Sun X, Chen J, Li Y, Niu C, Xu B, Zhang Y. Overexpression of kinesin family member 20A is associated with unfavorable clinical outcome and tumor progression in epithelial ovarian cancer. Cancer Manag Res. 2018; 10:3433–50. https://doi.org/10.2147/CMAR.S169214 [PubMed]
- 37. Shen T, Yang L, Zhang Z, Yu J, Dai L, Gao M, Shang Z, Niu Y. KIF20A Affects the Prognosis of Bladder Cancer by Promoting the Proliferation and Metastasis of Bladder Cancer Cells. Dis Markers. 2019; 2019:4863182. https://doi.org/10.1155/2019/4863182 [PubMed]
- 38. Xie F, He C, Gao S, Yang Z, Li L, Qiao L, Fang L. KIF20A silence inhibits the migration, invasion and proliferation of non-small cell lung cancer and regulates the JNK pathway. Clin Exp Pharmacol Physiol. 2020; 47:135–42. https://doi.org/10.1111/1440-1681.13183 [PubMed]
- 39. Xiong M, Zhuang K, Luo Y, Lai Q, Luo X, Fang Y, Zhang Y, Li A, Liu S. KIF20A promotes cellular malignant behavior and enhances resistance to chemotherapy in colorectal cancer through regulation of the JAK/STAT3 signaling pathway. Aging (Albany NY). 2019; 11:11905–21. https://doi.org/10.18632/aging.102505 [PubMed]
- 40. Raudvere U, Kolberg L, Kuzmin I, Arak T, Adler P, Peterson H, Vilo J. g:Profiler: a web server for functional enrichment analysis and conversions of gene lists (2019 update). Nucleic Acids Res. 2019; 47:W191–98. https://doi.org/10.1093/nar/gkz369 [PubMed]
- 41. Szklarczyk D, Gable AL, Lyon D, Junge A, Wyder S, Huerta-Cepas J, Simonovic M, Doncheva NT, Morris JH, Bork P, Jensen LJ, Mering CV. STRING v11: protein-protein association networks with increased coverage, supporting functional discovery in genome-wide experimental datasets. Nucleic Acids Res. 2019; 47:D607–13. https://doi.org/10.1093/nar/gky1131 [PubMed]