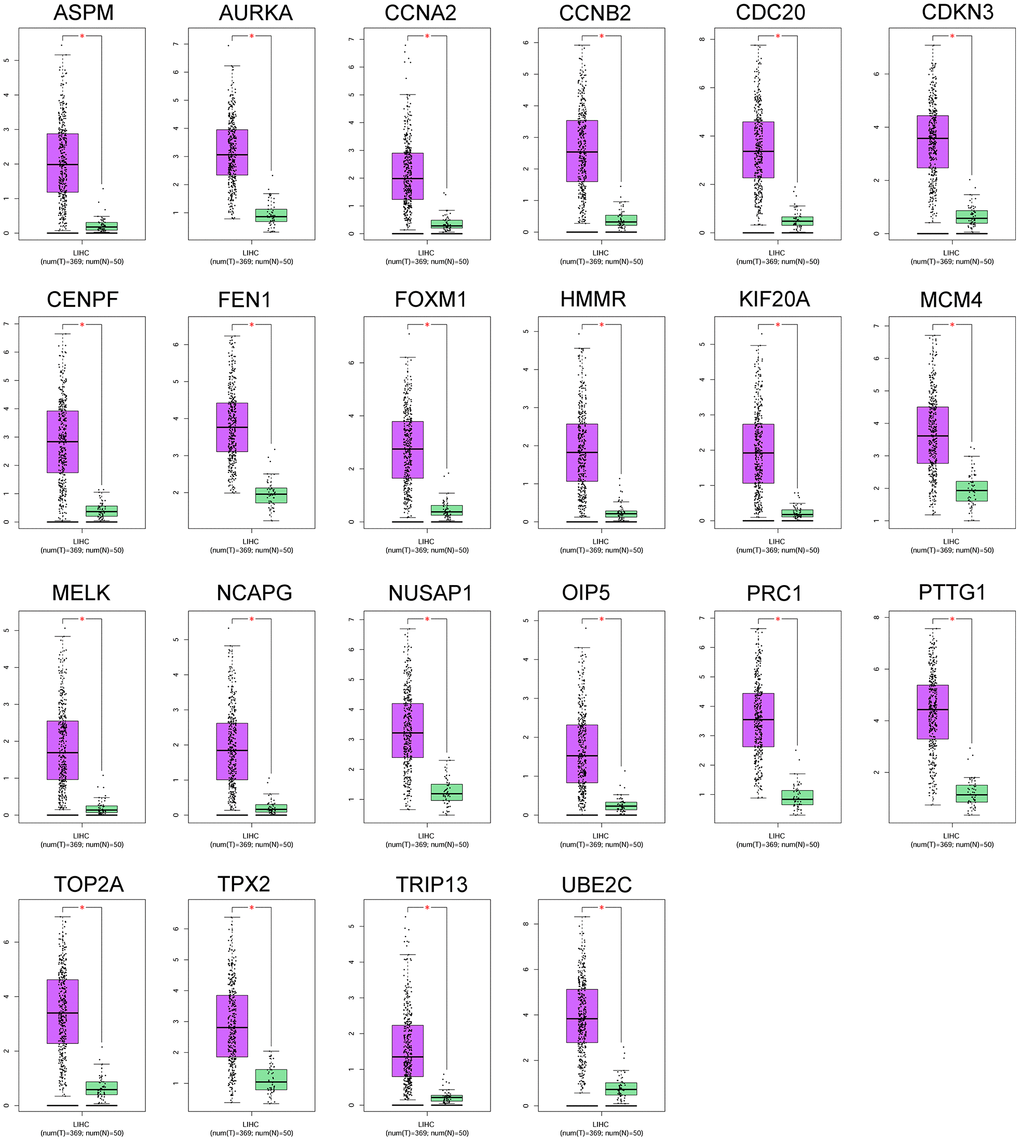
Figure 3.The mRNA expression of 22 hub genes between normal liver tissues and HCC tissues was analyzed by the GEPIA tool. The genes including ASPM, AURKA, CCNA2, CCBN2, CDC20, CDKN3, CENPF, FEN1, FOXM1, HMMR, KIF20A, MCM4, MELK, NCAPG, NUSAP1, OIP5, PRC1, PTTG1, TOP2A, TPX2, TRIP13 and UBE2C were analyzed. N = normal liver tissue group (n = 50); T = HCC tissues group (n = 369); *P<0.05.