


Introduction
Age is the main risk factor for neurodegeneration in the central nervous system (CNS) and concomitant cognitive and functional impairments. Cerebral blood flow (CBF), the rate of arterial blood flow through the capillary bed in cerebral tissue, is the main determinant of oxygen and substrate delivery as well as clearance of metabolic by-products. Several lines of research suggest that CBF is a critical biomarker affected by normal aging as well as a myriad of neurodegenerative diseases [1]. Indeed, mounting evidence suggests that perfusion plays an important role in the progression of many neurodegenerative processes, including Alzheimer’s disease [2]. Therefore, changes in CBF with age may be causally linked to age-associated pathology. Characterizing the changes in CBF that occur with normal aging in the absence of clinically detectable pathology is of further importance to distinguish this from specific pathologic effects.
CBF is conventionally measured using techniques such as positron-emission tomography, single-photon emission computerized tomography, or computed tomography. These methods require injection of contrast agents or radioactive tracers which require exposure to ionizing radiation or may cause nephrotoxicity. However, arterial spin labeling (ASL) magnetic resonance imaging (MRI) techniques permit whole-brain CBF mapping within a few minutes. Briefly, ASL makes use of magnetic labeling of arterial water protons by radiofrequency pulses [3], upstream of the volume of interest. It is a difference technique, requiring subtraction of a labeled image from a control, non-labeled, image. The difference between these two images corresponds to the effect of the labeling procedure, resulting in a perfusion-weighted image that can be combined with an additional proton density-weighted image to derive a CBF map [4].
ASL has been widely used to investigate CBF in various neurological disorders and to characterize age- and sex-effects. While there is consistent evidence for an overall decrease in CBF with age, conclusions have been mixed regarding the effects of age and sex on regional CBF. Indeed, while some studies have shown that cortical CBF decreases with age, other investigations have indicated the opposite trend or found no correlation with age [5–13]. Further, Parkes and colleagues [14] have shown that WM CBF increases with age using continuous ASL, while Liu and colleagues’ study suggested that WM CBF decreases with age in women using pseudo-continuous ASL (pCASL) [8]. These discrepancies are likely due to limited cohort sizes as well as the technical challenges of implementing truly quantitative CBF determination using ASL. In addition, most previous studies focused on brain GM, with little information available regarding CBF in cerebral WM. This is likely due to the lower CBF values in WM along with the high sensitivity to noise of CBF values derived from ASL especially given that it is a subtraction technique for an effect of limited dynamic range. With the development of new postprocessing analysis techniques, including the nonlocal estimation of multispectral magnitudes (NESMA)-ASL filter [15], more accurate analysis of CBF in WM has become feasible.
Our main goal in the present work is to characterize the dependence of regional CBF on age and sex in critical GM and WM brain regions, and to provide reference CBF values using the standardized ASL protocol recommended by the ISMRM Perfusion Study Group and the European ASL in Dementia consortium [4]. Our investigation was conducted on a cohort (N = 80) of cognitively unimpaired participants spanning the wide age range of 22 to 88 years.
Results
Visualization of cerebral blood flow maps at different ages
Figure 1 shows a representative axial slice of derived CBF maps from brains of male and female participants within each age decade of our cohort. CBF maps derived with (first row) or without (second row) NESMA filtering of the ASL images are displayed. It is readily seen that, as expected, NESMA substantially reduces random variation in derived CBF maps. Further, visual inspection indicates that CBF varies with age, with the most pronounced variations occurring in the GM regions; this is clearly visible from the CBF maps derived after NESMA filtering. It is also observed that older participants have lower GM CBF as compared to young participants within the third, fourth, and fifth age decades. However, CBF varies minimally with age in the WM regions.
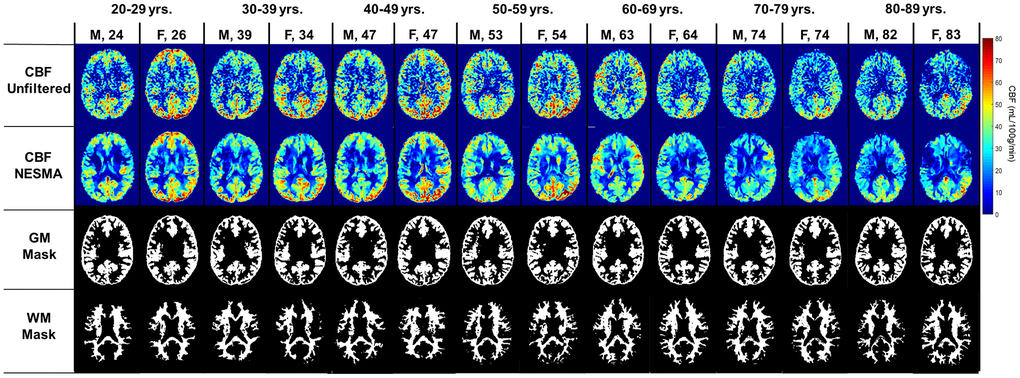
Figure 1. Cerebral blood flow (CBF) maps derived from pCASL imaging datasets with or without the NESMA-ASL filter. Corresponding GM and WM masks generated using FSL-FASL are also displayed. Results are shown for fourteen representative male and female participants within each age decade.
Effects of age and sex on CBF
Figure 2 shows linear relationships between CBF measurements using NESMA-filtered ASL images and age in the GM ROIs for men and women separately, and for all participants taken together. GM CBF was found to decrease with age, with regional variation among regions (Figure 2). Statistical analysis of all participants showed that all brain structures exhibited significant (p < 0.05) decreases of CBF with age except for the GM within the parietal lobes (Table 1). In addition, the most rapid decline in CBF with respect to age was found in the frontal lobes, while the slowest decline was in the temporal lobes (Table 1). For all GM ROIs, women exhibited significantly higher CBF values as compared to men (Figure 3). For women, all GM ROIs showed significant decreases in CBF with age (Table 2). For men, the frontal lobes showed significant decreases with respect to age, while the whole brain showed a non-significant trend towards a decrease in CBF with age (Table 2). Furthermore, women exhibited steeper slopes in the decline in CBF with age as compared to men for all GM ROIs with, for both men and women, the frontal lobes exhibiting the steepest decline. The rate with respect to age for the decline in CBF for women was found to be significantly different from the rate for men in the cerebellum, the whole brain, and the occipital and temporal lobes. We note that the interactions between age and sex were not significant in any ROI after FDR correction. Finally, although qualitative CBF results derived from NESMA-filtered and from unfiltered ASL images were similar in GM regions, the finding of a significant dependence on age was greatly strengthened with NESMA filtering in several brain structures including the occipital and parietal lobes, and the cerebellum (Table 1). This is consistent with the effect of the NESMA filter to decrease image noise, and hence variance of parameter estimation [15].
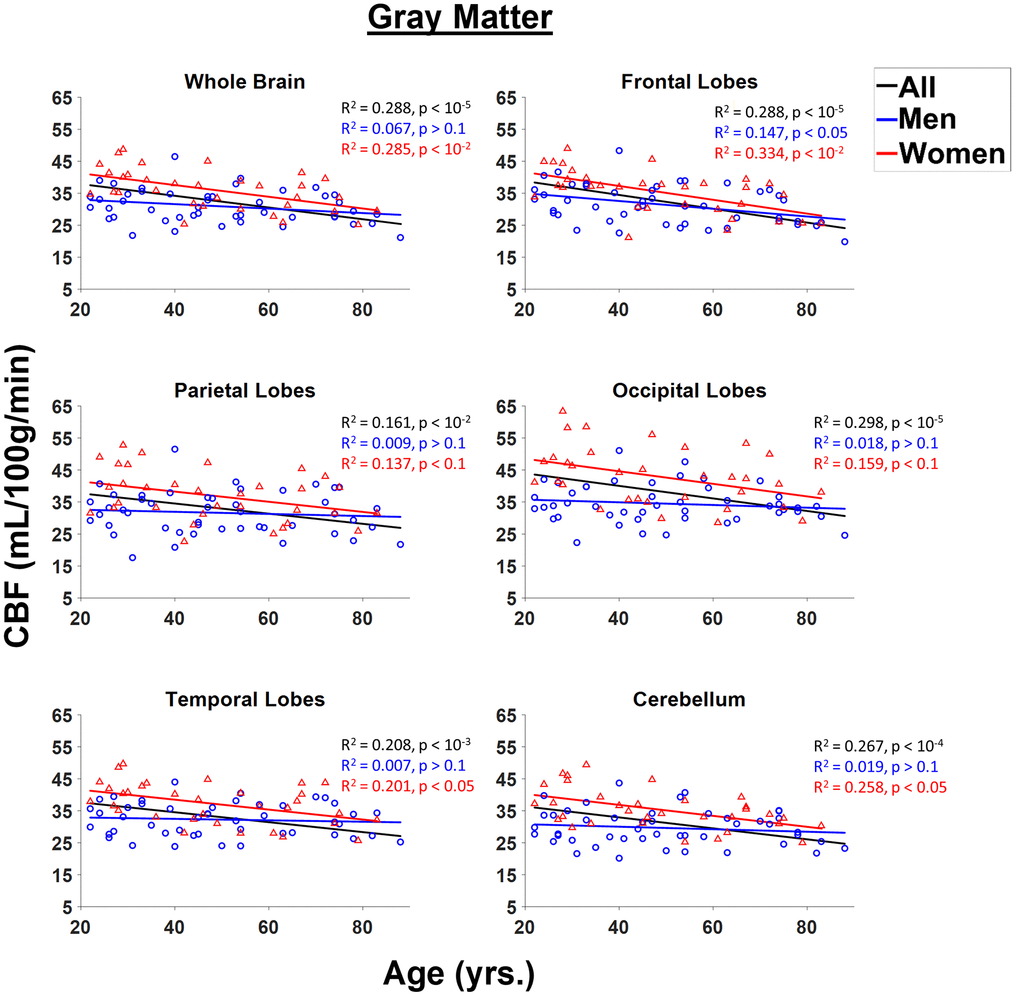
Figure 2. Regressions of NESMA-CBF with age and sex shown for the six gray matter (GM) regions investigated. For each structure, the coefficient of determination, R2, and p-value, obtained after FDR correction, are reported. Most regions investigated showed linearly decreasing CBF with age.
Table 1. Significance (p-value) and slope of the variation in CBF as a function of age and sex for the linear regression analysis for each GM and WM brain region studied.
| NESMA filtered | Unfiltered | ||||||||||||||||||||||||||||||||||||||||||||||||||||||||||||||||||||||||||||||||||||||||||||||||||
| Gray matter (GM) | White matter (WM) | Gray matter (GM) | White matter (WM) | ||||||||||||||||||||||||||||||||||||||||||||||||||||||||||||||||||||||||||||||||||||||||||||||||
| Age | Sex | Age | Sex | Age | Sex | Age | Sex | ||||||||||||||||||||||||||||||||||||||||||||||||||||||||||||||||||||||||||||||||||||||||||||
| p-value | Slope | p-value | Slope | p-value | Slope | p-value | Slope | p-value | Slope | p-value | Slope | p-value | Slope | p-value | Slope | ||||||||||||||||||||||||||||||||||||||||||||||||||||||||||||||||||||||||||||||||||||
| Whole Brain | < 0.01 | -0.11 | < 0.01 | -4.95 | < 0.01 | 0.08 | < 0.05 | -1.90 | < 0.01 | -0.11 | < 0.01 | -4.92 | < 0.01 | 0.07 | < 0.1 | -1.41 | |||||||||||||||||||||||||||||||||||||||||||||||||||||||||||||||||||||||||||||||||||
| Frontal Lobes | < 0.01 | -0.16 | < 0.01 | -3.85 | < 0.05 | 0.04 | < 0.05 | -1.44 | < 0.01 | -0.15 | < 0.01 | -3.85 | < 0.05 | 0.02 | > 0.1 | -1.04 | |||||||||||||||||||||||||||||||||||||||||||||||||||||||||||||||||||||||||||||||||||
| Occipital Lobes | < 0.05 | -0.10 | < 0.01 | -8.32 | < 0.01 | 0.06 | < 0.01 | -2.56 | < 0.1 | -0.10 | < 0.01 | -8.35 | < 0.01 | 0.04 | < 0.01 | -1.96 | |||||||||||||||||||||||||||||||||||||||||||||||||||||||||||||||||||||||||||||||||||
| Parietal Lobes | < 0.1 | -0.08 | < 0.01 | -5.20 | < 0.01 | 0.06 | < 0.05 | -1.66 | > 0.1 | -0.08 | < 0.01 | -5.32 | < 0.05 | 0.04 | < 0.05 | -1.20 | |||||||||||||||||||||||||||||||||||||||||||||||||||||||||||||||||||||||||||||||||||
| Temporal lobes | < 0.05 | -0.07 | < 0.01 | -4.82 | < 0.01 | 0.05 | < 0.01 | -1.84 | < 0.05 | -0.07 | < 0.01 | -4.82 | < 0.05 | 0.03 | < 0.01 | -1.34 | |||||||||||||||||||||||||||||||||||||||||||||||||||||||||||||||||||||||||||||||||||
| Cerebellum | < 0.05 | -0.09 | < 0.01 | -5.64 | < 0.05 | 0.04 | < 0.01 | -2.12 | < 0.1 | -0.10 | < 0.01 | -5.38 | < 0.05 | 0.02 | < 0.01 | -1.85 | |||||||||||||||||||||||||||||||||||||||||||||||||||||||||||||||||||||||||||||||||||
| All p-values presented are obtained after FDR correction. Results are shown for both CBF maps derived with or without the NESMA filtering of the ASL images. | |||||||||||||||||||||||||||||||||||||||||||||||||||||||||||||||||||||||||||||||||||||||||||||||||||
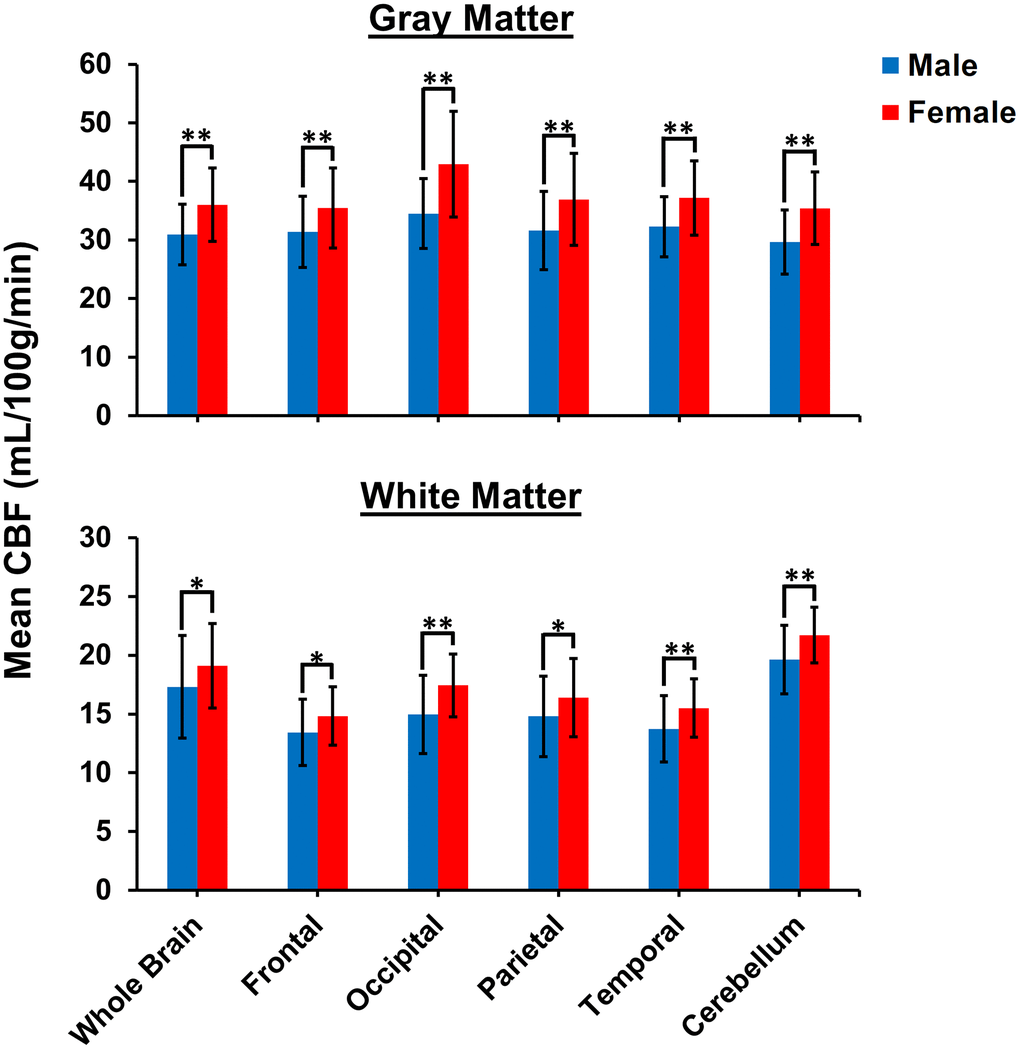
Figure 3. Comparison of mean CBF values obtained from NESMA-filtered ASL images for men and women in the indicated GM and WM regions. Mean CBF values for women are overall significantly greater than mean CBF values for men.
Table 2. Significance (p-value) and slope of the variation in NESMA-CBF as a function of age and sex for the GM and WM regions studied, for men and for women.
| Men | Women | ||||||||||||||||||||||||||||||||||||||||||||||||||||||||||||||||||||||||||||||||||||||||||||||||||
| GM | WM | GM | WM | ||||||||||||||||||||||||||||||||||||||||||||||||||||||||||||||||||||||||||||||||||||||||||||||||
| p-value | Slope | p-value | Slope | p-value | Slope | p-value | Slope | ||||||||||||||||||||||||||||||||||||||||||||||||||||||||||||||||||||||||||||||||||||||||||||
| Whole Brain | < 0.1 | -0.07 | < 0.01 | 0.11 | < 0.01 | -0.18 | > 0.1 | 0.05 | |||||||||||||||||||||||||||||||||||||||||||||||||||||||||||||||||||||||||||||||||||||||||||
| Frontal Lobes | < 0.01 | -0.12 | < 0.05 | 0.05 | < 0.01 | -0.21 | > 0.1 | 0.03 | |||||||||||||||||||||||||||||||||||||||||||||||||||||||||||||||||||||||||||||||||||||||||||
| Occipital Lobes | > 0.1 | -0.04 | < 0.05 | 0.06 | < 0.05 | -0.20 | < 0.1 | 0.05 | |||||||||||||||||||||||||||||||||||||||||||||||||||||||||||||||||||||||||||||||||||||||||||
| Parietal Lobes | > 0.1 | -0.03 | < 0.01 | 0.07 | < 0.05 | -0.16 | > 0.1 | 0.04 | |||||||||||||||||||||||||||||||||||||||||||||||||||||||||||||||||||||||||||||||||||||||||||
| Temporal Lobes | > 0.1 | -0.02 | < 0.01 | 0.05 | < 0.01 | -0.16 | > 0.1 | 0.03 | |||||||||||||||||||||||||||||||||||||||||||||||||||||||||||||||||||||||||||||||||||||||||||
| Cerebellum | > 0.1 | -0.04 | > 0.1 | 0.02 | < 0.01 | -0.17 | < 0.05 | 0.04 | |||||||||||||||||||||||||||||||||||||||||||||||||||||||||||||||||||||||||||||||||||||||||||
| All p-values presented are obtained after FDR correction. | |||||||||||||||||||||||||||||||||||||||||||||||||||||||||||||||||||||||||||||||||||||||||||||||||||
Figure 4 shows linear relationships between CBF measurements using NESMA-filtered ASL images and age in the WM ROIs for men and women separately, and for all participants taken together. WM CBF increased slightly but significantly with age, both for the whole brain and across all examined regions (Figure 4, Table 1). Further, for all WM ROIs, women exhibited significantly higher CBF values as compared to men (Figure 3). Women exhibited a steeper and more statistically significant increase with respect to age in the cerebellum, and a smaller rate of increase with respect to age as compared to men in the occipital lobes that approached significance (Figure 3, Table 2). For men, increases in WM CBF as a function of age were seen in all brain regions investigated except in the cerebellum (Table 2). Furthermore, men exhibited relatively larger rates with respect to age for the decline in CBF as compared to women for all ROIs studied except in the cerebellum. The interactions between age and sex were not significant in all ROIs after FDR correction. Table 3 provides a detailed summary of GM and WM CBF values. Finally, results of CBF derived from NESMA-filtered ASL images as compared to those derived from unfiltered ASL images were substantially different in WM regions. Indeed, the regression coefficients calculated from CBF maps derived from filtered ASL images exhibited, overall, higher values in most WM regions examined (Table 1). Here as well, significance with age was strengthened with NESMA-filtering in most ROIs, including within the parietal lobes and temporal lobes.
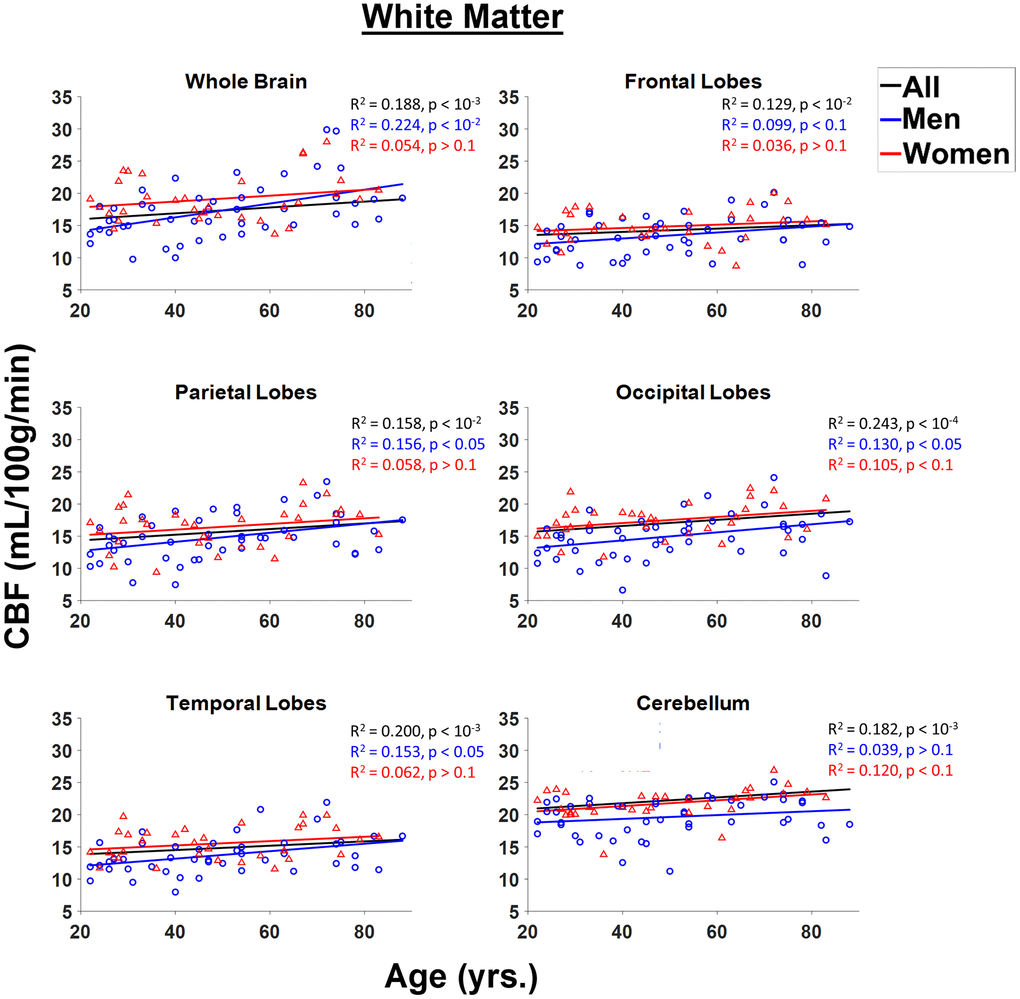
Figure 4. Regressions of CBF values obtained from NESMA-filtered ASL images with age and sex shown for the six white matter (WM) regions investigated. For each structure, the coefficient of determination, R2, and p-value, obtained after FDR correction, are reported. Most regions investigated showed linearly increasing CBF with age. This trend is more pronounced for men (blue) as compared to women (red).
Table 3. The mean and standard deviation (SD) of CBF values, derived from NESMA filtered ASL images, for all participants as well as for men or women, for each ROI and for each age interval as well as across the entire age range.
| Mean ± SD CBF values (mL/100g/min) | ||||||||||
| 20–29 yrs. | 30–39 yrs. | 40–49 yrs. | 50–59 yrs. | 60–69 yrs. | 70–79 yrs. | 80–89 yrs. | All | |||
| All Participants | GM | Whole Brain | 36.4 ± 6.40 | 34.5 ± 6.45 | 32.9 ± 6.39 | 31.9 ± 5.50 | 31.6 ± 5.77 | 31.2 ± 4.58 | 26.1 ± 3.71 | 33.0 ± 6.17 |
| Frontal Lobes | 37.3 ± 6.14 | 34.9 ± 5.76 | 33.7 ± 7.14 | 31.2 ± 6.15 | 30.8 ± 6.05 | 30.6 ± 4.92 | 24.0 ± 2.80 | 33.0 ± 6.66 | ||
| Occipital Lobes | 41.3 ± 9.41 | 39.4 ± 9.92 | 36.9 ± 8.56 | 38.7 ± 8.02 | 36.7 ± 8.26 | 35.7 ± 5.75 | 31.7 ± 5.65 | 37.9 ± 8.43 | ||
| Parietal Lobes | 36.4 ± 7.66 | 35.5 ± 8.85 | 32.9 ± 8.57 | 33.1 ± 5.68 | 31.7 ± 7.74 | 33.5 ± 6.87 | 28.3 ± 5.04 | 33.8 ± 7.59 | ||
| Temporal Lobes | 36.9 ± 6.76 | 35.4 ± 6.10 | 33.5 ± 5.98 | 33.0 ± 6.05 | 33.9 ± 6.28 | 33.3 ± 5.66 | 29.7 ± 4.21 | 34.2 ± 6.14 | ||
| Cerebellum | 35.3 ± 6.82 | 31.7 ± 7.98 | 32.6 ± 6.26 | 30.6 ± 6.74 | 31.5 ± 5.41 | 30.6 ± 3.59 | 25.1 ± 3.71 | 32.0 ± 6.43 | ||
| WM | Whole Brain | 16.6 ± 2.92 | 17.2 ± 4.35 | 16.6 ± 3.10 | 17.3 ± 3.38 | 19.2 ± 4.84 | 22.1 ± 4.97 | 18.7 ± 1.90 | 18.0 ± 4.13 | |
| Frontal Lobes | 12.8 ± 2.25 | 14.3 ± 3.16 | 13.7 ± 2.13 | 13.2 ± 2.55 | 14.6 ± 3.44 | 15.7 ± 3.27 | 14.4 ± 1.36 | 14.0 ± 2.77 | ||
| Occipital Lobes | 15.0 ± 2.67 | 14.7 ± 3.47 | 15.1 ± 3.29 | 16.9 ± 2.59 | 17.4 ± 3.31 | 17.4 ± 3.34 | 16.3 ± 5.19 | 15.9 ± 3.29 | ||
| Parietal Lobes | 14.4 ± 2.94 | 14.4 ± 4.14 | 14.4 ± 3.40 | 15.1 ± 2.32 | 17.4 ± 3.59 | 17.8 ± 3.56 | 15.3 ± 1.91 | 15.4 ± 3.45 | ||
| Temporal Lobes | 13.5 ± 2.32 | 13.8 ± 2.81 | 13.7 ± 2.63 | 14.8 ± 2.97 | 15.1 ± 3.10 | 16.1 ± 3.10 | 15.3 ± 2.58 | 14.4 ± 2.82 | ||
| Cerebellum | 20.8 ± 1.95 | 18.7 ± 2.99 | 19.7 ± 3.00 | 20.0 ± 3.35 | 21.4 ± 2.44 | 22.8 ± 2.26 | 18.8 ± 2.73 | 20.4 ± 2.87 | ||
| Men | GM | Whole Brain | 32.4 ± 4.17 | 31.3 ± 5.58 | 31.6 ± 6.57 | 30.6 ± 5.49 | 29.3 ± 5.92 | 30.9 ± 4.04 | 25.0 ± 3.65 | 30.9 ± 5.18 |
| Frontal Lobes | 33.9 ± 4.84 | 32.6 ± 5.94 | 33.3 ± 7.06 | 29.7 ± 6.34 | 29.8 ± 7.41 | 30.4 ± 4.65 | 23.5 ± 3.23 | 31.3 ± 6.05 | ||
| Occipital Lobes | 34.9 ± 4.29 | 35.1 ± 6.79 | 34.3 ± 7.87 | 36.8 ± 7.6 | 31.1 ± 3.76 | 34.4 ± 3.27 | 29.5 ± 4.59 | 34.5 ± 5.95 | ||
| Parietal Lobes | 32.3 ± 4.91 | 31.6 ± 7.24 | 31.7 ± 9.10 | 31.7 ± 5.91 | 29.4 ± 8.42 | 32.9 ± 6.84 | 27.2 ± 5.60 | 31.6 ± 6.65 | ||
| Temporal Lobes | 32.6 ± 4.72 | 32.8 ± 5.32 | 32.0 ± 5.97 | 32.2 ± 6.20 | 30.9 ± 4.94 | 33.2 ± 5.06 | 28.9 ± 4.78 | 32.2 ± 5.16 | ||
| Cerebellum | 31.1 ± 4.66 | 28.6 ± 5.71 | 30.1 ± 6.51 | 30.0 ± 7.17 | 28.5 ± 5.75 | 30.7 ± 3.70 | 23.4 ± 1.82 | 29.6 ± 5.50 | ||
| WM | Whole Brain | 15.1 ± 1.88 | 15.5 ± 3.84 | 15.9 ± 3.97 | 17.1 ± 3.59 | 18.5 ± 4.06 | 22.1 ± 5.64 | 18.1 ± 1.83 | 17.3 ± 4.35 | |
| Frontal Lobes | 11.8 ± 1.87 | 13.2 ± 3.34 | 13.2 ± 2.69 | 12.8 ± 2.59 | 15.9 ± 3.02 | 14.8 ± 3.47 | 14.2 ± 1.58 | 13.4 ± 2.83 | ||
| Occipital Lobes | 13.6 ± 1.84 | 13.7 ± 3.34 | 13.5 ± 3.37 | 16.8 ± 2.78 | 15.2 ± 2.96 | 17.1 ± 3.53 | 14.8 ± 5.22 | 14.9 ± 3.32 | ||
| Parietal Lobes | 13.2 ± 1.96 | 13.4 ± 3.53 | 13.8 ± 4.12 | 15.3 ± 2.4 | 17.1 ± 3.13 | 17.1 ± 4.13 | 15.4 ± 2.34 | 14.8 ± 3.42 | ||
| Temporal Lobes | 12.5 ± 1.59 | 12.9 ± 2.7 | 12.4 ± 2.55 | 14.8 ± 3.08 | 13.5 ± 2.21 | 15.7 ± 3.42 | 14.9 ± 3.01 | 13.7 ± 2.83 | ||
| Cerebellum | 19.9 ± 1.78 | 18.6 ± 3.02 | 18.3 ± 3.22 | 19.5 ± 3.84 | 20.8 ± 1.75 | 21.9 ± 2.04 | 17.6 ± 1.36 | 19.6 ± 2.90 | ||
| Women | GM | Whole Brain | 40.8 ± 5.59 | 40.0 ± 3.63 | 34.5 ± 6.27 | 35.3 ± 4.68 | 32.8 ± 5.86 | 31.8 ± 6.16 | 29.4 ± n/a | 36.0 ± 6.28 |
| Frontal Lobes | 41.2 ± 5.18 | 39.7 ± 2.36 | 34.3 ± 7.77 | 35.4 ± 3.55 | 31.2 ± 5.99 | 31.0 ± 6.16 | 25.4 ± n/a | 35.4 ± 6.9 | ||
| Occipital Lobes | 48.5 ± 8.34 | 45.8 ± 12.9 | 40.2 ± 8.80 | 43.8 ± 7.85 | 39.5 ± 8.68 | 38.2 ± 9.16 | 38.0 ± n/a | 42.7 ± 9.06 | ||
| Parietal Lobes | 41.0 ± 7.84 | 43.4 ± 9.01 | 34.4 ± 8.27 | 36.9 ± 3.16 | 32.8 ± 7.94 | 34.9 ± 7.75 | 31.5 ± n/a | 36.8 ± 7.96 | ||
| Temporal Lobes | 41.7 ± 5.39 | 38.8 ± 5.14 | 35.5 ± 5.85 | 34.9 ± 6.37 | 35.4 ± 6.73 | 33.6 ± 7.60 | 32.1 ± n/a | 36.9 ± 6.33 | ||
| Cerebellum | 40.0 5.75 | 37.3 ± 9.08 | 35.9 ± 4.40 | 32.1 ± 6.52 | 33.0 ± 5.03 | 30.6 ± 3.91 | 30.2 ± n/a | 35.4 ± 6.19 | ||
| WM | Whole Brain | 18.2 ± 3.07 | 20.3 ± 3.76 | 17.5 ± 1.17 | 17.8 ± 3.40 | 19.5 ± 5.53 | 22.2 ± 4.04 | 20.4 ± n/a | 19.1 ± 3.60 | |
| Frontal Lobes | 13.9 ± 2.21 | 16.8 ± 1.73 | 14.3 ± 0.98 | 14.2 ± 2.65 | 13.9 ± 3.72 | 17.6 ± 2.12 | 15.1 ± n/a | 14.8 ± 2.53 | ||
| Occipital Lobes | 16.4 ± 2.76 | 15.8 ± 3.71 | 17.2 ± 1.62 | 17.2 ± 2.54 | 18.5 ± 3.11 | 18.1 ± 3.33 | 20.7 ± n/a | 17.4 ± 2.70 | ||
| Parietal Lobes | 15.7 ± 3.42 | 16.1 ± 6.14 | 15.3 ± 2.21 | 14.7 ± 2.49 | 17.6 ± 4.07 | 19.3 ± 1.53 | 15.2 ± n/a | 16.3 ± 3.38 | ||
| Temporal Lobes | 14.7 ± 2.56 | 14.8 ± 2.78 | 15.4 ± 1.71 | 14.9 ± 3.29 | 15.9 ± 3.36 | 16.9 ± 2.60 | 16.5 ± n/a | 15.4 ± 2.50 | ||
| Cerebellum | 21.7 ± 1.74 | 18.8 ± 3.38 | 21.6 ± 1.06 | 21.3 ± 1.08 | 21.6 ± 2.84 | 24.5 ±1.66 | 22.6 ± n/a | 21.7 ± 2.37 | ||
Discussion
In this cross-sectional study of a cohort of cognitively unimpaired participants, we investigated CBF as a function of age and sex within twelve cortical and white matter cerebral structures. Our results indicate that CBF decreases with age in all GM regions investigated, consistent with previous studies [5–8, 13, 16]. This age-related reduction in CBF may reflect decreased cerebral metabolic demand, decreased neuronal firing, decreased dendritic synaptic density, as well as cerebrovascular deterioration [16–21]. Indeed, aging is accompanied by changes in brain structure which likely lead to a decreased metabolic demand while also rendering it particularly vulnerable to neurodegenerative processes [22].
There is increasing evidence of an association between brain hypoperfusion and dementia [23, 24], so that characterizing normative age-related changes in CBF may represent a fundamental step towards differentiating between normative aging and pathology. Several previous studies have reported a decrease in cortical CBF with age, while others have found no trend or an increase [5–12]. Comparison of these results with the present ones is difficult due to differences in cohort size, non-standardized methodology, and analysis of different brain regions. Our work is distinguished by the use of a large cohort and a modern, sensitive, ASL MRI sequence, pCASL, incorporation of NESMA filtering, and optimized experimental parameters. Indeed, our advanced postprocessing analysis [15] allowed us to provide results for WM as well as GM regions.
Our findings of statistically significant increases in CBF with age in all WM regions investigated agrees with previous studies [11, 12, 14]. However, the literature regarding age-related differences in CBF in WM regions is limited and results are sparse. This is likely due to the high degree of noise sensitivity of CBF values derived from ASL, especially in WM with its inherently low CBF values. We provisionally attribute the observed increase in WM CBF with age to increased oligodendrocyte metabolic demand for production and maintenance of myelin homeostasis [25, 26]. Indeed, studies have shown that brain undergoes rapid myelin loss after the fourth age decade [27–31]. However, further studies, especially longitudinal studies, are required to elucidate the mechanisms underlying CBF changes in WM.
We note that re-analysis of our data using unfiltered CBF maps showed trends similar to the results presented for filtered maps (Table 1). Thus, the trends of increasing CBF with age in WM observed in this work are independent of filtering. However, with the improvement in parameter estimation derived from use of filtering, the power of the analysis is greatly increased. Our results must be interpreted with caution. Indeed, it has been shown that a high signal-to-noise ratio, achieved through a large number of signal averages, is required to detect perfusion signal in deep white matter regions [32]. Furthermore, the ASL protocol used in our study is optimized for GM CBF. ASL studies using multiple post-labeling delays are required for further validation [33].
The details of the linear relationships between CBF and age, including their slopes and statistical significance, will exhibit some variability as a function of sampling density within age groups, range of ages incorporated, and consistency of data [34]. In addition, the choice of a linear regression model, while conventional and consistent with our visual inspection of the results, is best considered as an expedient to model the data, without the implication that it is based on the biology of underlying physiologic processes. Nonlinear models may serve equally well as data descriptors. Indeed, in a very large cohort of youth participants, it has been demonstrated that the relationships between CBF and age are best described by nonlinear trends [35]. However, the present analysis provides a basic description of the variation of CBF with age in adulthood. Moreover, at ages younger or older than our sample, the trends with respect to age may deviate substantially from the indicated regression results. The fundamental physiology of these extremes of age may differ from that within the age range we are investigating.
In further agreement with the literature, our results indicated that women exhibit significantly higher CBF values than men [8, 14, 36–41] in most WM and GM structures investigated. This may be attributed to several factors including sex differences in heart rate, blood pressure, and hematocrit, all of which may modulate CBF [41–44]. Indeed, it has been shown that CBF quantification from ASL using a fixed hematocrit of 43.5%, as generally assumed, may lead to bias in derived CBF values particularly in non-European or female subjects, so that individually measured hematocrit should be considered to improve determination of CBF [43]. In addition, recent studies have shown that women have higher myelin content than men [25, 26]; this may also explain differences in CBF in WM, with these myelinated regions exhibiting increased metabolic demand to maintain myelin homeostasis. Differences in sex hormones may also contribute to the differences in CBF observed between men and women. Indeed, studies have shown that estrogen and testosterone have different effects on CBF [8, 41, 45, 46]; overall, estrogen decreases cerebral vascular tone and increases CBF by enhancing endothelial-derived nitric oxide and prostacyclin pathways, while testosterone increases cerebral artery tone. From this perspective, declining estrogen levels following menopause [47, 48] could further contribute to the observation that women exhibit statistically significant decreases in CBF compared to men found here and in other studies [8, 12]. Finally, changes in CBF during the follicular and luteal phases of the menstrual cycle have recently been demonstrated [49]. However, elucidation of these effects would require a much larger cohort size than in the present study.
Sex differences in CBF may provide insights into their potential role in neurodegenerative diseases, especially given the emerging data regarding the higher incidence rate of Alzheimer’s disease (AD) in women [50–52]. Evidence implicates decreases in regional CBF with subsequent decreased metabolic activity in AD and other forms of dementia [53–57]. These studies and our current findings motivate further investigation of the underlying mechanisms of CBF decline and its role in the development of cognitive impairment, including dementia. If confirmed with longitudinal studies, this could establish maintenance of CBF through pharmacologic or lifestyle interventions as a therapeutic target for prevention of dementia; this could be tailored differently for men and women.
Finally, we note that our measured CBF values are somewhat different from those reported in the literature; this may be attributed to the dependence of such values on ASL sequence type, labeling pulse duration, post-labeling duration, background suppression method, repetition time, echo time, and other factors [33]. Indeed, derived CBF values span a wide age range in the literature, between 40 to 80 mL/min/100g for GM and 10 to 30 mL/min/100g in WM [5–14, 16, 58–60]. Nevertheless, we have employed a self-consistent MRI protocol throughout this study, so that the age and sex related results within our cohort are reliable.
Limitations
Although our work examines a relatively large cohort and uses advanced MR methodology, certain limitations remain. Our dataset is cross-sectional, so that the CBF associations with age observed here require further validation through longitudinal studies. Such work, motivated by the present results, is underway. Furthermore, we used identical ASL experimental parameters for all subjects and acquired perfusion images at a single post-labeling delay (PLD), implicitly assuming minimal effects from potential spatial variation in arterial transit time (ATT), the transit time of the arterial bolus from the labeling plane to the imaging voxels [33, 61]. Although this is a reasonable assumption [4], ATT may vary spatially within a single subject, and may differ between subjects secondary to arterial blood velocity differences. Further work may implement ASL techniques employing multiple post-labeling delays to address this [33]. In addition, a PLD of 1800 ms was recommended for patients less than 70 yrs. [4]. We fixed PLD to 2000 ms based on the recommendations of Alsop and colleagues: “… a PLD of 2000 ms recommended for the clinical adult population, independent of age, given the potential for a wide variety of pathologies, which are often not known in advance of imaging” [4]. Moreover, as conventional [4], we assumed constant longitudinal and transverse relaxation times for all participants, although these parameters follow complex patterns with aging [30, 62, 63]. Further, although our assessment of white matter hyperintensities (WMHI) did not reveal WMHI in any of the participants of our study cohort, our inspection was based on the PD images only. A thorough evaluation using FLAIR-based images could have provided a better assessment of WMHI. Finally, other factors, including cortical tissue atrophy [5, 64, 65], medications, and dietary intake were not considered in this work.
In conclusion, we examined regional CBF in cerebral WM and GM structures in a cohort of cognitively unimpaired participants across a wide age range. We found lower CBF values with age in GM regions, while higher CBF values with age in WM regions. In addition, women exhibited overall higher CBF values as compared to men. This work may lay the foundation for longitudinal investigations to establish the nature of regional CBF changes with normal aging and neurodegeneration, including Alzheimer’s disease.
Materials and Methods
Participants
Investigation has been conducted in accordance with the ethical standards and according to the Declaration of Helsinki and according to national and international guidelines and has been approved by the authors' institutional review board. Participants were drawn from two ongoing healthy aging cohorts at the National Institute on Aging (NIA). 15 volunteers from the Baltimore Longitudinal Study of Aging (BLSA) [66, 67], and 52 from the Genetic and Epigenetic Signatures of Translational Aging Laboratory Testing (GESTALT) were enrolled in this study. Thirteen additional participants from our home institution were recruited. The study populations, experimental design, and measurement protocols of the BLSA have been previously reported [66, 67]. The BLSA is a longitudinal cohort study funded and conducted by the NIA Intramural Research Program (IRP). Established in 1958, the BLSA enrolls community-dwelling adults with no major chronic conditions or functional impairments. The GESTALT study is also a study of healthy volunteers, initiated in 2015, and funded and conducted by the NIA IRP. The goal of the BLSA and GESTALT studies is to evaluate multiple biomarkers related to aging. We note that the inclusion and exclusion criteria for these two studies are essentially identical. Participants underwent testing at the NIA's clinical research unit and were excluded if they had metallic implants, or neurologic or medical disorders. Participants underwent a Mini Mental State Examination (MMSE) and achieved a score > 25. The final cohort consisted of 80 cognitively unimpaired volunteers ranging in age from 22 to 88 years (mean ± standard deviation 49.2 ± 18.7 years) of which 47 were men (49.7 ± 19.2 years) and 33 were women (48.4 ± 18.3 years). Data from four additional subjects were not included due to excessive motion artifacts. The number of participants per age-decade was: 17 (8 women) within 20-29 years, 11 (4 women) within 30-39 years, 16 (7 women) within 40-49 years, 11 (3 women) within 50-59 years, 9 (6 women) within 60-69 years, 12 (4 women) within 70-79 years, and 4 (1 woman) within 80-89 years. Figure 5 provides a detailed distribution of the number of participants per age-decade and sex. Experimental procedures were performed in compliance with our local Institutional Review Board, and participants provided written informed consent.
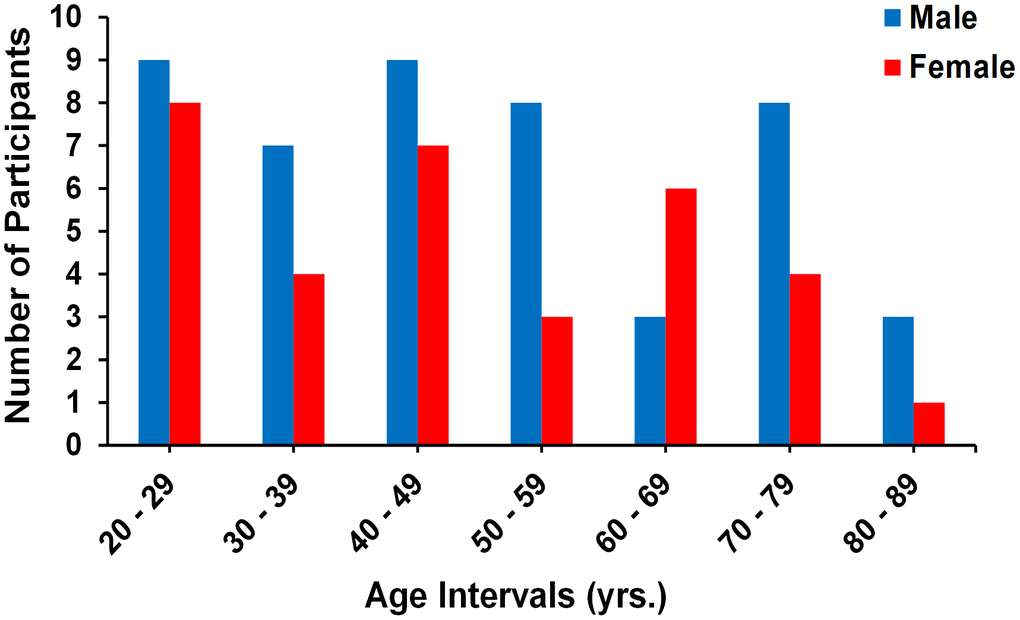
Figure 5. Number of participants per age decade and sex within the study cohort.
Data acquisition
MRI scans were performed on a 3T whole body Philips MRI system (Achieva, Best, The Netherlands) using the internal quadrature body coil for transmission and an eight-channel phased-array head coil for reception. For each participant, multi-slice single shot 2D echo-planar imaging (EPI) pCASL imaging datasets were acquired following the consensus recommendations of the ISMRM Perfusion Study Group and the European ASL in Dementia consortium [4]. This consisted of control, labeled, and proton density (PD) images acquired with incorporation of background suppression, FoV of 220 mm × 210 mm × 120 mm, and spatial resolution of 2.5 mm × 2.5 mm × 5 mm with reconstruction to 1 mm × 1 mm × 1 mm through linear interpolation after scanner reconstruction. 24 slices were acquired in ascending order to avoid slice ordering confounds associated with interleaved order schemes, and with minimal temporal slice spacing to ensure similar post-labeling duration (PLD) for all slices. Other experimental parameters were: echo time (TE) of 15 ms, repetition time (TR) of 7.5 s, labeling duration of 1.8 s, PLD of 2 s, SENSE factor of 2.3, flip angle of 90°, label distance of 8.5 cm, and 30 signal averages [4]. We note that the PD image was acquired with identical TE and TR as for the control and labeled images. The total acquisition time was ~12 min.
Data processing
After careful visual inspection of data quality for each participant [4], a whole-brain CBF map was generated from the corresponding pCASL dataset using NESMA noise filtering to improve accuracy and precision in CBF determination [15]. Briefly, NESMA-ASL restores the amplitude of an index voxel by incorporating the intensities of voxels with similar multispectral signal patterns, that is, intensities from pCASL images. The similarity between two voxels across the pCASL images is calculated using the relative Euclidean distance within a large search window centered on the index voxel. The size of the search window must be sufficiently large to ensure inclusion of an adequate number of similar voxels, and sufficiently restricted to ensure that the transmission and reception radiofrequency fields and noise standard deviation are approximately constant within the window. Voxels exhibiting relative Euclidean distance lower than 5% are considered as being similar to the index voxel [15]. Finally, CBF maps derived from unfiltered ASL images were also generated for comparison with those derived from the NESMA-filtered ASL images. All CBF maps were calculated based on the following equation [4].
where IC, IL, and IPD are the control, labeled, and PD images, respectively. Here, λ is the partition coefficient between brain tissue and blood with value set to 0.9 mL/g, α is the labeling efficiency with value fixed to 0.85, T1,Blood = 1.65 s (at 3T) representing the longitudinal relaxation time of blood, and LD and PLD are the label duration and post labeling delay, respectively.
The PD image of each participant was nonlinearly registered to the Montreal Neurological Institute (MNI) space with 1 mm × 1 mm × 1 mm voxel resolution, using FNIRT as implemented in the FMRIB Software library (FSL) [68]. Using FSL, FAST segmentation was performed to generate WM and GM masks. Figure 1 shows examples of GM and WM masks for fourteen participants within different age decades. Six regions of interest (ROIs) were defined from the MNI structural atlas corresponding to the whole brain, and the frontal, parietal, temporal, and occipital lobes, and the cerebellum. In each ROI, only voxels with at least 90% of GM or WM, as defined from the FSL-FAST WM and GM masks, were considered to minimize partial volume effects. The mean CBF value within each ROI was then calculated.
Statistical analysis
For each ROI, the effects of age and sex on CBF were investigated using multiple linear regression with the mean CBF value within each WM or GM ROI as the dependent variable and age and sex as the independent variables. The initial model incorporated an interaction term between sex and age which was removed if found not to be significant. The resulting parsimonious model was then constructed without this interaction term. This analysis was conducted on CBF values derived both with and without use of NESMA-ASL filtering to define the possible effect of filtering on our results.
Further, the effect of age on CBF for men and for women separately was also investigated with the mean CBF value within each WM or GM ROI as the dependent variable and age as the independent variable. For all statistical analyses, the threshold for statistical significance was p < 0.05 after correction for multiple ROI comparisons (i.e. 12 ROIs) using the false discovery rate (FDR) method [69, 70]. All calculations were performed with MATLAB (MathWorks, Natick, MA, USA).
Author Contributions
MB, RGS: Research design, Analysis, Paper writing JSRA, NK, RWK, ACR, LEC, WQ, LF, SMR: Analysis, Paper writing, Paper editing.
Acknowledgments
We gratefully acknowledge Christopher M. Bergeron, Denise Melvin, and Linda Zukley for their assistance with data acquisition, participant recruitment, and logistics.
Conflicts of Interest
The authors declare that the research was conducted in the absence of any commercial or financial relationships that could be construed as a potential conflict of interest.
Funding
This work was supported by the Intramural Research Program of the National Institute on Aging of the National Institutes of Health.
References
- 1. Hays CC, Zlatar ZZ, Wierenga CE. The utility of cerebral blood flow as a biomarker of preclinical Alzheimer’s disease. Cell Mol Neurobiol. 2016; 36:167–79. https://doi.org/10.1007/s10571-015-0261-z [PubMed]
- 2. Zlokovic BV. Neurovascular pathways to neurodegeneration in Alzheimer’s disease and other disorders. Nat Rev Neurosci. 2011; 12:723–38. https://doi.org/10.1038/nrn3114 [PubMed]
- 3. Hernandez-Garcia L, Lahiri A, Schollenberger J. Recent progress in ASL. Neuroimage. 2019; 187:3–16. https://doi.org/10.1016/j.neuroimage.2017.12.095 [PubMed]
- 4. Alsop DC, Detre JA, Golay X, Günther M, Hendrikse J, Hernandez-Garcia L, Lu H, MacIntosh BJ, Parkes LM, Smits M, van Osch MJ, Wang DJ, Wong EC, Zaharchuk G. Recommended implementation of arterial spin-labeled perfusion MRI for clinical applications: A consensus of the ISMRM perfusion study group and the european consortium for ASL in dementia. Magn Reson Med. 2015; 73:102–16. https://doi.org/10.1002/mrm.25197 [PubMed]
- 5. Chen JJ, Rosas HD, Salat DH. Age-associated reductions in cerebral blood flow are independent from regional atrophy. Neuroimage. 2011; 55:468–78. https://doi.org/10.1016/j.neuroimage.2010.12.032 [PubMed]
- 6. Bertsch K, Hagemann D, Hermes M, Walter C, Khan R, Naumann E. Resting cerebral blood flow, attention, and aging. Brain Res. 2009; 1267:77–88. https://doi.org/10.1016/j.brainres.2009.02.053 [PubMed]
- 7. Tarumi T, Ayaz Khan M, Liu J, Tseng BY, Parker R, Riley J, Tinajero C, Zhang R. Cerebral hemodynamics in normal aging: central artery stiffness, wave reflection, and pressure pulsatility. J Cereb Blood Flow Metab. 2014; 34:971–78. https://doi.org/10.1038/jcbfm.2014.44 [PubMed]
- 8. Liu W, Lou X, Ma L. Use of 3D pseudo-continuous arterial spin labeling to characterize sex and age differences in cerebral blood flow. Neuroradiology. 2016; 58:943–48. https://doi.org/10.1007/s00234-016-1713-y [PubMed]
- 9. Preibisch C, Sorg C, Förschler A, Grimmer T, Sax I, Wohlschläger AM, Perneczky R, Förstl H, Kurz A, Zimmer C, Alexopoulos P. Age-related cerebral perfusion changes in the parietal and temporal lobes measured by pulsed arterial spin labeling. J Magn Reson Imaging. 2011; 34:1295–302. https://doi.org/10.1002/jmri.22788 [PubMed]
- 10. Lee C, Lopez OL, Becker JT, Raji C, Dai W, Kuller LH, Gach HM. Imaging cerebral blood flow in the cognitively normal aging brain with arterial spin labeling: implications for imaging of neurodegenerative disease. J Neuroimaging. 2009; 19:344–52. https://doi.org/10.1111/j.1552-6569.2008.00277.x [PubMed]
- 11. Zhang N, Gordon ML, Ma Y, Chi B, Gomar JJ, Peng S, Kingsley PB, Eidelberg D, Goldberg TE. The age-related perfusion pattern measured with arterial spin labeling MRI in healthy subjects. Front Aging Neurosci. 2018; 10:214. https://doi.org/10.3389/fnagi.2018.00214 [PubMed]
- 12. Pagani M, Salmaso D, Jonsson C, Hatherly R, Jacobsson H, Larsson SA, Wägner A. Regional cerebral blood flow as assessed by principal component analysis and (99m)Tc-HMPAO SPET in healthy subjects at rest: normal distribution and effect of age and gender. Eur J Nucl Med Mol Imaging. 2002; 29:67–75. https://doi.org/10.1007/s00259-001-0676-2 [PubMed]
- 13. Lu H, Xu F, Rodrigue KM, Kennedy KM, Cheng Y, Flicker B, Hebrank AC, Uh J, Park DC. Alterations in cerebral metabolic rate and blood supply across the adult lifespan. Cereb Cortex. 2011; 21:1426–34. https://doi.org/10.1093/cercor/bhq224 [PubMed]
- 14. Parkes LM, Rashid W, Chard DT, Tofts PS. Normal cerebral perfusion measurements using arterial spin labeling: reproducibility, stability, and age and gender effects. Magn Reson Med. 2004; 51:736–43. https://doi.org/10.1002/mrm.20023 [PubMed]
- 15. Bouhrara M, Lee DY, Rejimon AC, Bergeron CM, Spencer RG. Spatially adaptive unsupervised multispectral nonlocal filtering for improved cerebral blood flow mapping using arterial spin labeling magnetic resonance imaging. J Neurosci Methods. 2018; 309:121–31. https://doi.org/10.1016/j.jneumeth.2018.08.018 [PubMed]
- 16. Leenders KL, Perani D, Lammertsma AA, Heather JD, Buckingham P, Healy MJ, Gibbs JM, Wise RJ, Hatazawa J, Herold S. Cerebral blood flow, blood volume and oxygen utilization. Normal values and effect of age. Brain. 1990; 113:27–47. https://doi.org/10.1093/brain/113.1.27 [PubMed]
- 17. Marchal G, Rioux P, Petit-Taboué MC, Sette G, Travère JM, Le Poec C, Courtheoux P, Derlon JM, Baron JC. Regional cerebral oxygen consumption, blood flow, and blood volume in healthy human aging. Arch Neurol. 1992; 49:1013–20. https://doi.org/10.1001/archneur.1992.00530340029014 [PubMed]
- 18. Blass JP, Gibson GE, Hoyer S. Chapter 5 Metabolism of the Aging Brain. In: Timiras PS and Bittar EE, eds. Advances in Cell Aging and Gerontology: Elsevier. 1997; 109–28. https://doi.org/10.1016/S1566-3124(08)60055-3
- 19. Yang T, Sun Y, Lu Z, Leak RK, Zhang F. The impact of cerebrovascular aging on vascular cognitive impairment and dementia. Ageing Res Rev. 2017; 34:15–29. https://doi.org/10.1016/j.arr.2016.09.007 [PubMed]
- 20. Zhu YS, Tseng BY, Shibata S, Levine BD, Zhang R. Increases in cerebrovascular impedance in older adults. J Appl Physiol (1985). 2011; 111:376–81. https://doi.org/10.1152/japplphysiol.01418.2010 [PubMed]
- 21. Gur RC, Mozley LH, Mozley PD, Resnick SM, Karp JS, Alavi A, Arnold SE, Gur RE. Sex differences in regional cerebral glucose metabolism during a resting state. Science. 1995; 267:528–31. https://doi.org/10.1126/science.7824953 [PubMed]
- 22. Sweeney MD, Kisler K, Montagne A, Toga AW, Zlokovic BV. The role of brain vasculature in neurodegenerative disorders. Nat Neurosci. 2018; 21:1318–31. https://doi.org/10.1038/s41593-018-0234-x [PubMed]
- 23. Roher AE, Debbins JP, Malek-Ahmadi M, Chen K, Pipe JG, Maze S, Belden C, Maarouf CL, Thiyyagura P, Mo H, Hunter JM, Kokjohn TA, Walker DG, et al. Cerebral blood flow in Alzheimer’s disease. Vasc Health Risk Manag. 2012; 8:599–611. https://doi.org/10.2147/VHRM.S34874 [PubMed]
- 24. Mazza M, Marano G, Traversi G, Bria P, Mazza S. Primary cerebral blood flow deficiency and Alzheimer’s disease: shadows and lights. J Alzheimers Dis. 2011; 23:375–89. https://doi.org/10.3233/JAD-2010-090700 [PubMed]
- 25. Bouhrara M, Rejimon AC, Cortina LE, Khattar N, Bergeron CM, Ferrucci L, Resnick SM, Spencer RG. Adult brain aging investigated using BMC-mcDESPOT-based myelin water fraction imaging. Neurobiol Aging. 2020; 85:131–39. https://doi.org/10.1016/j.neurobiolaging.2019.10.003 [PubMed]
- 26. Arshad M, Stanley JA, Raz N. Adult age differences in subcortical myelin content are consistent with protracted myelination and unrelated to diffusion tensor imaging indices. Neuroimage. 2016; 143:26–39. https://doi.org/10.1016/j.neuroimage.2016.08.047 [PubMed]
- 27. Bartzokis G, Lu PH, Tingus K, Mendez MF, Richard A, Peters DG, Oluwadara B, Barrall KA, Finn JP, Villablanca P, Thompson PM, Mintz J. Lifespan trajectory of myelin integrity and maximum motor speed. Neurobiol Aging. 2010; 31:1554–62. https://doi.org/10.1016/j.neurobiolaging.2008.08.015 [PubMed]
- 28. Okubo G, Okada T, Yamamoto A, Fushimi Y, Okada T, Murata K, Togashi K. Relationship between aging and T1 relaxation time in deep gray matter: a voxel-based analysis. J Magn Reson Imaging. 2017; 46:724–31. https://doi.org/10.1002/jmri.25590 [PubMed]
- 29. Westlye LT, Walhovd KB, Dale AM, Bjørnerud A, Due-Tønnessen P, Engvig A, Grydeland H, Tamnes CK, Ostby Y, Fjell AM. Life-span changes of the human brain white matter: diffusion tensor imaging (DTI) and volumetry. Cereb Cortex. 2010; 20:2055–68. https://doi.org/10.1093/cercor/bhp280 [PubMed]
- 30. Yeatman JD, Wandell BA, Mezer AA. Lifespan maturation and degeneration of human brain white matter. Nat Commun. 2014; 5:4932. https://doi.org/10.1038/ncomms5932 [PubMed]
- 31. Qian W, Khattar N, Cortina LE, Spencer RG, Bouhrara M. Nonlinear associations of neurite density and myelin content with age revealed using multicomponent diffusion and relaxometry magnetic resonance imaging. Neuroimage. 2020; 223:117369. https://doi.org/10.1016/j.neuroimage.2020.117369 [PubMed]
- 32. van Osch MJ, Teeuwisse WM, van Walderveen MA, Hendrikse J, Kies DA, van Buchem MA. Can arterial spin labeling detect white matter perfusion signal? Magn Reson Med. 2009; 62:165–73. https://doi.org/10.1002/mrm.22002 [PubMed]
- 33. Qin Q, Huang AJ, Hua J, Desmond JE, Stevens RD, van Zijl PC. Three-dimensional whole-brain perfusion quantification using pseudo-continuous arterial spin labeling MRI at multiple post-labeling delays: accounting for both arterial transit time and impulse response function. NMR Biomed. 2014; 27:116–28. https://doi.org/10.1002/nbm.3040 [PubMed]
- 34. Fjell AM, Walhovd KB, Westlye LT, Østby Y, Tamnes CK, Jernigan TL, Gamst A, Dale AM. When does brain aging accelerate? dangers of quadratic fits in cross-sectional studies. Neuroimage. 2010; 50:1376–83. https://doi.org/10.1016/j.neuroimage.2010.01.061 [PubMed]
- 35. Satterthwaite TD, Shinohara RT, Wolf DH, Hopson RD, Elliott MA, Vandekar SN, Ruparel K, Calkins ME, Roalf DR, Gennatas ED, Jackson C, Erus G, Prabhakaran K, et al. Impact of puberty on the evolution of cerebral perfusion during adolescence. Proc Natl Acad Sci USA. 2014; 111:8643–48. https://doi.org/10.1073/pnas.1400178111 [PubMed]
- 36. Liu Y, Zhu X, Feinberg D, Guenther M, Gregori J, Weiner MW, Schuff N. Arterial spin labeling MRI study of age and gender effects on brain perfusion hemodynamics. Magn Reson Med. 2012; 68:912–22. https://doi.org/10.1002/mrm.23286 [PubMed]
- 37. Devous MD
Sr , Stokely EM, Chehabi HH, Bonte FJ. Normal distribution of regional cerebral blood flow measured by dynamic single-photon emission tomography. J Cereb Blood Flow Metab. 1986; 6:95–104. https://doi.org/10.1038/jcbfm.1986.12 [PubMed] - 38. Podreka I, Baumgartner C, Suess E, Müller C, Brücke T, Lang W, Holzner F, Steiner M, Deecke L. Quantification of regional cerebral blood flow with IMP-SPECT. Reproducibility and clinical relevance of flow values. Stroke. 1989; 20:183–91. https://doi.org/10.1161/01.str.20.2.183 [PubMed]
- 39. Esposito G, Van Horn JD, Weinberger DR, Berman KF. Gender differences in cerebral blood flow as a function of cognitive state with PET. J Nucl Med. 1996; 37:559–64. [PubMed]
- 40. Rodriguez G, Warkentin S, Risberg J, Rosadini G. Sex differences in regional cerebral blood flow. J Cereb Blood Flow Metab. 1988; 8:783–89. https://doi.org/10.1038/jcbfm.1988.133 [PubMed]
- 41. Gur RE, Gur RC. Gender differences in regional cerebral blood flow. Schizophr Bull. 1990; 16:247–54. https://doi.org/10.1093/schbul/16.2.247 [PubMed]
- 42. Ryan SM, Goldberger AL, Pincus SM, Mietus J, Lipsitz LA. Gender- and age-related differences in heart rate dynamics: are women more complex than men? J Am Coll Cardiol. 1994; 24:1700–07. https://doi.org/10.1016/0735-1097(94)90177-5 [PubMed]
- 43. Smith LA, Melbourne A, Owen D, Cardoso MJ, Sudre CH, Tillin T, Sokolska M, Atkinson D, Chaturvedi N, Ourselin S, Hughes AD, Barkhof F, Jäger HR. Cortical cerebral blood flow in ageing: effects of haematocrit, sex, ethnicity and diabetes. Eur Radiol. 2019; 29:5549–58. https://doi.org/10.1007/s00330-019-06096-w [PubMed]
- 44. Henriksen OM, Jensen LT, Krabbe K, Guldberg P, Teerlink T, Rostrup E. Resting brain perfusion and selected vascular risk factors in healthy elderly subjects. PLoS One. 2014; 9:e97363. https://doi.org/10.1371/journal.pone.0097363 [PubMed]
- 45. Krause DN, Duckles SP, Pelligrino DA. Influence of sex steroid hormones on cerebrovascular function. J Appl Physiol (1985). 2006; 101:1252–61. https://doi.org/10.1152/japplphysiol.01095.2005 [PubMed]
- 46. Orshal JM, Khalil RA. Gender, sex hormones, and vascular tone. Am J Physiol Regul Integr Comp Physiol. 2004; 286:R233–49. https://doi.org/10.1152/ajpregu.00338.2003 [PubMed]
- 47. Burger HG, Hale GE, Robertson DM, Dennerstein L. A review of hormonal changes during the menopausal transition: focus on findings from the melbourne women’s midlife health project. Hum Reprod Update. 2007; 13:559–65. https://doi.org/10.1093/humupd/dmm020 [PubMed]
- 48. Sherman BM, West JH, Korenman SG. The menopausal transition: analysis of LH, FSH, estradiol, and progesterone concentrations during menstrual cycles of older women. J Clin Endocrinol Metab. 1976; 42:629–36. https://doi.org/10.1210/jcem-42-4-629 [PubMed]
- 49. Otomo M, Harada M, Abe T, Matsumoto Y, Abe Y, Kanazawa Y, Miyoshi M, Kabasawa H, Takahashi Y. Reproducibility and variability of quantitative cerebral blood flow measured by multi-delay 3D arterial spin labeling according to sex and menstrual cycle. J Med Invest. 2020; 67:321–27. https://doi.org/10.2152/jmi.67.321 [PubMed]
- 50. Andersen K, Launer LJ, Dewey ME, Letenneur L, Ott A, Copeland JR, Dartigues JF, Kragh-Sorensen P, Baldereschi M, Brayne C, Lobo A, Martinez-Lage JM, Stijnen T, Hofman A. Gender differences in the incidence of AD and vascular dementia: The EURODEM Studies. EURODEM Incidence Research Group. Neurology. 1999; 53:1992–7. https://doi.org/10.1212/wnl.53.9.1992 [PubMed]
- 51. Seshadri S, Wolf PA, Beiser A, Au R, McNulty K, White R, D’Agostino RB. Lifetime risk of dementia and Alzheimer’s disease. The impact of mortality on risk estimates in the Framingham study. Neurology. 1997; 49:1498–504. https://doi.org/10.1212/wnl.49.6.1498 [PubMed]
- 52. Gao S, Hendrie HC, Hall KS, Hui S. The relationships between age, sex, and the incidence of dementia and Alzheimer disease: a meta-analysis. Arch Gen Psychiatry. 1998; 55:809–15. https://doi.org/10.1001/archpsyc.55.9.809 [PubMed]
- 53. Sandson TA, O’Connor M, Sperling RA, Edelman RR, Warach S. Noninvasive perfusion MRI in Alzheimer’s disease: a preliminary report. Neurology. 1996; 47:1339–42. https://doi.org/10.1212/wnl.47.5.1339 [PubMed]
- 54. Johnson NA, Jahng GH, Weiner MW, Miller BL, Chui HC, Jagust WJ, Gorno-Tempini ML, Schuff N. Pattern of cerebral hypoperfusion in Alzheimer disease and mild cognitive impairment measured with arterial spin-labeling MR imaging: initial experience. Radiology. 2005; 234:851–59. https://doi.org/10.1148/radiol.2343040197 [PubMed]
- 55. Bron EE, Steketee RM, Houston GC, Oliver RA, Achterberg HC, Loog M, van Swieten JC, Hammers A, Niessen WJ, Smits M, Klein S, and Alzheimer’s Disease Neuroimaging Initiative. Diagnostic classification of arterial spin labeling and structural MRI in presenile early stage dementia. Hum Brain Mapp. 2014; 35:4916–31. https://doi.org/10.1002/hbm.22522 [PubMed]
- 56. Verfaillie SC, Adriaanse SM, Binnewijzend MA, Benedictus MR, Ossenkoppele R, Wattjes MP, Pijnenburg YA, van der Flier WM, Lammertsma AA, Kuijer JP, Boellaard R, Scheltens P, van Berckel BN, Barkhof F. Cerebral perfusion and glucose metabolism in Alzheimer’s disease and frontotemporal dementia: two sides of the same coin? Eur Radiol. 2015; 25:3050–59. https://doi.org/10.1007/s00330-015-3696-1 [PubMed]
- 57. Jueptner M, Weiller C. Review: does measurement of regional cerebral blood flow reflect synaptic activity? implications for PET and fMRI. Neuroimage. 1995; 2:148–56. https://doi.org/10.1006/nimg.1995.1017 [PubMed]
- 58. Ito H, Kanno I, Kato C, Sasaki T, Ishii K, Ouchi Y, Iida A, Okazawa H, Hayashida K, Tsuyuguchi N, Ishii K, Kuwabara Y, Senda M. Database of normal human cerebral blood flow, cerebral blood volume, cerebral oxygen extraction fraction and cerebral metabolic rate of oxygen measured by positron emission tomography with 15O-labelled carbon dioxide or water, carbon monoxide and oxygen: a multicentre study in Japan. Eur J Nucl Med Mol Imaging. 2004; 31:635–43. https://doi.org/10.1007/s00259-003-1430-8 [PubMed]
- 59. Sourbron S, Ingrisch M, Siefert A, Reiser M, Herrmann K. Quantification of cerebral blood flow, cerebral blood volume, and blood-brain-barrier leakage with DCE-MRI. Magn Reson Med. 2009; 62:205–17. https://doi.org/10.1002/mrm.22005 [PubMed]
- 60. Brickman AM, Zahra A, Muraskin J, Steffener J, Holland CM, Habeck C, Borogovac A, Ramos MA, Brown TR, Asllani I, Stern Y. Reduction in cerebral blood flow in areas appearing as white matter hyperintensities on magnetic resonance imaging. Psychiatry Res. 2009; 172:117–20. https://doi.org/10.1016/j.pscychresns.2008.11.006 [PubMed]
- 61. Duvernoy HM, Delon S, Vannson JL. Cortical blood vessels of the human brain. Brain Res Bull. 1981; 7:519–79. https://doi.org/10.1016/0361-9230(81)90007-1 [PubMed]
- 62. Bouhrara M, Alisch J, Nikkita N, Kim R, Rejimon A, Cortina L, Qian W, Ferrucci L, Renick S, Richard R. Association of cerebral blood flow with myelin content in cognitively unimpaired adults BMJ Neurology Open. 2020; 2:e000053. https://doi.org/10.1136/bmjno-2020-000053
- 63. Dean DC 3rd, Hurley SA, Kecskemeti SR, O’Grady JP, Canda C, Davenport-Sis NJ, Carlsson CM, Zetterberg H, Blennow K, Asthana S, Sager MA, Johnson SC, Alexander AL, Bendlin BB. Association of amyloid pathology with myelin alteration in preclinical Alzheimer disease. JAMA Neurol. 2017; 74:41–49. https://doi.org/10.1001/jamaneurol.2016.3232 [PubMed]
- 64. Zonneveld HI, Loehrer EA, Hofman A, Niessen WJ, van der Lugt A, Krestin GP, Ikram MA, Vernooij MW. The bidirectional association between reduced cerebral blood flow and brain atrophy in the general population. J Cereb Blood Flow Metab. 2015; 35:1882–87. https://doi.org/10.1038/jcbfm.2015.157 [PubMed]
- 65. Chen JJ, Salat DH, Rosas HD. Complex relationships between cerebral blood flow and brain atrophy in early Huntington’s disease. Neuroimage. 2012; 59:1043–51. https://doi.org/10.1016/j.neuroimage.2011.08.112 [PubMed]
- 66. Shock N. Normal Human Aging: The Baltimore Longitudinal Study of Aging. Journal of Gerontology. 1985; 40:767–74. https://doi.org/10.1093/geronj/40.6.767
- 67. Ferrucci L. The baltimore longitudinal study of aging (BLSA): a 50-year-long journey and plans for the future. J Gerontol A Biol Sci Med Sci. 2008; 63:1416–19. https://doi.org/10.1093/gerona/63.12.1416 [PubMed]
- 68. Jenkinson M, Beckmann CF, Behrens TE, Woolrich MW, Smith SM. Fsl. Neuroimage. 2012; 62:782–90. https://doi.org/10.1016/j.neuroimage.2011.09.015 [PubMed]
- 69. Benjamini Y. Discovering the false discovery rate. Journal of the Royal Statistical Society: Series B (Statistical Methodology). 2010; 72:405–16. https://doi.org/10.1111/j.1467-9868.2010.00746.x
- 70. Benjamini Y, Hochberg Y. Controlling the False Discovery Rate: A Practical and Powerful Approach to Multiple Testing. Journal of the Royal Statistical Society: Series B (Methodological). 1995; 57:289–300. https://doi.org/10.1111/j.2517-6161.1995.tb02031.x