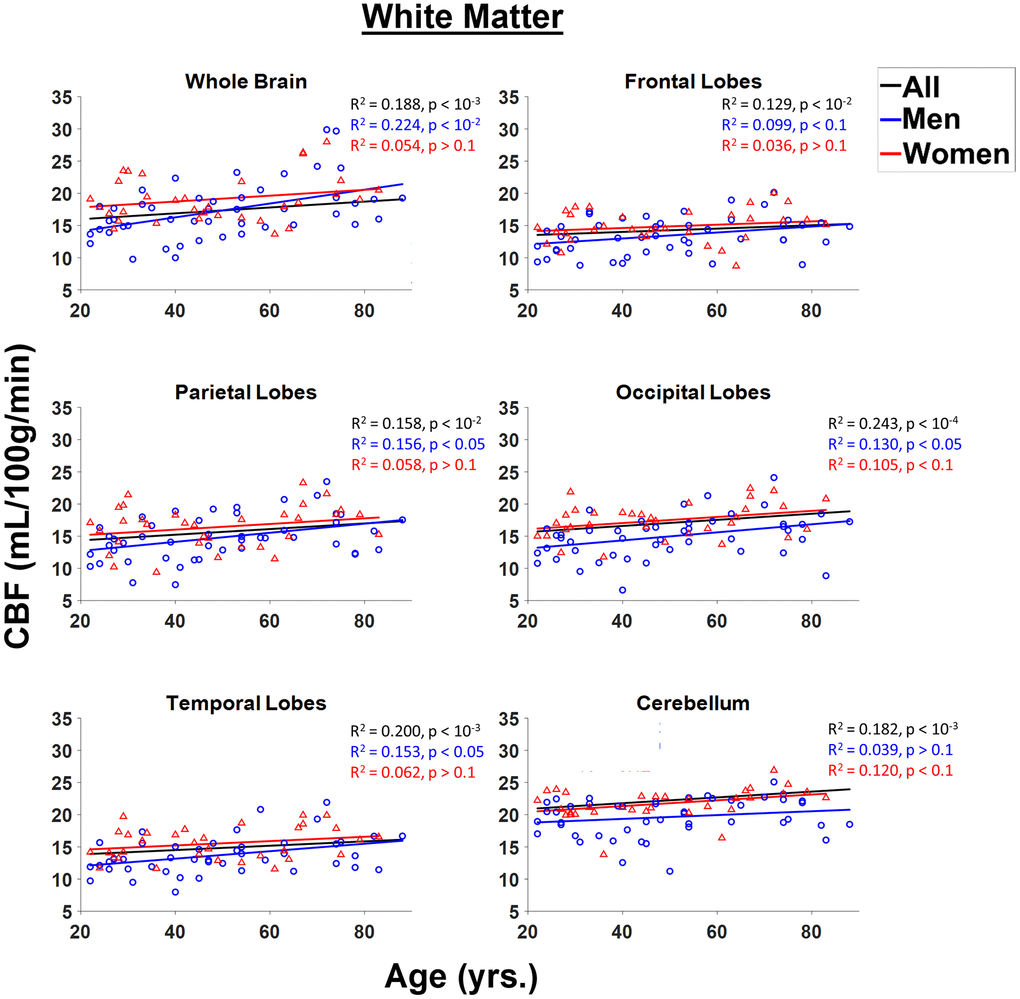
Figure 4.Regressions of CBF values obtained from NESMA-filtered ASL images with age and sex shown for the six white matter (WM) regions investigated. For each structure, the coefficient of determination, R2, and p-value, obtained after FDR correction, are reported. Most regions investigated showed linearly increasing CBF with age. This trend is more pronounced for men (blue) as compared to women (red).