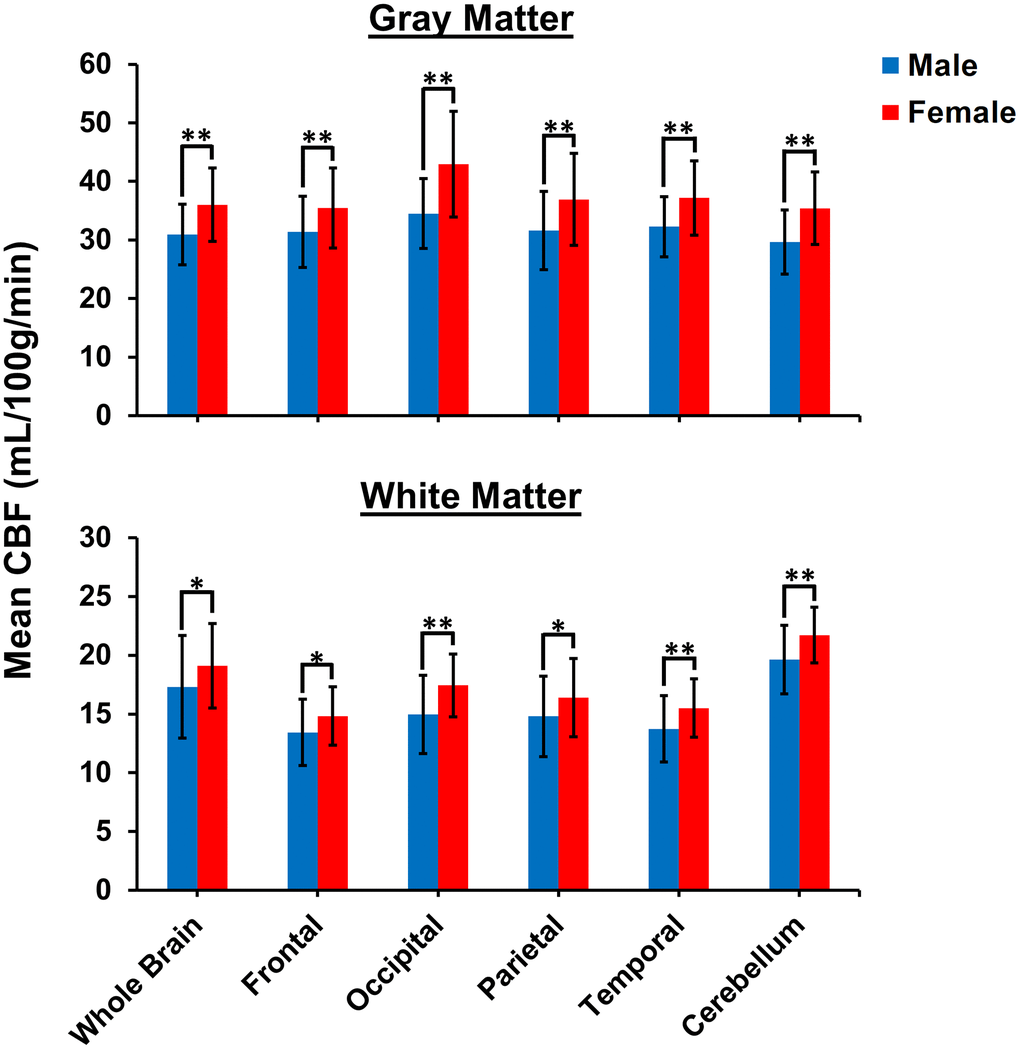
Figure 3.Comparison of mean CBF values obtained from NESMA-filtered ASL images for men and women in the indicated GM and WM regions. Mean CBF values for women are overall significantly greater than mean CBF values for men.
Figure 3 — Sex and age-related differences in cerebral blood flow investigated using pseudo-continuous arterial spin labeling magnetic resonance imaging | Aging