


Introduction
Kidney transplantation is the optimal therapy for end-stage renal disease (ESRD) [1]. Immunosuppressive therapy after kidney transplantation has significantly improved allograft survival time [2]. However, the mean time of deceased-donor transplants was only 8.8 years [3]. Antibody-mediated rejection (ABMR) considerably increases allograft mortality, and remains the main reason for the failure of kidney transplants, and the return of kidney transplant recipients to dialysis [4, 5]. However, no reliable metrics have been identified that can predict incidence of ABMR in kidney allograft recipients prior to transplantation.
Mitochondrial DNA (mtDNA) is double-stranded DNA located in the mitochondrial matrix that encodes several proteins [6, 7]. When mitochondria are damaged, mtDNA will fragment, and then go into the cytosol and subsequently enter the systemic circulation [8]. It was reported that mtDNA a predictive biomarker of acute kidney injury (AKI) [9, 10]. Ischemic-reperfusion injury causes the release of mtDNA, which can elicit an immune response [11]. Studies have shown that mtDNA can induce cell-mediated immune rejection after kidney transplantation, mtDNA-derived mHAg plays a role in rejection [12]. In our previous study, donor plasma mitochondrial DNA (dmtDNA) level was associated with posttransplant renal allograft function [13]. However, no results were found referring to the relationship between dmtDNA levels and acute rejection (AR) in renal allograft recipients.
In this study, we assessed the association between dmtDNA levels and AR based on the findings of our previous studies. We hypothesized that higher dmtDNA levels are associated with greater risk of AR post-transplantation.
Results
Study cohort
The study flowchart was showed in Figure 1. One hundred and sixty-seven donors and 323 recipients were included. According to the exclusion criteria, 89 donors and 161 recipients remained. The basic characteristics of donors and recipients are shown in Tables 1, 2.
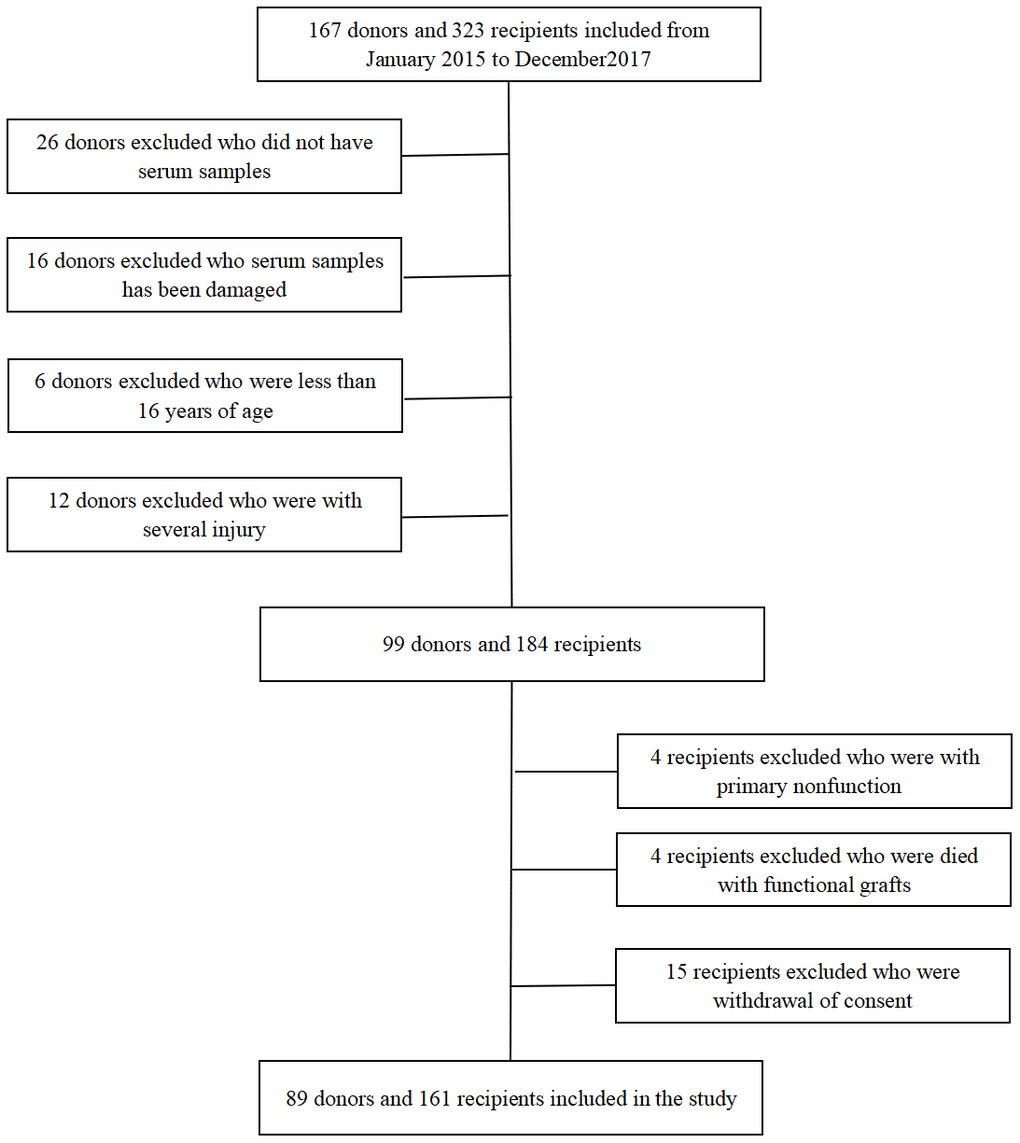
Figure 1. Flow chart for kidney donors and recipients enrolled in the study.
Table 1. Deceased-donor characteristics, stratified by AR.
| Characteristic | All(n=161) | Normal recipient(n=143) | AR(n=18) | P value | |||||||||||||||||||||||||||||||||||||||||||||||||||||||||||||||||||||||||||||||||||||||||||||||
| Age (years) | 43.1±12.6 | 43.1±13.1 | 42.1±9.7 | 0.75 | |||||||||||||||||||||||||||||||||||||||||||||||||||||||||||||||||||||||||||||||||||||||||||||||
| Male sex | 109(67.7) | 98(68.5) | 11(61.1) | 0.53 | |||||||||||||||||||||||||||||||||||||||||||||||||||||||||||||||||||||||||||||||||||||||||||||||
| BMI (kg/m2) | 23[21.25,25.0] | 23.0[21.2,25.0] | 23.2[21.8,23.9] | 0.934 | |||||||||||||||||||||||||||||||||||||||||||||||||||||||||||||||||||||||||||||||||||||||||||||||
| Hypertension | 67(41.6) | 56(39.2) | 11(61.1) | 0.075 | |||||||||||||||||||||||||||||||||||||||||||||||||||||||||||||||||||||||||||||||||||||||||||||||
| Cause of death | 0.313 | ||||||||||||||||||||||||||||||||||||||||||||||||||||||||||||||||||||||||||||||||||||||||||||||||||
| Head trauma | 52(32.3) | 47(32.9) | 5(27.8) | ||||||||||||||||||||||||||||||||||||||||||||||||||||||||||||||||||||||||||||||||||||||||||||||||
| Stroke | 64(39.8) | 54(37.8) | 10(55.6) | ||||||||||||||||||||||||||||||||||||||||||||||||||||||||||||||||||||||||||||||||||||||||||||||||
| Other | 45(27.9) | 42(29.3) | 3(16.6) | ||||||||||||||||||||||||||||||||||||||||||||||||||||||||||||||||||||||||||||||||||||||||||||||||
| Admission SCr, mg/dl | 0.77[0.32,1.40] | 0.68[0.32,1.39] | 1.27[1.03,1.91] | 0.007 | |||||||||||||||||||||||||||||||||||||||||||||||||||||||||||||||||||||||||||||||||||||||||||||||
| Terminal SCr, mg/dl | 1.69[1.06,3.04] | 1.64[1.04,2.98] | 2.48[2.25,3.99] | 0.003 | |||||||||||||||||||||||||||||||||||||||||||||||||||||||||||||||||||||||||||||||||||||||||||||||
| Extended criteria donor | 53(32.9) | 49(34.2) | 4(22.2) | 0.305 | |||||||||||||||||||||||||||||||||||||||||||||||||||||||||||||||||||||||||||||||||||||||||||||||
| Use of any vasoactive drugs | 142(88.2) | 127(88.8) | 15(83.3) | 0.497 | |||||||||||||||||||||||||||||||||||||||||||||||||||||||||||||||||||||||||||||||||||||||||||||||
| No. of vasoactive agents used | 2[1,2] | 2[1,2] | 2[1,2.25] | 0.302 | |||||||||||||||||||||||||||||||||||||||||||||||||||||||||||||||||||||||||||||||||||||||||||||||
| Plasma dmtDNA | 0.062[0.028,0.127] | 0.055[0.027,0.109] | 0.164[0.097,0.195] | 0.001 | |||||||||||||||||||||||||||||||||||||||||||||||||||||||||||||||||||||||||||||||||||||||||||||||
| Continuous variables according to Shapiro test, if P>0.05 the data are expressed as mean±SD, otherwise, the data are expressed as median[P25,P75]; Categorical variables are described by total numbers and percentages. Continuous variables were compared using ANOVA or Kruskal-Wallis tests and categorical variables were compared using the c2 test and Fisher’s exact test. | |||||||||||||||||||||||||||||||||||||||||||||||||||||||||||||||||||||||||||||||||||||||||||||||||||
| Abbreviations: BMI: body mass index; SCr: serum creatinine; dmtDNA: donor mitochondrial DNA; ANOVA: analysis of variance; AR: acute rejection. | |||||||||||||||||||||||||||||||||||||||||||||||||||||||||||||||||||||||||||||||||||||||||||||||||||
Table 2. Recipient characteristics, stratified by AR.
| Characteristic | All(n=161) | Normal recipient(n=143) | AR(n=18) | P value | |||||||||||||||||||||||||||||||||||||||||||||||||||||||||||||||||||||||||||||||||||||||||||||||
| Age, years | 43.9±11.29 | 44.08±11.49 | 42.5±9.69 | 0.577 | |||||||||||||||||||||||||||||||||||||||||||||||||||||||||||||||||||||||||||||||||||||||||||||||
| Male sex | 106(65.8) | 94(65.7) | 12(66.7) | 0.937 | |||||||||||||||||||||||||||||||||||||||||||||||||||||||||||||||||||||||||||||||||||||||||||||||
| Cause of ESRD | 0.001 | ||||||||||||||||||||||||||||||||||||||||||||||||||||||||||||||||||||||||||||||||||||||||||||||||||
| Hypertension | 21(13.1) | 12(8.4) | 9(50) | ||||||||||||||||||||||||||||||||||||||||||||||||||||||||||||||||||||||||||||||||||||||||||||||||
| Diabetes | 15(9.3) | 13(9.1) | 2(11.1) | ||||||||||||||||||||||||||||||||||||||||||||||||||||||||||||||||||||||||||||||||||||||||||||||||
| GN | 30(18.6) | 27(18.9) | 3(16.7) | ||||||||||||||||||||||||||||||||||||||||||||||||||||||||||||||||||||||||||||||||||||||||||||||||
| PKD | 5(3.1) | 5(3.5) | 0(0) | ||||||||||||||||||||||||||||||||||||||||||||||||||||||||||||||||||||||||||||||||||||||||||||||||
| Others | 90(55.9) | 86(60.1) | 4(22.2) | ||||||||||||||||||||||||||||||||||||||||||||||||||||||||||||||||||||||||||||||||||||||||||||||||
| Mode of dialysis | 0.115 | ||||||||||||||||||||||||||||||||||||||||||||||||||||||||||||||||||||||||||||||||||||||||||||||||||
| HD | 112(69.6) | 98(68.5) | 14(77.8) | ||||||||||||||||||||||||||||||||||||||||||||||||||||||||||||||||||||||||||||||||||||||||||||||||
| PD | 47(29.2) | 44(30.8) | 3(16.7) | ||||||||||||||||||||||||||||||||||||||||||||||||||||||||||||||||||||||||||||||||||||||||||||||||
| HD+PD | 2(1.2) | 1(0.7) | 1(5.5) | ||||||||||||||||||||||||||||||||||||||||||||||||||||||||||||||||||||||||||||||||||||||||||||||||
| Dialysis duration, mo | 14[5,26] | 14[5,26] | 13.5[6.5,29.25] | 0.569 | |||||||||||||||||||||||||||||||||||||||||||||||||||||||||||||||||||||||||||||||||||||||||||||||
| Warm ischemia time, min | 10[5,12] | 13[10,16] | 12[10,14] | 0.931 | |||||||||||||||||||||||||||||||||||||||||||||||||||||||||||||||||||||||||||||||||||||||||||||||
| Cold ischemia time, h | 4[2,6] | 6[2,6] | 5[3,7.25] | 0.117 | |||||||||||||||||||||||||||||||||||||||||||||||||||||||||||||||||||||||||||||||||||||||||||||||
| Number of HLA mismatches | 3[2,4] | 3[2,4] | 2[2,3] | 0.057 | |||||||||||||||||||||||||||||||||||||||||||||||||||||||||||||||||||||||||||||||||||||||||||||||
| Panel reactive antibody | 0.884 | ||||||||||||||||||||||||||||||||||||||||||||||||||||||||||||||||||||||||||||||||||||||||||||||||||
| 0% | 123(76.4) | 109(76.2) | 14(77.8) | ||||||||||||||||||||||||||||||||||||||||||||||||||||||||||||||||||||||||||||||||||||||||||||||||
| 1%-10% | 38(23.6) | 34(23.8) | 4(22.2) | ||||||||||||||||||||||||||||||||||||||||||||||||||||||||||||||||||||||||||||||||||||||||||||||||
| Induction regimen | 0.820 | ||||||||||||||||||||||||||||||||||||||||||||||||||||||||||||||||||||||||||||||||||||||||||||||||||
| ATG | 131(81.4) | 116(81.1) | 15(83.3) | ||||||||||||||||||||||||||||||||||||||||||||||||||||||||||||||||||||||||||||||||||||||||||||||||
| Basiliximab | 30(18.6) | 27(18.9) | 3(16.7) | ||||||||||||||||||||||||||||||||||||||||||||||||||||||||||||||||||||||||||||||||||||||||||||||||
| CNI | 0.601 | ||||||||||||||||||||||||||||||||||||||||||||||||||||||||||||||||||||||||||||||||||||||||||||||||||
| Cyclosporin | 30(18.6) | 26(18.1) | 4(22.2) | ||||||||||||||||||||||||||||||||||||||||||||||||||||||||||||||||||||||||||||||||||||||||||||||||
| Tacrolimus | 110(68.3) | 99(69.3) | 11(61.1) | ||||||||||||||||||||||||||||||||||||||||||||||||||||||||||||||||||||||||||||||||||||||||||||||||
| mTOR inhibitor | 21(13.1) | 18(12.6) | 3(16.7) | 0.628 | |||||||||||||||||||||||||||||||||||||||||||||||||||||||||||||||||||||||||||||||||||||||||||||||
| Steroid | 161 | 143 | 18 | ||||||||||||||||||||||||||||||||||||||||||||||||||||||||||||||||||||||||||||||||||||||||||||||||
| Number of graft loss | 20(12.4) | 10(6.9) | 10(55.6) | 0.001 | |||||||||||||||||||||||||||||||||||||||||||||||||||||||||||||||||||||||||||||||||||||||||||||||
| Continuous variables according to the Shapiro test, if P > 0.05, the data are expressed as mean ± SD; otherwise data are expressed as median[P25,P75]; categorical variables are described by numbers and percentages (%). Continuous variables were compared using ANOVA or Kruskal–Wallis tests, categorical variables were compared using the χ2 test and Fisher’s exact test. | |||||||||||||||||||||||||||||||||||||||||||||||||||||||||||||||||||||||||||||||||||||||||||||||||||
| ESRD, end-stage renal disease; GN, glomerulonephritis; PKD, polycystic kidney disease; HD, hemodialysis; PD, peritoneal dialysis; HLA, human leukocyte antigen; ANOVA, analysis of variance; CNI, calcineurin inhibitor. AR: acute rejection. | |||||||||||||||||||||||||||||||||||||||||||||||||||||||||||||||||||||||||||||||||||||||||||||||||||
Plasma dmtDNA level is correlated with post-transplant DGF
Of the 161 recipients, 23 (14.3%) recipients developed DGF. The average dmtDNA level in the DGF group was significantly higher than that in the IGF group (0.187 versus 0.067, p<0.001) (Figure 2A). The area under the receiver operating characteristic (ROC) curve of dmtDNA for the prediction score was 0.898 (95% confidence interval [CI] 0.827-0.968, p<0.001). The sensitivity and specificity of the prediction scores value were 82.6% and 86.2%, respectively based on the optimal prediction score cutoff value ≥0.133 (Figure 2B). When the dmtDNA level was >0.133, the probability of DGF in the recipient was 50%. The diagnostic performance of the dmtDNA level was higher than that of the donor admission SCr level (AUC=0.491, 95% CI 0.334-0.648, p=0.899) and the terminal SCr level (AUC=0.784, 95% CI 0.690-0.879, p<0.001) (Figure 2C, 2D).
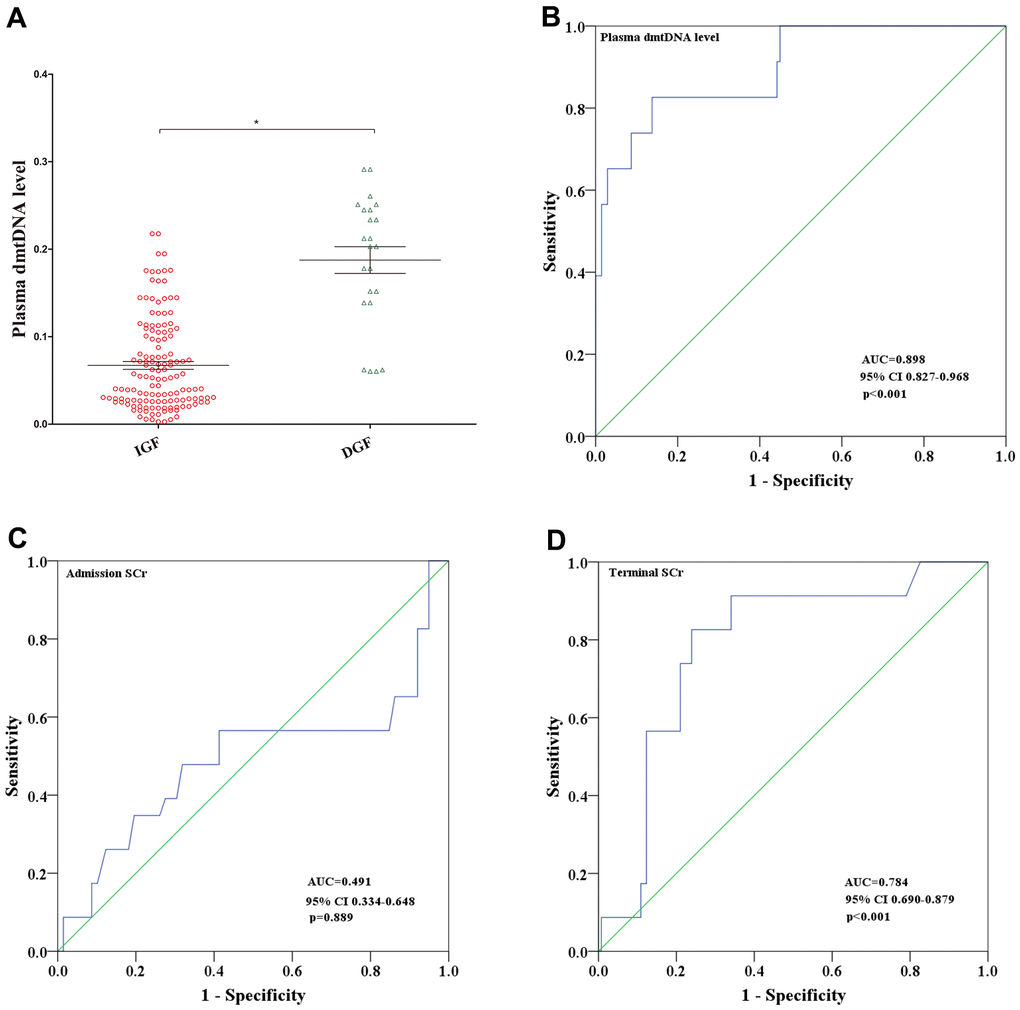
Figure 2. (A) Distribution of plasma dmtDNA in the delayed graft function (DGF) (n=23) and immediate graft function (IGF) (n=138) groups. (B–D) The receiver operating characteristic (ROC) curves of plasma dmtDNA (B), donor admission serum creatinine levels (C), and donor terminal serum creatinine levels (D).
Plasma dmtDNA level is correlated with acute rejection
A total of 18 (11.2%) recipients had AR. The level of dmtDNA in AR group was higher than normal group (0.156 versus 0.075, p<0.001) (Figure 3A). When the dmtDNA was > 0.0748, the probability of AR was 23.5%. However, if the dmtDNA level was >0.156, the probability of AR was 62.9%. Logistic regression analysis to evaluate the relationship between plasma dmtDNA and acute rejection (AR) in Table 3. dmtDNA level and induction therapy with anti-thymocyte globulin were correlated with AR (odds ratio (OR)=4.522, 95% CI3.041-6.934, p<0.001; OR=0.041, 95% CI 0.002-1.072, p=0.057, respectively). A multivariate logistic regression analysis showed that the plasma dmtDNA level was also correlated with AR (OR=1.588, 95% CI 1.337-4.561, p<0.001).
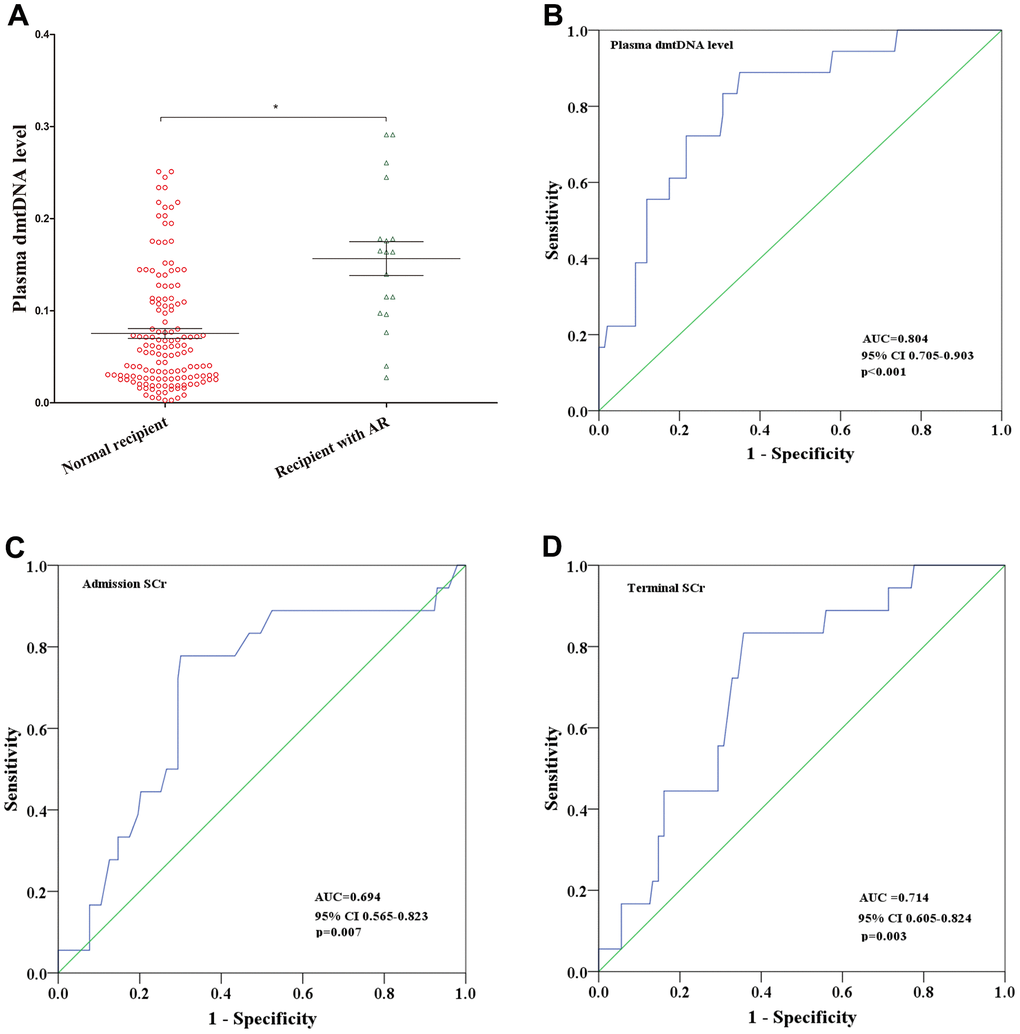
Figure 3. (A) Distribution of plasma dmtDNA in the normal recipient (n=143) and acute rejection (AR) (n=18) groups. (B–D) The receiver operating characteristic (ROC) curves of plasma dmtDNA (B), donor admission serum creatinine levels (C), and donor terminal serum creatinine levels (D).
Table 3. Univariate and multivariate logistic regression analyses for the predictors of AR.
| Univariate | Multivariate | ||||||||||||||||||||||||||||||||||||||||||||||||||||||||||||||||||||||||||||||||||||||||||||||||||
| OR | 95%CI | P value | OR | 95%CI | P value | ||||||||||||||||||||||||||||||||||||||||||||||||||||||||||||||||||||||||||||||||||||||||||||||
| Donor age (years) | 0.980 | 0.926-1.037 | 0.488 | ||||||||||||||||||||||||||||||||||||||||||||||||||||||||||||||||||||||||||||||||||||||||||||||||
| Donor sex (women) | 0.304 | 0.058-1.591 | 0.158 | ||||||||||||||||||||||||||||||||||||||||||||||||||||||||||||||||||||||||||||||||||||||||||||||||
| Donor BMI (kg/m2) | 0.866 | 0.663-1.132 | 0.293 | ||||||||||||||||||||||||||||||||||||||||||||||||||||||||||||||||||||||||||||||||||||||||||||||||
| Donor cause of death | 0.755 | 0.367-1.556 | 0.447 | ||||||||||||||||||||||||||||||||||||||||||||||||||||||||||||||||||||||||||||||||||||||||||||||||
| Donor terminal SCr (mg/ml) | 1.448 | 0.878-2.388 | 0.147 | ||||||||||||||||||||||||||||||||||||||||||||||||||||||||||||||||||||||||||||||||||||||||||||||||
| Warm ischemia time (min) | 0.943 | 0.830-1.072 | 0.372 | ||||||||||||||||||||||||||||||||||||||||||||||||||||||||||||||||||||||||||||||||||||||||||||||||
| Cold ischemia time (h) | 1.019 | 0.854-1.216 | 0.832 | ||||||||||||||||||||||||||||||||||||||||||||||||||||||||||||||||||||||||||||||||||||||||||||||||
| Induction therapy (ATG) | 0.041 | 0.002-1.072 | 0.057 | ||||||||||||||||||||||||||||||||||||||||||||||||||||||||||||||||||||||||||||||||||||||||||||||||
| Recipient age (years) | 0.987 | 0.930-1.048 | 0.675 | ||||||||||||||||||||||||||||||||||||||||||||||||||||||||||||||||||||||||||||||||||||||||||||||||
| Recipient sex (women) | 0.656 | 0.167-2.585 | 0.656 | ||||||||||||||||||||||||||||||||||||||||||||||||||||||||||||||||||||||||||||||||||||||||||||||||
| Mode of dialysis | 1.072 | 0.256-4.487 | 0.924 | ||||||||||||||||||||||||||||||||||||||||||||||||||||||||||||||||||||||||||||||||||||||||||||||||
| Duration of dialysis before transplantation (mo) | 1.014 | 0.991-1.039 | 0.240 | ||||||||||||||||||||||||||||||||||||||||||||||||||||||||||||||||||||||||||||||||||||||||||||||||
| HLA mismatch | 0.614 | 0.337-1.119 | 0.111 | ||||||||||||||||||||||||||||||||||||||||||||||||||||||||||||||||||||||||||||||||||||||||||||||||
| PRA | 5.599 | 0.312-10.612 | 0.243 | ||||||||||||||||||||||||||||||||||||||||||||||||||||||||||||||||||||||||||||||||||||||||||||||||
| Plasma dmtDNA | 4.522 | 3.041-6.934 | 0.001 | 1.588 | 1.337-4.561 | 0.001 | |||||||||||||||||||||||||||||||||||||||||||||||||||||||||||||||||||||||||||||||||||||||||||||
| Multivariate logistic regression analysis was performed with a backward selection procedure. | |||||||||||||||||||||||||||||||||||||||||||||||||||||||||||||||||||||||||||||||||||||||||||||||||||
| Abbreviation: BMI: body mass index; SCr: serum creatinine; CI: confidence interval; OR: odds ratio. HLA, human leukocyte antigen; PRA: panel reactive antibody; ATG: Anti-thymocyte globulin; SD: Standard deviation. | |||||||||||||||||||||||||||||||||||||||||||||||||||||||||||||||||||||||||||||||||||||||||||||||||||
The diagnostic value of dmtDNA levels, admission SCr levels, and terminal SCr levels for prediction of AR were assessed using ROC curve analysis. The ROC curve analysis indicated that plasma dmtDNA levels could diagnose AR (AUC=0.804, 95% CI 0.705-0.903, p<0.001) when compared with admission SCr and terminal SCr levels (AUC=0.694, 95% CI 0.565-0.823, p=0.007; AUC=0.714, 95% CI 0.605-0.824, p=0.003) (Figure 3C, 3D). The maximum Youden-J indices showed that the sensitivity was 88.9%, and specificity was 69%, with the cutoff value for the dmtDNA level ≥0.0748.
Plasma dmtDNA levels show a good diagnostic value for ABMR
Of the 18 recipients diagnosed with AR, 10 (55.6%) recipients were diagnosed with ABMR, 8 of 10 recipients were DSA positive, and 8 (44.4%) recipients were diagnosed with TCMR. dmtDNA level in the ABMR group was significantly higher than TCMR group (0.185 versus 0.099, p=0.032) (Figure 4A). We then conducted ROC curve analysis to obtain the prediction score for dmtDNA levels with regard to ABMR, AUC=0.910 (95% CI 0.843-0.977, p<0.001) (Figure 4B). According to the optimal prediction score cutoff value for the dmtDNA level ≥0.139, the sensitivity and specificity were 92% and 82.1%, respectively.
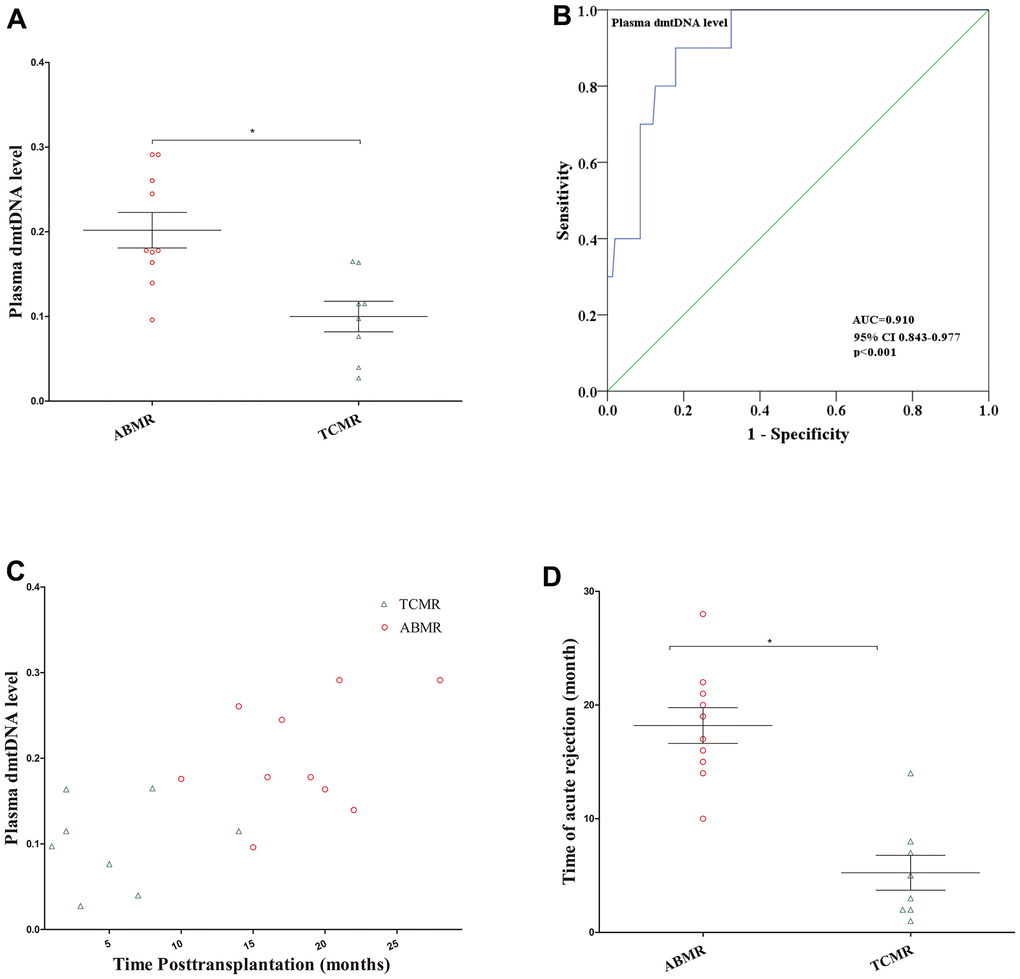
Figure 4. (A) Distribution of plasma dmtDNA in the antibody-mediated rejection (ABMR) (n=10) and T cell-mediated rejection (TCMR) (n=8) groups. (B) The receiver operating characteristic curve indicating the different donor performance characteristics between patients with ABMR and non-ABMR. (C) The time point of diagnosis of ABMR and TCMR post-transplantation (months). (D) The time point of patients with ABMR was significantly higher than that in TCMR group.
Additionally, we found that the time to diagnose ABMR post-transplantation is later than that of TCMR. Most ABMR occurs one year after transplantation, but most TCMR occurs within one year (Figure 4C). The average time for 10 recipients to be diagnosed with ABMR was 18.2 months, while the average time for 8 patients to be diagnosed TCMR was 5.25 months (p<0.001) (Figure 4D).
Plasma dmtDNA level is correlated with allograft survival
The average follow-up time for the 161 recipients was 44 [38,49] months. Of these 161 recipients, no one lost follow-up, and 20 of them experienced graft loss. dmtDNA level in the graft loss group was significantly higher than the graft survival group (0.146 versus 0.076, p<0.001) (Figure 5A).
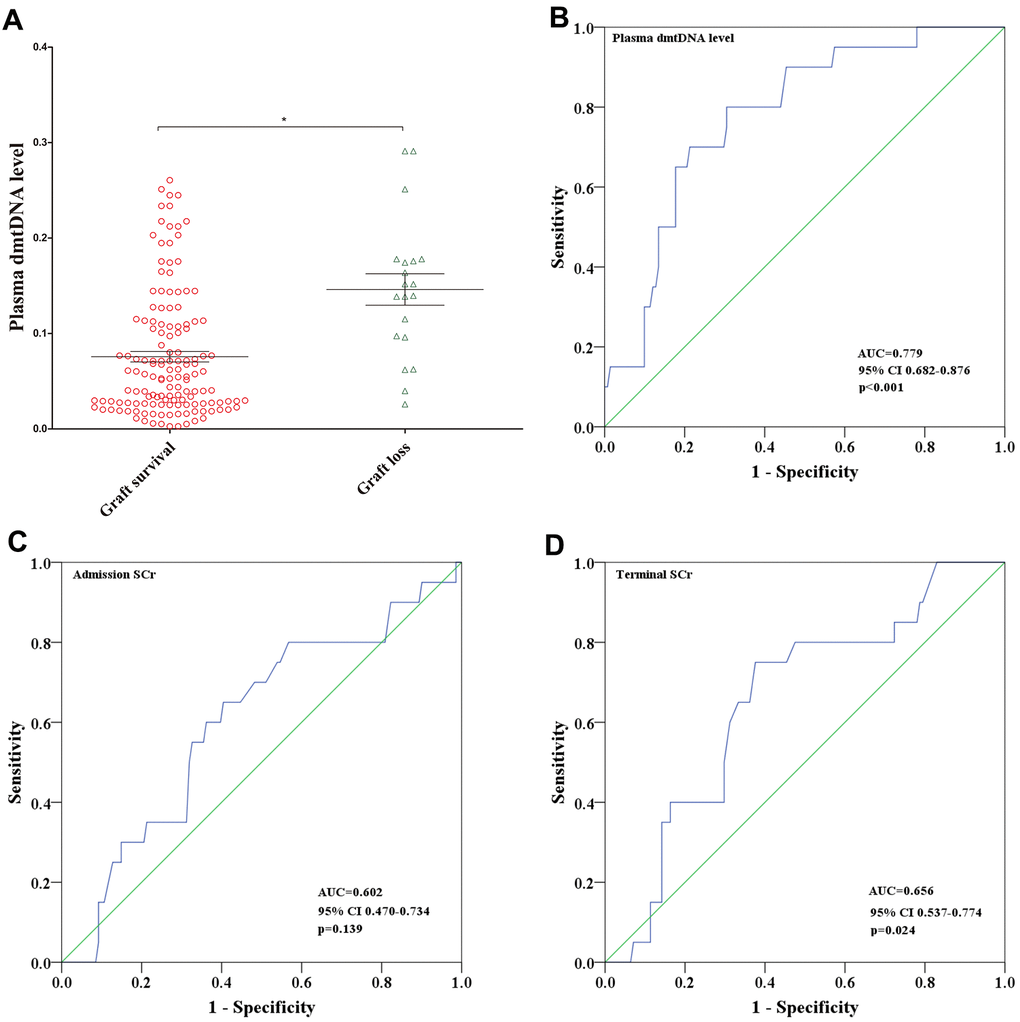
Figure 5. (A) Distribution of plasma dmtDNA in graft survival (n=141) and graft loss (n=20) groups. (B–D) The receiver operating characteristic (ROC) curves of plasma dmtDNA (B), donor admission serum creatinine levels (C), and donor terminal serum creatinine levels (D).
ROC curve analysis showed that the prediction score for dmtDNA levels was 0.779 (95% CI 0.682-0.876, p<0.001) (Figure 5B). According to the maximum Youden-J indices, the optimal prediction score cutoff value of the dmtDNA was ≥0.092, with the sensitivity and specificity of 80% and 69.5%, respectively. We also conducted ROC curve analysis to obtain the prediction score for the donor admission SCr and terminal SCr levels; the terminal SCr level (AUC=0.656, 95% CI 0.537-0.774, p=0.024) showed lower diagnostic value compared with the dmtDNA level (Figure 5C), but the donor admission SCr level showed no statistically significant difference for prediction of graft survival (AUC=0.602, 95%CI 0.470-0.734, p=0.139) (Figure 5D).
We then divided the recipients into 2 groups according to the cutoff value of 0.092, and categorized the two groups as the low plasma dmtDNA group (n=102) and the high plasma dmtDNA group (n=59). Figure 6A shows that low dmtDNA group was with longer allograft survival time (96.1% versus 72.9%, p<0.001).
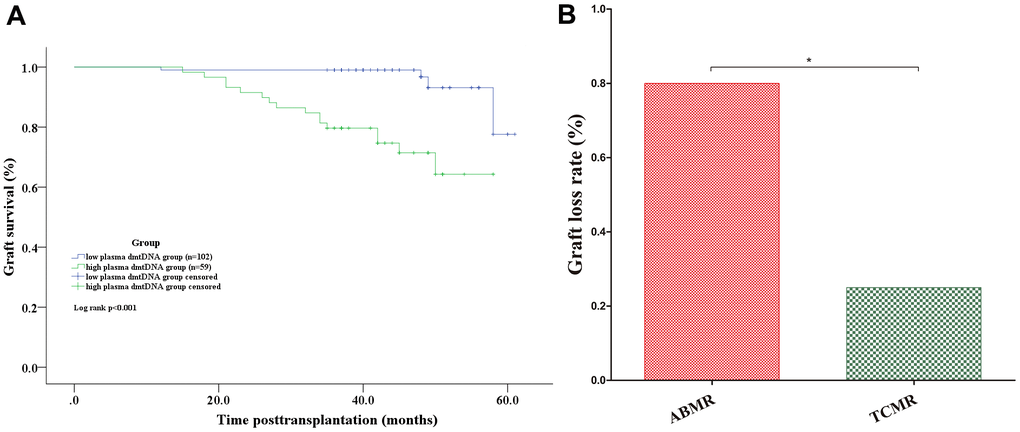
Figure 6. (A) Graft survival analyses. Kaplan-Meier curves for graft survival according to whether the donor plasma dmtDNA level was >0.092. (B) The graft loss rate in the ABMR group was significantly higher than that of the TCMR group. ABMR: antibody-mediated rejection; TCMR: T cell-mediated rejection.
Among the recipients who lost the allograft, 50% were diagnosed with AR. Of the 10 recipients diagnosed with ABMR, 8 recipients lost the allograft. However, of the 8 recipients diagnosed with TCMR, only 2 recipients lost their allografts (80% versus 33.3%, p=0.031) (Figure 6B).
Discussion
As far as we know, this is the first study to elaborate the association of dmtDNA levels with ABMR. dmtDNA have been suggested as a potentially sensitive biomarker for monitoring ABMR and graft survival post-transplantation. The higher the dmtDNA level, the greater the probability of ABMR and the shorter the survival time of the allograft.
Consistent with our previous findings, the dmtDNA level is an effective indicator for predicting the occurrence of DGF after transplantation. When certain organs are damaged, mtDNA can be released from injured cells into circulation [14, 15]. A number of studies have shown that circulating mtDNA is elevated in various disease conditions, including diabetic retinopathy [16], AKI [17], trauma [18], and patient mortality in the intensive care unit [19]. DGF is a common complication following a transplant procedure, and is associated with a negative impact on clinical outcomes. A systematic review showed that recipients with DGF had a 41% increased risk of graft loss [20]. Our previous study also found that DGF is an independent risk factor for graft survival in recipients with ECD kidneys [21]. mtDNA levels have been confirmed as a predictive marker of AKI, and correlate with severity of renal dysfunction in chronic kidney injury [22]. In this study, dmtDNA confirmed as an independent risk factor for DGF. When the dmtDNA level was >0.133, the probability of DGF in the recipients was 50%. Another study has shown that urinary mtDNA levels are significantly associated with DGF short-term post-transplant renal function, acute rejection of the graft biopsy [23]. Therefore, dmtDNA could be a new noninvasive predictor of DGF, this finding is of great significance for application in the clinical setting.
Plasma dmtDNA levels may be the first biomarker that can reliably predict AR prior to undergoing a transplant. The use of immunosuppressive therapy after kidney transplantation has significantly improved allograft survival, but nearly 50% recipients will lose their allograft within 10 years due to AR [2, 4, 5]. A study that included 315 allograft recipients who underwent indication biopsies found that 64% of recipients lost their allografts due to AR [4]. In this study, a total of 18 (11.2%) recipients diagnosed with AR, with the average follow-up time for the 161 recipients being 43.5±8.5 months. The incidence of AR in this study is similar to that reported in other studies [24, 25]. When the dmtDNA level was > 0.0748, the probability of AR was 23.5%. However, when the dmtDNA level was >0.156, the probability of AR was 62.9%. Result showed that the dmtDNA level was an independent risk factor for AR, when the dmtDNA level was >0.0748, the odds ratio for AR was 1.588. Similar to the findings in this study, another recent study showed that donor-derived cell-free DNA levels were increased in the recipient’s blood when the allograft had developed AR [26]. We believe that the dmtDNA level has a higher predictive value than that of cell free DNA, and is a reliable predictive marker prior to transplantation, which lends the dmtDNA level greater clinical value. Many factors that can lead to AR, including HLA mismatch and cold ischemia time. Studies have shown that that DGF is an important risk factor for AR [27]. When the kidney is damaged, plasma dmtDNA levels increase, which may be accompanied by more antigen exposure, resulting in increased AR incidence. In contrast, increased dmtDNA levels may not only trigger inflammation, but may also lead to AR [28, 29]. Elevated dmtDNA levels are an independent risk factor not only for DGF, but also for AR.
Interestingly, the diagnostic value of the dmtDNA level for predicting ABMR is notably higher than for AR and TCMR. Of the 18 recipients diagnosed with AR, 10 were diagnosed with ABMR, and 8 were diagnosed with TCMR. The level of dmtDNA in the ABMR group was significantly higher than TCMR group. The prediction score of the dmtDNA level for ABMR was up to 0.910. When the dmtDNA level was >0.185, the probability of ABMR was 23.5%. Most instances of ABMR occurred one year after transplantation, whereas TCMR occurred within one year. There are many factors that contribute to TCMR, but the main reason is the lack of immunosuppressive therapy in the early postoperative period. Early TCMR responds well to treatment [30], and it is therefore believed that TCMR can be reversed and stabilized [31]. ABMR can arise for a variety of reasons, such as a history of transplantation, blood transfusions, or polytocous pregnancy [32, 33]. Donor-specific antibodies play pivotal roles during ABMR, and the incidence of DSA ranges from 20 to 30% post-transplantation [34]. The allograft function of recipients in the high-level dmtDNA group may be more susceptible to other damage such as drugs toxicity, which increases the probability of antigen exposure, thereby increasing the probability of DSA and development of ABMR. Therefore, we recommend that patients with high levels of dmtDNA should receive increased treatment with immunosuppressive drugs after transplantation.
Our study has several limitations that should be noted. This is a retrospective cohort study, and the number of recipients with AR is relatively low. This will have some impact on the results and conclusions of the study. To address this limitation, we are carrying out a prospective randomized multi-center clinical trial and have registered on the Chinese Clinical Trial Registry in order to verify our results from this study.
We conclude that the plasma dmtDNA level may be the first biomarker identified as a reliable predictor of AR prior to transplantation, especially for development of ABMR. dmtDNA is correlated with graft survival.
Materials and Methods
Study design
This was a retrospective open cohort study that enrolled 167 donors and 323 recipients from January 2015 to December 2017 at the Third Affiliated Hospital of Sun Yet-sen University. The exclusive criteria of donors were as following: (1) did not have serum samples, (2) were <16 years of age at the time donation, (3) provided serum samples were damaged, (4) had multiple injuries. The exclusive criteria of recipients were as following: (1) the allograft was primary nonfunction, (2) died with functional grafts, (3) withdrew consent. This study was approved by the Human Organ Transplantation and Ethics Committee of Sun Yat-sen University [13]. All experimental procedures were described in our previous study [13, 35, 36].
Data sources
We obtained most of donor data from COTRS, and some patient information was obtained from OPO’s charts. ECD donors were defined as being older than 60 years and donors aged 50-59 years with two of the following three characteristics: (1) cerebrovascular accident as cause of death, (2)history of systemic hypertension, and (3) terminal serum creatinine concentration >1.5 mg/dL [37].
We obtained recipient data from medical records, and early graft function after transplantation was classified as immediate graft function (IGF) and delayed graft function (DGF). DGF was defined as recipients who presented with a creatinine reduction ratio (CRR) ≤70% and required dialysis from day 0 to day 7 post-transplantation. IGF was defined as recipients who presented with a CRR >70% one week post-transplantation [38].
Donor blood samples were obtained from donors before organ procurement as previously described. The samples were treated as our previous study described [13].
Measurement of relative donor mitochondrial DNA levels
As described in previous studies, plasma mtDNA levels were determined via quantitative real-time polymerase chain reaction (qPCR) [13, 39, 40]. All samples were assayed in a 96-well plate using a SLAN-96S Real-Time PCR System (ZEESAN, Xiamen, China). The same negative control and calibrator cDNA samples were used for each plate, and the samples were reanalyzed if the cycle threshold (Ct) value was >35 or the amplification curve was abnormal.
Histopathology
Recipient underwent indication biopsies serum when creatinine increase >20% from baseline. Surveillance biopsies were performed at 3 months post-transplantation, unless the patient had surgical contraindications. For allograft punctures, 18-gauge needles were used and obtained 1-2 cores for pathological testing. All biopsies were processed and analyzed by the pathology laboratory, according to the Banff criteria for preparation of paraffin-embedded sections and grading [41]. C4d-negative Antibody-mediated rejection (ABMR) was defined as: positive for donor-specific antibodies (DSA), non-diffuse C4d staining, and any of the following microcirculation lesions: glomerulitis (g > 0), thromboses and transplant glomerulopathy (cg > 0), or peritubular capillaritis (ptc >0) [42].
Statistical analysis
The Mann-Whitney U test was used to compare the differences between two independent groups for nonnormally distributed variables, and Student’s t test was used to test whether there is a difference between two groups on a continuous dependent variable. Pearson Chi-square test or Fisher’s exact test was used to assess the percentage for categorical variables.
The diagnostic value of dmtDNA and serum creatinine levels with respect to prediction of AR, ABMR, and graft survival were evaluated in ROC curve analyses. Youden’s index is often used in conjunction with ROC analysis [43]. Statistical analysis was carried out using the IBM SPSS statistics version 20.0.
Author Contributions
Q.Q.S. and N.N., F.H. designed the study, conducted all analyses, interpreted data, prepared and reviewed the article. The statistical analysis was conducted by L.L.Z. and F.H. The laboratory assays were conducted by N.C. and N.N.Z. Q.P.S. Data collection were conducted by Z.Y.H, H.L. and T.L., M.L.M. The article was edited by Z.H.L. and L.Q.H. All authors have read and approved the manuscript.
Conflicts of Interest
The authors declare no conflicts of interest.
Funding
This study was supported by the National Key R&D Program of China (2018YFA0108804), the National Natural Science Foundation of China (No. 81970650, 81770753), and the Youth Program of National Natural Science Foundation of China (No. 81800661), the Fundamental Research Funds for the Central Universities(20ykpy34), China Postdoctoral Science Foundation Funded Project(2020M683083).
References
- 1. Abecassis M, Bartlett ST, Collins AJ, Davis CL, Delmonico FL, Friedewald JJ, Hays R, Howard A, Jones E, Leichtman AB, Merion RM, Metzger RA, Pradel F, et al. Kidney transplantation as primary therapy for end-stage renal disease: a national kidney foundation/kidney disease outcomes quality initiative (NKF/KDOQITM) conference. Clin J Am Soc Nephrol. 2008; 3:471–80. https://doi.org/10.2215/CJN.05021107 [PubMed]
- 2. Eckardt KU, Kasiske BL. Kidney Disease: Improving Global Outcomes (KDIGO) Transplant Work Group. KDIGO clinical practice guideline for the care of kidney transplant recipients. Am J Transplant. 2009 (Suppl 3); 9:S1–S155. https://doi.org/10.1111/j.1600-6143.2009.02834.x
- 3. Lamb KE, Lodhi S, Meier-Kriesche HU. Long-term renal allograft survival in the United States: a critical reappraisal. Am J Transplant. 2011; 11:450–62. https://doi.org/10.1111/j.1600-6143.2010.03283.x [PubMed]
- 4. Sellarés J, de Freitas DG, Mengel M, Reeve J, Einecke G, Sis B, Hidalgo LG, Famulski K, Matas A, Halloran PF. Understanding the causes of kidney transplant failure: the dominant role of antibody-mediated rejection and nonadherence. Am J Transplant. 2012; 12:388–99. https://doi.org/10.1111/j.1600-6143.2011.03840.x [PubMed]
- 5. Kaplan B, Meier-Kriesche HU. Death after graft loss: an important late study endpoint in kidney transplantation. Am J Transplant. 2002; 2:970–74. https://doi.org/10.1034/j.1600-6143.2002.21015.x [PubMed]
- 6. Ballinger SW, Patterson C, Knight-Lozano CA, Burow DL, Conklin CA, Hu Z, Reuf J, Horaist C, Lebovitz R, Hunter GC, McIntyre K, Runge MS. Mitochondrial integrity and function in atherogenesis. Circulation. 2002; 106:544–49. https://doi.org/10.1161/01.cir.0000023921.93743.89 [PubMed]
- 7. Andrews RM, Kubacka I, Chinnery PF, Lightowlers RN, Turnbull DM, Howell N. Reanalysis and revision of the Cambridge reference sequence for human mitochondrial DNA. Nat Genet. 1999; 23:147. https://doi.org/10.1038/13779 [PubMed]
- 8. Wenceslau CF, McCarthy CG, Szasz T, Spitler K, Goulopoulou S, Webb RC, and Working Group on DAMPs in Cardiovascular Disease. Mitochondrial damage-associated molecular patterns and vascular function. Eur Heart J. 2014; 35:1172–77. https://doi.org/10.1093/eurheartj/ehu047 [PubMed]
- 9. Whitaker RM, Stallons LJ, Kneff JE, Alge JL, Harmon JL, Rahn JJ, Arthur JM, Beeson CC, Chan SL, Schnellmann RG. Urinary mitochondrial DNA is a biomarker of mitochondrial disruption and renal dysfunction in acute kidney injury. Kidney Int. 2015; 88:1336–44. https://doi.org/10.1038/ki.2015.240 [PubMed]
- 10. Hu Q, Ren J, Wu J, Li G, Wu X, Liu S, Wang G, Gu G, Ren H, Hong Z, Li J. Urinary mitochondrial DNA levels identify acute kidney injury in surgical critical illness patients. Shock. 2017; 48:11–17. https://doi.org/10.1097/SHK.0000000000000830 [PubMed]
- 11. Zhang Q, Raoof M, Chen Y, Sumi Y, Sursal T, Junger W, Brohi K, Itagaki K, Hauser CJ. Circulating mitochondrial DAMPs cause inflammatory responses to injury. Nature. 2010; 464:104–07. https://doi.org/10.1038/nature08780 [PubMed]
- 12. Kwak HH, Park KM, Teotia PK, Lee GS, Lee ES, Hong SH, Yang SR, Park SM, Ahn C, Park CK, Lee KW, Woo HM. Acute rejection after swine leukocyte antigen-matched kidney allo-transplantation in cloned miniature pigs with different mitochondrial DNA-encoded minor histocompatibility antigen. Transplant Proc. 2013; 45:1754–60. https://doi.org/10.1016/j.transproceed.2013.02.103 [PubMed]
- 13. Han F, Wan S, Sun Q, Chen N, Li H, Zheng L, Zhang N, Huang Z, Hong L, Sun Q. Donor plasma mitochondrial DNA is correlated with posttransplant renal allograft function. Transplantation. 2019; 103:2347–58. https://doi.org/10.1097/TP.0000000000002598 [PubMed]
- 14. Sudakov NP, Apartsin KA, Lepekhova SA, Nikiforov SB, Katyshev AI, Lifshits GI, Vybivantseva AV, Konstantinov YM. The level of free circulating mitochondrial DNA in blood as predictor of death in case of acute coronary syndrome. Eur J Med Res. 2017; 22:1. https://doi.org/10.1186/s40001-016-0241-x [PubMed]
- 15. Yamanouchi S, Kudo D, Yamada M, Miyagawa N, Furukawa H, Kushimoto S. Plasma mitochondrial DNA levels in patients with trauma and severe sepsis: time course and the association with clinical status. J Crit Care. 2013; 28:1027–31. https://doi.org/10.1016/j.jcrc.2013.05.006 [PubMed]
- 16. Malik AN, Parsade CK, Ajaz S, Crosby-Nwaobi R, Gnudi L, Czajka A, Sivaprasad S. Altered circulating mitochondrial DNA and increased inflammation in patients with diabetic retinopathy. Diabetes Res Clin Pract. 2015; 110:257–65. https://doi.org/10.1016/j.diabres.2015.10.006 [PubMed]
- 17. Jansen MP, Pulskens WP, Butter LM, Florquin S, Juffermans NP, Roelofs JJ, Leemans JC. Mitochondrial DNA is released in urine of SIRS patients with acute kidney injury and correlates with severity of renal dysfunction. Shock. 2018; 49:301–10. https://doi.org/10.1097/SHK.0000000000000967 [PubMed]
- 18. Lo YM, Rainer TH, Chan LY, Hjelm NM, Cocks RA. Plasma DNA as a prognostic marker in trauma patients. Clin Chem. 2000; 46:319–23. https://doi.org/10.1093/clinchem/46.3.319 [PubMed]
- 19. Nakahira K, Kyung SY, Rogers AJ, Gazourian L, Youn S, Massaro AF, Quintana C, Osorio JC, Wang Z, Zhao Y, Lawler LA, Christie JD, Meyer NJ, et al. Circulating mitochondrial DNA in patients in the ICU as a marker of mortality: derivation and validation. PLoS Med. 2013; 10:e1001577. https://doi.org/10.1371/journal.pmed.1001577 [PubMed]
- 20. Yarlagadda SG, Coca SG, Formica RN
Jr , Poggio ED, Parikh CR. Association between delayed graft function and allograft and patient survival: a systematic review and meta-analysis. Nephrol Dial Transplant. 2009; 24:1039–47. https://doi.org/10.1093/ndt/gfn667 [PubMed] - 21. Han F, Lin MZ, Zhou HL, Li H, Sun QP, Huang ZY, Hong LQ, Wang G, Cai RM, Sun QQ. Delayed graft function is correlated with graft loss in recipients of expanded-criteria rather than standard-criteria donor kidneys: a retrospective, multicenter, observation cohort study. Chin Med J (Engl). 2020; 133:561–70. https://doi.org/10.1097/CM9.0000000000000666 [PubMed]
- 22. Eirin A, Saad A, Tang H, Herrmann SM, Woollard JR, Lerman A, Textor SC, Lerman LO. Urinary mitochondrial DNA copy number identifies chronic renal injury in hypertensive patients. Hypertension. 2016; 68:401–10. https://doi.org/10.1161/HYPERTENSIONAHA.116.07849 [PubMed]
- 23. Kim K, Moon H, Lee YH, Seo JW, Kim YG, Moon JY, Kim JS, Jeong KH, Lee TW, Ihm CG, Lee SH. Clinical relevance of cell-free mitochondrial DNA during the early postoperative period in kidney transplant recipients. Sci Rep. 2019; 9:18607. https://doi.org/10.1038/s41598-019-54694-x [PubMed]
- 24. Jones-Hughes T, Snowsill T, Haasova M, Coelho H, Crathorne L, Cooper C, Mujica-Mota R, Peters J, Varley-Campbell J, Huxley N, Moore J, Allwood M, Lowe J, et al. Immunosuppressive therapy for kidney transplantation in adults: a systematic review and economic model. Health Technol Assess. 2016; 20:1–594. https://doi.org/10.3310/hta20620 [PubMed]
- 25. Albano L, Banas B, Klempnauer JL, Glyda M, Viklicky O, Kamar N, and Optimising immunoSuppression After Kidney transplantation with ADVAGRAF Study Group. OSAKA trial: a randomized, controlled trial comparing tacrolimus QD and BD in kidney transplantation. Transplantation. 2013; 96:897–903. https://doi.org/10.1097/TP.0b013e3182a203bd [PubMed]
- 26. Gielis EM, Ledeganck KJ, De Winter BY, Del Favero J, Bosmans JL, Claas FH, Abramowicz D, Eikmans M. Cell-free DNA: an upcoming biomarker in transplantation. Am J Transplant. 2015; 15:2541–51. https://doi.org/10.1111/ajt.13387 [PubMed]
- 27. Wu WK, Famure O, Li Y, Kim SJ. Delayed graft function and the risk of acute rejection in the modern era of kidney transplantation. Kidney Int. 2015; 88:851–58. https://doi.org/10.1038/ki.2015.190 [PubMed]
- 28. Roedder S, Sigdel T, Hsieh SC, Cheeseman J, Metes D, Macedo C, Reed EF, Gritsch HA, Zeevi A, Shapiro R, Kirk AD, Sarwal MM. Expression of mitochondrial-encoded genes in blood differentiate acute renal allograft rejection. Front Med (Lausanne). 2017; 4:185. https://doi.org/10.3389/fmed.2017.00185 [PubMed]
- 29. Kwak HH, Park KM, Nam HS, Park SM, Woo HM. Disparate hypervariable region-1 of mitochondrial DNA did not induce skin allograft rejection in cloned porcine models. Transplant Proc. 2013; 45:1787–91. https://doi.org/10.1016/j.transproceed.2013.01.023 [PubMed]
- 30. Halloran PF, de Freitas DG, Einecke G, Famulski KS, Hidalgo LG, MengeL M, Reeve J, Sellares J, Sis B. An integrated view of molecular changes, histopathology and outcomes in kidney transplants. Am J Transplant. 2010; 10:2223–30. https://doi.org/10.1111/j.1600-6143.2010.03268.x [PubMed]
- 31. Loupy A, Vernerey D, Tinel C, Aubert O, Duong van Huyen JP, Rabant M, Verine J, Nochy D, Empana JP, Martinez F, Glotz D, Jouven X, Legendre C, Lefaucheur C. Subclinical rejection phenotypes at 1 year post-transplant and outcome of kidney allografts. J Am Soc Nephrol. 2015; 26:1721–31. https://doi.org/10.1681/ASN.2014040399 [PubMed]
- 32. Moll S, Pascual M. Humoral rejection of organ allografts. Am J Transplant. 2005; 5:2611–18. https://doi.org/10.1111/j.1600-6143.2005.01086.x [PubMed]
- 33. Gloor JM, Winters JL, Cornell LD, Fix LA, DeGoey SR, Knauer RM, Cosio FG, Gandhi MJ, Kremers W, Stegall MD. Baseline donor-specific antibody levels and outcomes in positive crossmatch kidney transplantation. Am J Transplant. 2010; 10:582–89. https://doi.org/10.1111/j.1600-6143.2009.02985.x [PubMed]
- 34. Lachmann N, Terasaki PI, Budde K, Liefeldt L, Kahl A, Reinke P, Pratschke J, Rudolph B, Schmidt D, Salama A, Schönemann C. Anti-human leukocyte antigen and donor-specific antibodies detected by luminex posttransplant serve as biomarkers for chronic rejection of renal allografts. Transplantation. 2009; 87:1505–13. https://doi.org/10.1097/TP.0b013e3181a44206 [PubMed]
- 35. World Medical Association. World Medical Association Declaration of Helsinki: ethical principles for medical research involving human subjects. JAMA. 2013; 310:2191–94. https://doi.org/10.1001/jama.2013.281053 [PubMed]
- 36. Huang J, Wang H, Fan ST, Zhao B, Zhang Z, Hao L, Huo F, Liu Y. The national program for deceased organ donation in China. Transplantation. 2013; 96:5–9. https://doi.org/10.1097/TP.0b013e3182985491 [PubMed]
- 37. Port FK, Bragg-Gresham JL, Metzger RA, Dykstra DM, Gillespie BW, Young EW, Delmonico FL, Wynn JJ, Merion RM, Wolfe RA, Held PJ. Donor characteristics associated with reduced graft survival: an approach to expanding the pool of kidney donors. Transplantation. 2002; 74:1281–86. https://doi.org/10.1097/00007890-200211150-00014 [PubMed]
- 38. Johnston O, O’Kelly P, Spencer S, Donohoe J, Walshe JJ, Little DM, Hickey D, Conlon PJ. Reduced graft function (with or without dialysis) vs immediate graft function—a comparison of long-term renal allograft survival. Nephrol Dial Transplant. 2006; 21:2270–74. https://doi.org/10.1093/ndt/gfl103 [PubMed]
- 39. Wang C, Hann HW, Hann RS, Wan S, Myers RE, Ye Z, Xing J, Yang H. Circulating mitochondrial DNA content associated with the risk of liver cirrhosis: a nested case-control study. Dig Dis Sci. 2015; 60:1707–15. https://doi.org/10.1007/s10620-015-3523-1 [PubMed]
- 40. Li L, Hann HW, Wan S, Hann RS, Wang C, Lai Y, Ye X, Evans A, Myers RE, Ye Z, Li B, Xing J, Yang H. Cell-free circulating mitochondrial DNA content and risk of hepatocellular carcinoma in patients with chronic HBV infection. Sci Rep. 2016; 6:23992. https://doi.org/10.1038/srep23992 [PubMed]
- 41. Sis B, Mengel M, Haas M, Colvin RB, Halloran PF, Racusen LC, Solez K, Baldwin WM 3rd, Bracamonte ER, Broecker V, Cosio F, Demetris AJ, Drachenberg C, et al. Banff ‘09 meeting report: antibody mediated graft deterioration and implementation of Banff working groups. Am J Transplant. 2010; 10:464–71. https://doi.org/10.1111/j.1600-6143.2009.02987.x [PubMed]
- 42. Einecke G, Sis B, Reeve J, Mengel M, Campbell PM, Hidalgo LG, Kaplan B, Halloran PF. Antibody-mediated microcirculation injury is the major cause of late kidney transplant failure. Am J Transplant. 2009; 9:2520–31. https://doi.org/10.1111/j.1600-6143.2009.02799.x [PubMed]
- 43. Schisterman EF, Perkins NJ, Liu A, Bondell H. Optimal cut-point and its corresponding Youden index to discriminate individuals using pooled blood samples. Epidemiology. 2005; 16:73–81. https://doi.org/10.1097/01.ede.0000147512.81966.ba [PubMed]