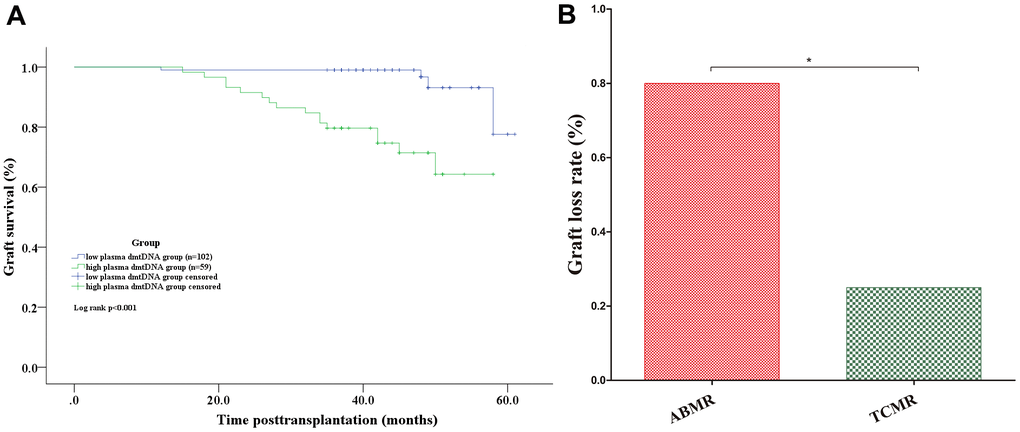
Figure 6.(A) Graft survival analyses. Kaplan-Meier curves for graft survival according to whether the donor plasma dmtDNA level was >0.092. (B) The graft loss rate in the ABMR group was significantly higher than that of the TCMR group. ABMR: antibody-mediated rejection; TCMR: T cell-mediated rejection.