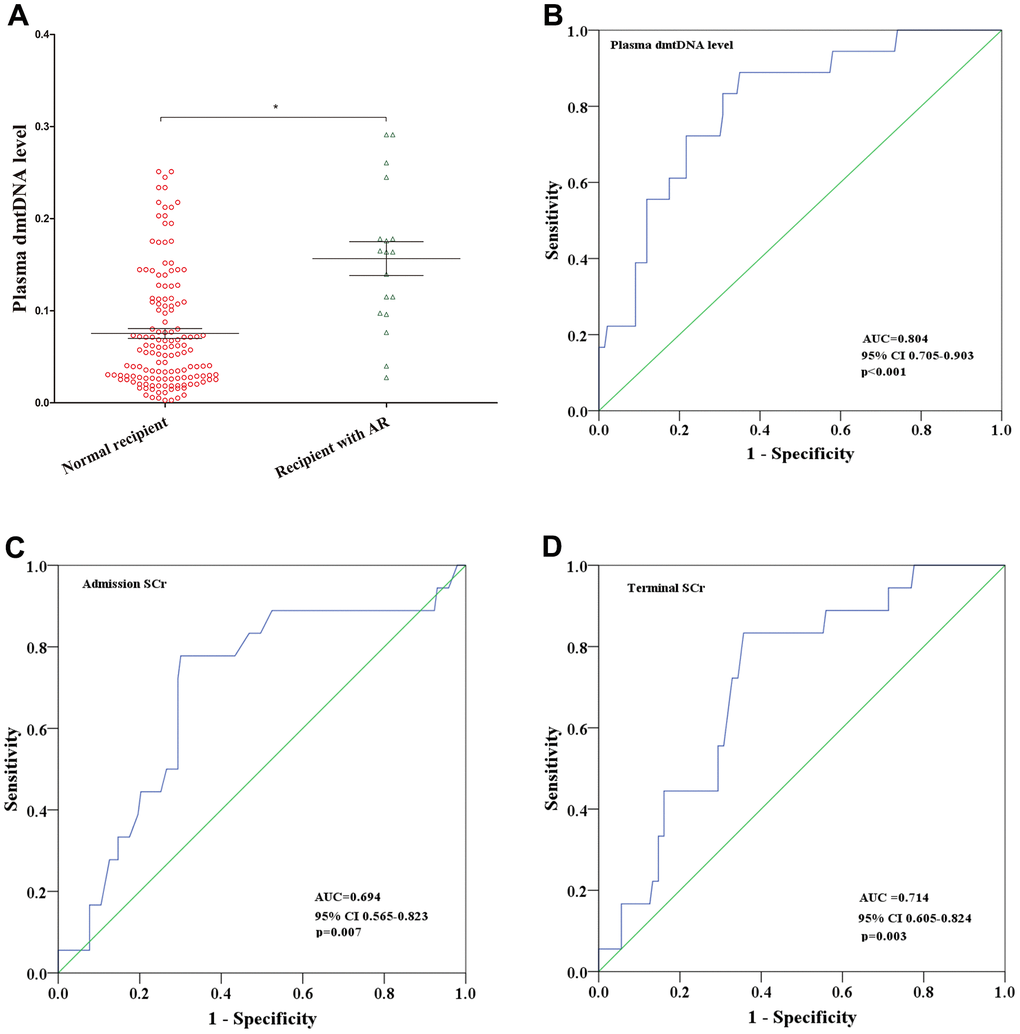
Figure 3.(A) Distribution of plasma dmtDNA in the normal recipient (n=143) and acute rejection (AR) (n=18) groups. (B–D) The receiver operating characteristic (ROC) curves of plasma dmtDNA (B), donor admission serum creatinine levels (C), and donor terminal serum creatinine levels (D).