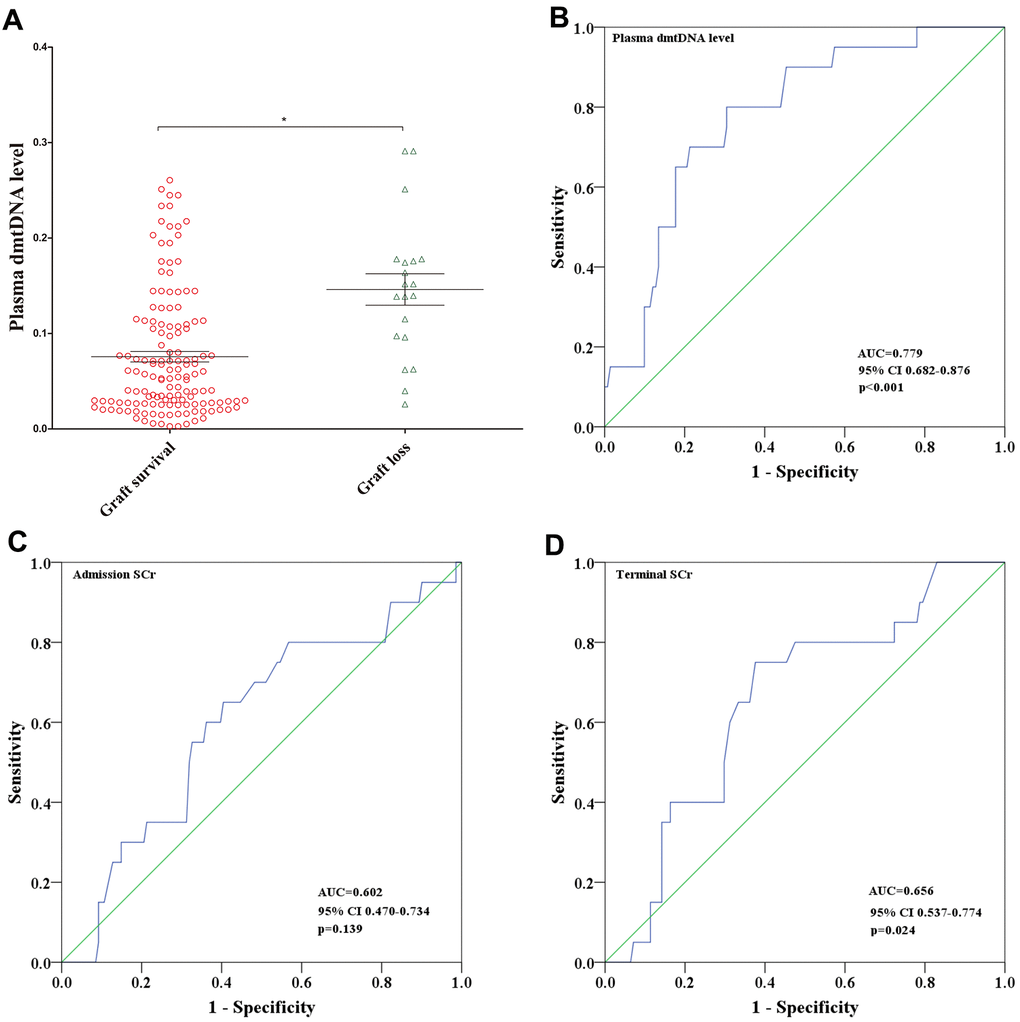
Figure 5.(A) Distribution of plasma dmtDNA in graft survival (n=141) and graft loss (n=20) groups. (B–D) The receiver operating characteristic (ROC) curves of plasma dmtDNA (B), donor admission serum creatinine levels (C), and donor terminal serum creatinine levels (D).