


Introduction
Atherosclerosis (AS) is a chronic disease characterized by lipid deposition in the vessel wall that leads to an inflammatory and proliferative cascade [1]. Myocardial infarction (MI) and stroke, the common complications of AS, represent the most common cause of death worldwide [2, 3]. Despite its epidemiological importance, the fundamental mechanisms of AS remain poorly understood and there is an urgent need to investigate the molecular pathways responsible for AS development and to identify diagnostic and prognostic biomarkers.
The immune system plays a crucial role in various stages of AS [4]. In AS, hypercholesterolemia leads to the accumulation of plasma LDL (low-density lipoprotein) in the artery wall which elicits local inflammation with an influx of monocytes that differentiate into macrophage [5]. These mononuclear phagocytes express scavenger receptors that permit them to bind lipoprotein particles and become foam cells [6]. T lymphocytes, although numerically less abundant than monocytes, also enter the intima and regulate functions of the innate immune cells as well as the endothelial cells (ECs) and smooth muscle cells (SMCs) [7, 8].
Long noncoding RNAs (lncRNAs) are a type of RNA over 200 nucleotides in length [9]. Although they do not participate in protein coding, increasing evidence has made it clear that lncRNAs can have numerous biological and molecular functions such as epigenetic regulation, signal transduction, cell differentiation, and immunoregulation [10]. Furthermore, sufficient information has demonstrated that lncRNAs can take part in the development of diverse cardiovascular diseases through interactions with microRNAs (miRNAs) or messenger RNAs (mRNAs) [11]. This competing endogenous RNA (ceRNA) hypothesis proposed by Salmena et al. has attracted increasing attention [12]. In this hypothesis, lncRNAs transcripts act as ceRNAs or natural microRNA sponges—they communicate with and co-regulate each other and mRNAs by competing for binding to shared miRNAs, a family of small non-coding RNAs that are important post-transcriptional regulators of gene expression [13]. In recent years, researchers have begun to shed light on the role of ceRNA in AS [14]. For instance, the LncRNA MIAT can sponge miR-149-5p and inhibit efferocytosis in advanced atherosclerosis through upregualting CD47 [15].
We should note that the detailed mechanism of immunoregulation during AS remains poorly understood. Besides, the role of ceRNA in immunoregulation during AS development has not been investigated. What’s more, no prognostic biomarkers based on a ceRNA immunoregulatory network have even been identified in AS. In this study (Figure 1), we constructed a ceRNA network in AS by using the method of weighted gene co-expression network analysis (WGCNA), which makes sure that the nodes are highly interconnected and that the network is highly reliable. We then conducted the immune cell infiltration analysis and constructed a macrophage related ceRNA subnetwork. Further, we identified several key factors in the subnetwork that can be prognostic biomarkers for ischemic events of AS. A nomogram based on these hub factors was then constructed. Findings from our study may contribute to the development of therapeutic targets and molecular prognostic tools in AS.
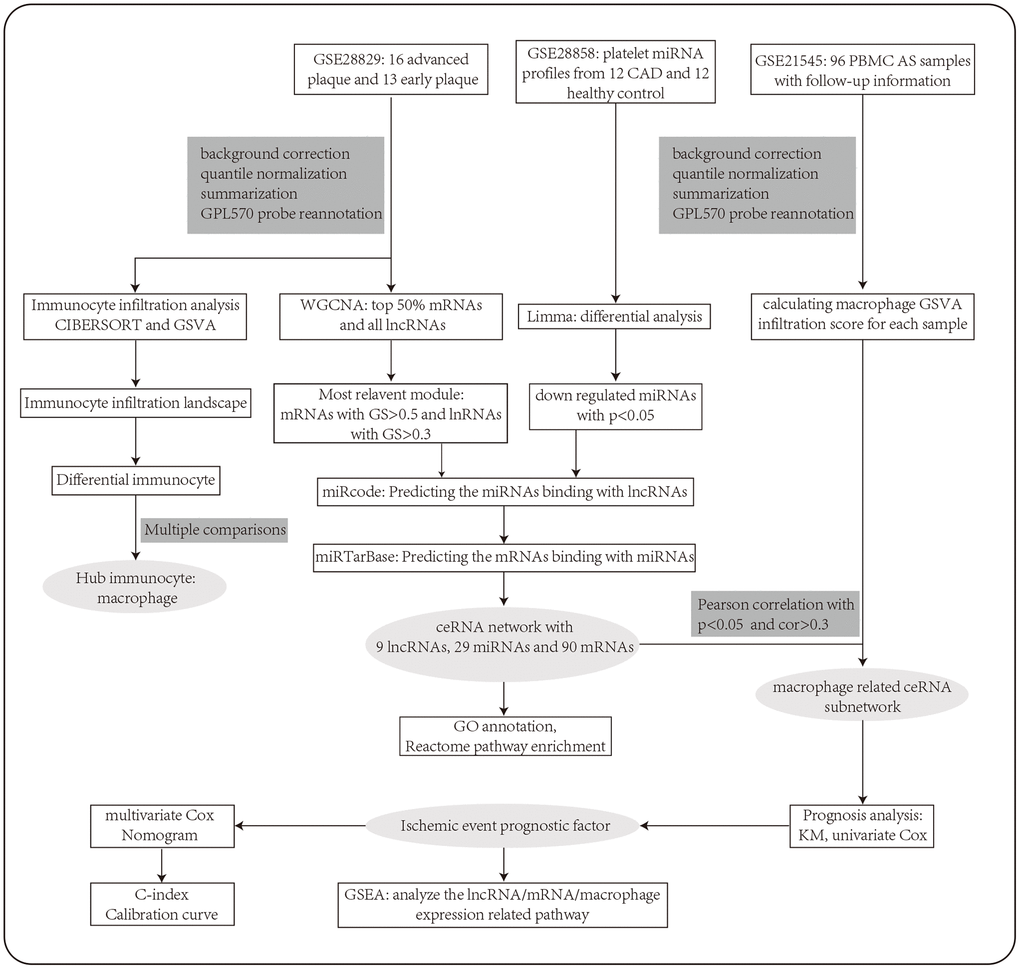
Figure 1. The workflow of the integrative bioinformatics analyses.
Results
Construction of co-expression modules and identification of key module
A β value of 10 was used to obtain the approximate scale-free topology with a scale-free topology fit index > 0.85 at the lowest power (Figure 2A). Next, dynamic tree cutting was used to produce co-expression modules and 19 modules were generated in the co-expression network (Figure 2B). The interaction and connectivity of eigengenes among different gene co-expression modules were plotted in Figure 2C. We then calculated and plotted the relation of each module with their corresponding clinical traits. From Figure 2D, we could conclude that the Red module revealed the strongest correlation (module-trait weighted correlation = 0.81, p < 0.001) with advanced atherosclerosis plaque and was identified as key module for plaque development. The significant correlation between module membership (MM) in the Red module and gene significance (GS) for an advanced plaque is presented in Figure 2E. The most significantly enriched biological process term of each module was summarized in Table 1.
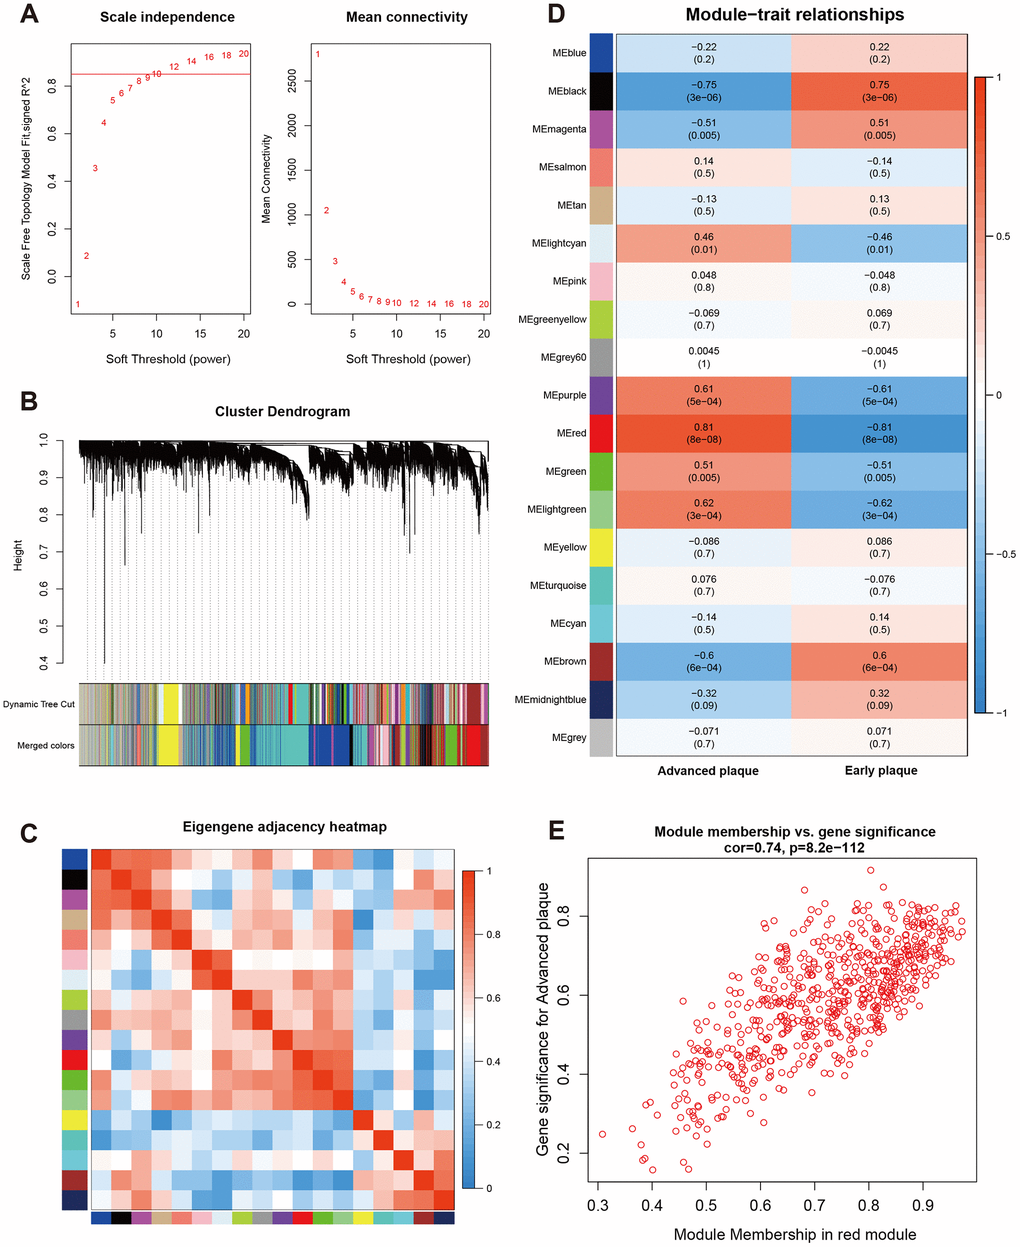
Figure 2. Construction of weighted co-expression network and module analysis. (A) Soft threshold selection process; (B) Cluster dendrogram. Each color represents one specific co-expression module. In the colored rows below the dendrogram, the two colored rows represent the original modules and merged modules; (C) Eigengene adjacency heatmap of different modules; (D) Heatmap of the correlation between status (advanced and early plaque) and module eigengenes. Each row corresponds to a module eigengene, and each column corresponds to a trait. Each cell contains the corresponding correlation (first line) and P-value (second line). The table is color-coded by correlation according to the color legend. P-value < 0.05 represents statistical significance; (E) Correlation between module membership of Red module and gene significance with advanced plaque (absolute value).
Table 1. Gene ontology biological process enrichment analysis of modules.
| model color | number of mRNAs | most significant term | p.adjusted |
| blue | 1589 | GO:0071806 protein transmembrane transport | 1.15E-03 |
| black | 363 | GO:0042659 regulation of cell fate specification | 1.07E-01 |
| magenta | 264 | GO:0048193 Golgi vesicle transport | 2.88E-01 |
| salmon | 92 | GO:0070125 mitochondrial translational elongation | 6.95E-12 |
| tan | 73 | GO:0045116 protein neddylation | 2.85E-01 |
| lightcyan | 78 | GO:0000380 alternative mRNA splicing, via spliceosome | 1.64E-01 |
| pink | 296 | GO:0010603 regulation of cytoplasmic mRNA processing body assembly | 5.66E-04 |
| greenyellow | 98 | GO:0050806 positive regulation of synaptic transmission | 1.68E-02 |
| grey60 | 67 | GO:0043062 extracellular structure organization | 1.75E-04 |
| purple | 146 | GO:0030098 lymphocyte differentiation | 4.25E-04 |
| red | 595 | GO:0042119 neutrophil activation | 1.62E-24 |
| green | 798 | GO:0010631 epithelial cell migration | 3.48E-08 |
| lightgreen | 57 | GO:2001238 positive regulation of extrinsic apoptotic signaling pathway | 2.84E-01 |
| yellow | 298 | GO:0003214 cardiac left ventricle morphogenesis | 9.64E-02 |
| turquoise | 1346 | GO:0023061 signal release | 1.04E-01 |
| cyan | 83 | GO:0043434 response to peptide hormone | 4.85E-03 |
| brown | 856 | GO:0030198 extracellular matrix organization | 1.26E-07 |
| midnightblue | 85 | GO:0008380 RNA splicing | 1.20E-04 |
| grey | 513 | GO:0010721 negative regulation of cell development | 3.17E-03 |
CeRNA network in AS plaque development
127 downregulated miRNAs were identified from GSE28858. They were sent for ceRNA construction along with lncRNAs/mRNAs with a GS > 0.3/0.5 in the Red module. Firstly, based on the miRcode database that matches potential miRNAs with lncRNAs, a total of 80 lncRNA-miRNA pairs containing 9 lncRNAs and 32 miRNAs were identified. Next, concerning the target gene predictions of the 32 miRNAs, we used the miRTarBase database and predicted 8308 miRNA-mRNA pairs, including 4327 target genes. Subsequently, we matched the predicted target gene with significant mRNAs in the Red module. Finally, we constructed a lncRNA-miRNA-mRNA network which includes 9 lncRNAs, 29 miRNAs, 90 mRNAs, and visualized them in Cytospace software (Figure 3). Through the above stringent screening and prediction protocol, the constructed ceRNA networks were therefore considered highly interconnected and may contribute to AS plaque development.
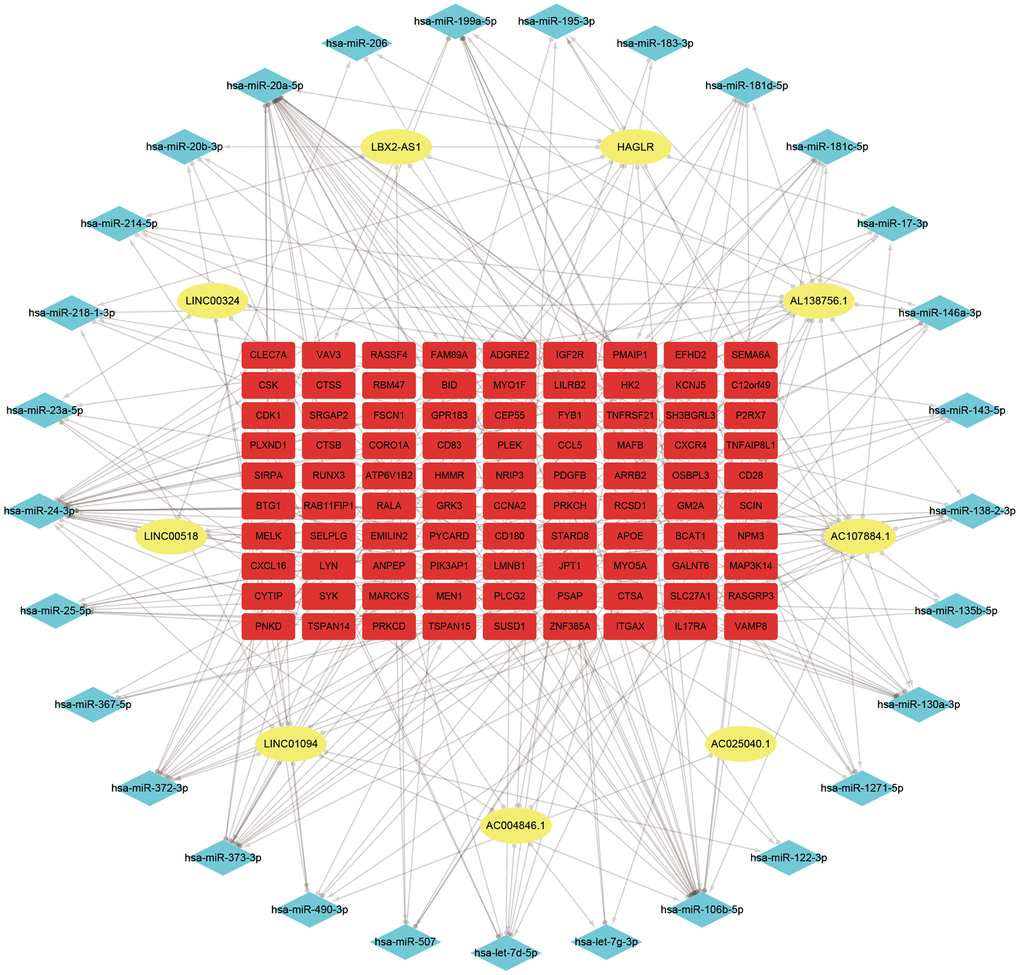
Figure 3. ceRNA network of the 9 lncRNAs, 29 miRNAs, and 90 mRNAs. Note: Blue diamond represents lncRNAs, yellow round denotes miRNAs, and red square represents mRNAs.
Enrichment analysis and PPI analysis
GO (gene ontology) annotation (BP: biological process; CC: cellular component; MF: molecular function) and Reactome pathway enrichment analyses were conducted to clarify the biological functions of the ceRNA network by inputting the list of 90 target mRNAs. As presented in Figure 4A–4C, the enriched GO annotations include positive regulation of leukocyte activation, T cell activation, mononuclear cell proliferation in the BP category; endocytic vesicle, vacuolar lumen, lysosomal lumen in the CC category; and protein tyrosine kinase activity, actin filament binding, virus receptor activity in the MF category. Figure 4D shows that the ceRNA network is significantly enriched in platelet activation, neutrophil degranulation, and phagocytosis. The above results suggested that the constructed ceRNA may play crucial roles in regulating the immune response during AS development. We also constructed a PPI network of the target genes with each pair having a combined score of > 0.4 (Figure 5), based on the STRING database.
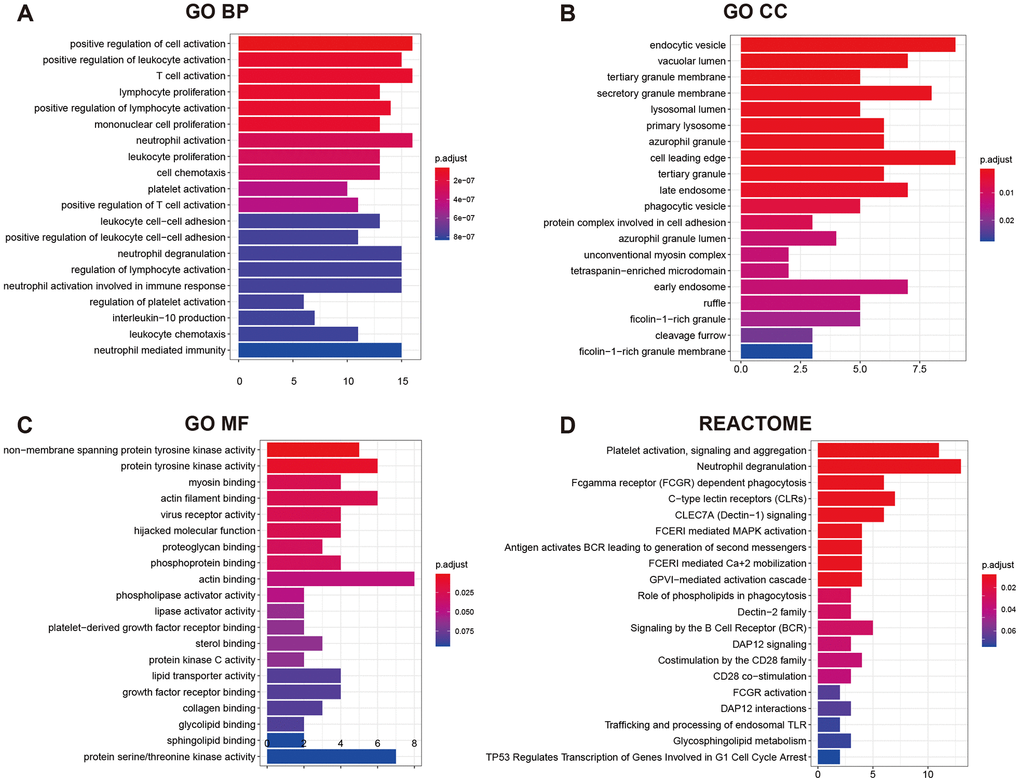
Figure 4. GO functional annotation and Reactome pathway enrichment analysis for the 90 mRNAs. (A) Top 20 enriched biological process; (B) Top 20 enriched cellular component; (C) Top 20 enriched molecular function; (D) Top 20 enriched Reactome pathway.
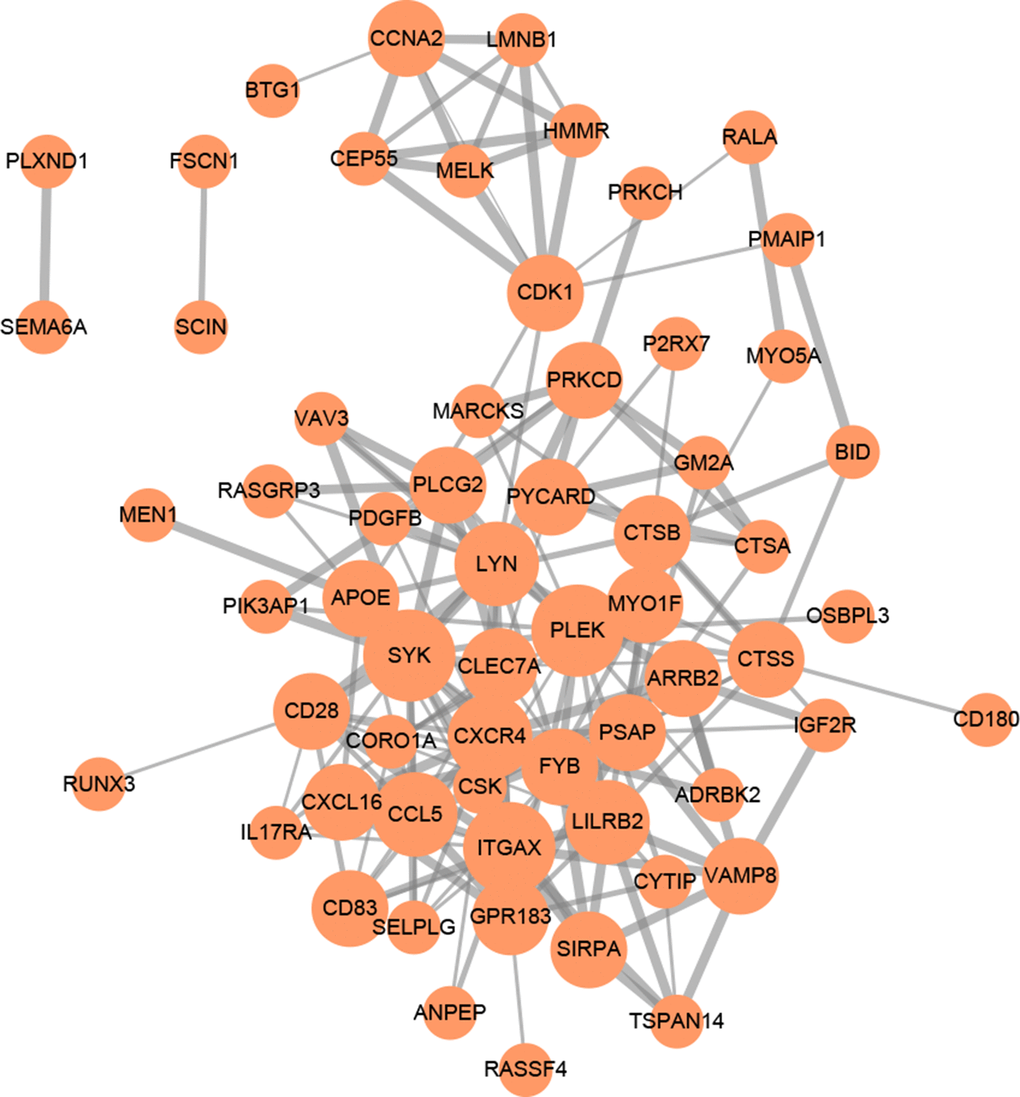
Figure 5. PPI network of 90 mRNAs based on the STRING database. Each node represents a protein-coding gene. The size of each node is mapped to its degree. Terms with a combined interaction score > 0.4 are linked by an edge (the thickness of the edge represents the interaction score).
Immunocyte subtype infiltration detection
We first detected the landscape of 22 immunocyte infiltration in 29 atherosclerosis plaques using the CIBERSORT algorithm. The top 3 abundant subtypes in carotid plaque were ‘Macrophage.M2’, ‘T.cells.CD8’, and ‘T.cells.CD4.memory.resting’ (Figure 6A). After the Wilcoxon rank test, 7 immunocytes were detected differentially infiltrated between the advanced and early group (Figure 6B). To make the results more reliable, we compared the infiltration score of 12 immune cells between two groups using the GSVA method (Figure 6D). By integrating the GSVA and CIBERSORT results, macrophage was then identified as hub immune cell as it was the only one to have similar trends from the two methods.
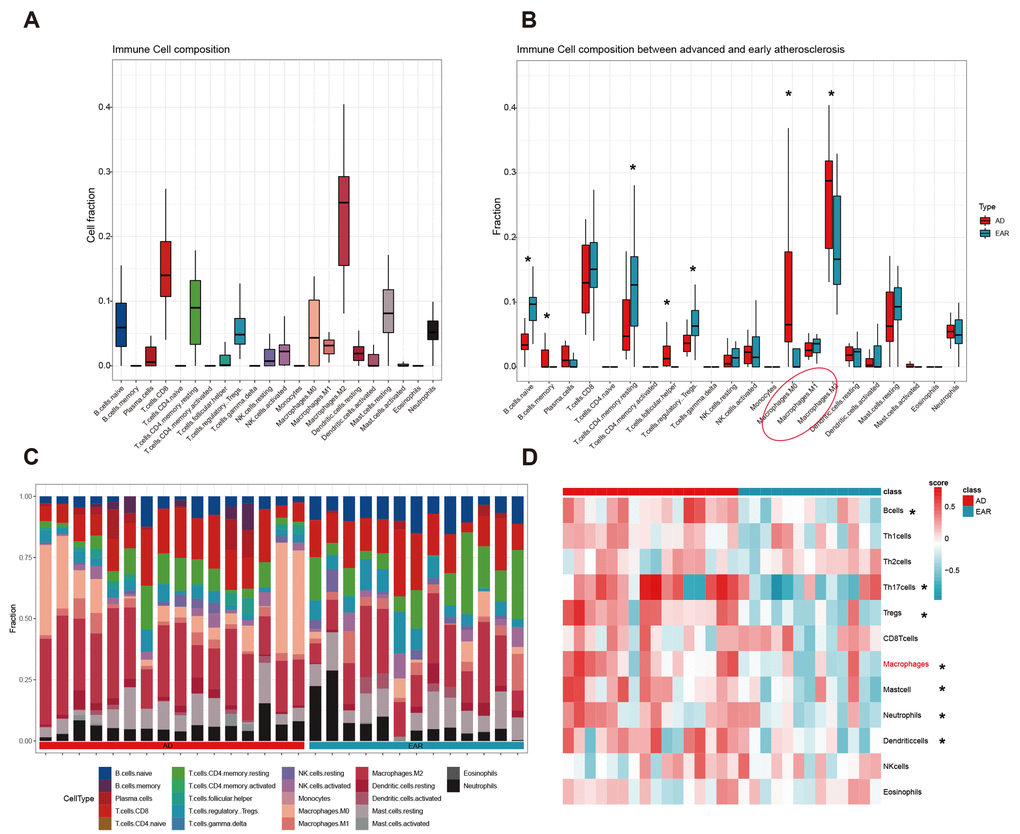
Figure 6. Immune cell infiltration analysis. (A) Cell composition analysis of the 29 plaque samples; (B) Grouped by type (advanced/early); (C) Scale histogram of immune cell fraction; (D) Heatmap of 12 immune cells GSVA score. * represents statistical significance.
Construction of macrophage related ceRNA subnetwork
We used GSE21545 to identify key genes associated with the macrophage GSVA infiltration score. After correlation analysis, 2 lncRNAs and 21 mRNAs were found to have strong correlations with macrophage infiltration (Figure 7A). We then constructed a macrophage related ceRNA subnetwork by matching the miRNA targets of the 2 lncRNAs and the 23 mRNA which led to 29 lncRNA-miRNA-mRNA pairs including 2 lncRNAs, 14 miRNAs, and 18 mRNAs (Figure 7B).
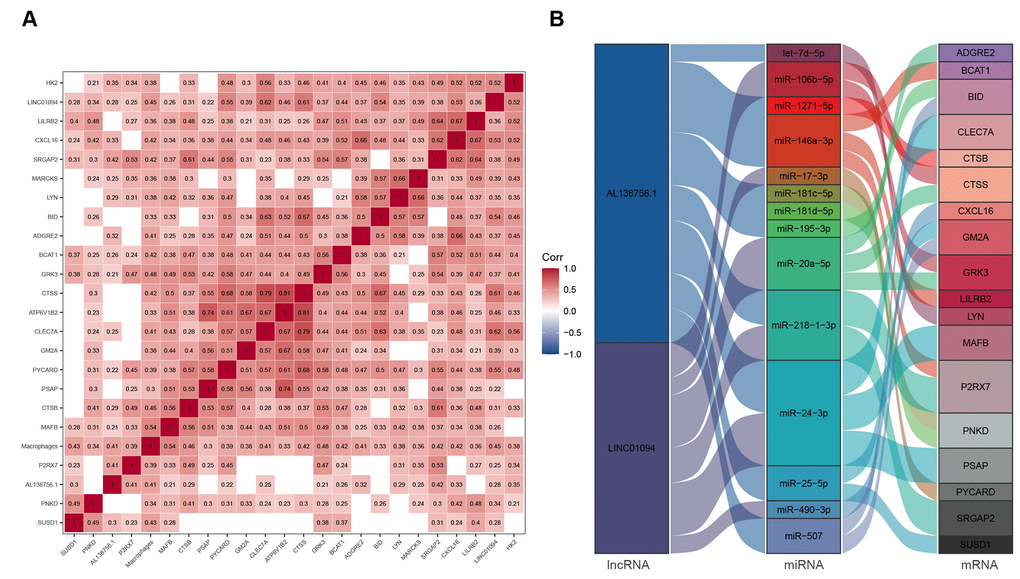
Figure 7. ceRNA network associated with macrophage infiltration score. (A) Pearson's correlation matrix; (B) Macrophage related ceRNA subnetwork. Flow indicates interaction.
Prognosis analysis of macrophage related ceRNA subnetwork
As the constructed macrophage related ceRNA subnetwork may drive atherosclerosis plaque development and rupture, we then investigated their prognostic value to ischemic events. Univariate Cox regression analysis was used to identify the correlation between factors in the subnetwork and ischemic events. Through univariate Cox analysis, CTSB, macrophage GSVA score, AL138756.1, MAFB, LYN, GRK3, and BID were identified as crucial prognostic factors (Table 2). The Kaplan-Meier plots grouped by the median value of each factor were displayed in Figure 8. We then integrated them into a multivariate Cox regression model with age and gender-adjusted (Figure 9A). The C-index was tested as 0.74 which indicates the model to be reliable. Based on the model, a nomogram was established to predict the ischemic freedom probability of atherosclerosis patients (Figure 9B). The calibration curves (Figures 9C) were applied and manifested an acceptable calibration of the nomogram.
Table 2. Univariate cox regression analysis of members in macrophage related ceRNA subnetwork.
| Factor | HR | Lower (0.95) | Upper (0.95) | p | |||||||||||||||||||||||||||||||||||||||||||||||||||||||||||||||||||||||||||||||||||||||||||||||
| CTSB | 7.677 | 1.805 | 32.645 | 0.006 * | |||||||||||||||||||||||||||||||||||||||||||||||||||||||||||||||||||||||||||||||||||||||||||||||
| Macrophages | 15.043 | 2.112 | 107.116 | 0.007 * | |||||||||||||||||||||||||||||||||||||||||||||||||||||||||||||||||||||||||||||||||||||||||||||||
| AL138756.1 | 2.899 | 1.182 | 7.109 | 0.020 * | |||||||||||||||||||||||||||||||||||||||||||||||||||||||||||||||||||||||||||||||||||||||||||||||
| MAFB | 4.245 | 1.14 | 15.809 | 0.031 * | |||||||||||||||||||||||||||||||||||||||||||||||||||||||||||||||||||||||||||||||||||||||||||||||
| LYN | 2.866 | 1.087 | 7.551 | 0.033 * | |||||||||||||||||||||||||||||||||||||||||||||||||||||||||||||||||||||||||||||||||||||||||||||||
| GRK3 | 7.556 | 1.14 | 50.089 | 0.036 * | |||||||||||||||||||||||||||||||||||||||||||||||||||||||||||||||||||||||||||||||||||||||||||||||
| BID | 3.576 | 1.022 | 12.513 | 0.046 * | |||||||||||||||||||||||||||||||||||||||||||||||||||||||||||||||||||||||||||||||||||||||||||||||
| P2RX7 | 3.319 | 0.9 | 12.235 | 0.072 | |||||||||||||||||||||||||||||||||||||||||||||||||||||||||||||||||||||||||||||||||||||||||||||||
| ADGRE2 | 1.88 | 0.913 | 3.872 | 0.087 | |||||||||||||||||||||||||||||||||||||||||||||||||||||||||||||||||||||||||||||||||||||||||||||||
| CXCL16 | 1.763 | 0.843 | 3.688 | 0.132 | |||||||||||||||||||||||||||||||||||||||||||||||||||||||||||||||||||||||||||||||||||||||||||||||
| LINC01094 | 1.615 | 0.841 | 3.103 | 0.150 | |||||||||||||||||||||||||||||||||||||||||||||||||||||||||||||||||||||||||||||||||||||||||||||||
| LILRB2 | 1.884 | 0.721 | 4.921 | 0.196 | |||||||||||||||||||||||||||||||||||||||||||||||||||||||||||||||||||||||||||||||||||||||||||||||
| CTSS | 2.252 | 0.53 | 9.57 | 0.271 | |||||||||||||||||||||||||||||||||||||||||||||||||||||||||||||||||||||||||||||||||||||||||||||||
| PYCARD | 2.226 | 0.518 | 9.57 | 0.282 | |||||||||||||||||||||||||||||||||||||||||||||||||||||||||||||||||||||||||||||||||||||||||||||||
| PNKD | 1.534 | 0.592 | 3.976 | 0.379 | |||||||||||||||||||||||||||||||||||||||||||||||||||||||||||||||||||||||||||||||||||||||||||||||
| BCAT1 | 1.475 | 0.59 | 3.689 | 0.406 | |||||||||||||||||||||||||||||||||||||||||||||||||||||||||||||||||||||||||||||||||||||||||||||||
| CLEC7A | 1.405 | 0.608 | 3.249 | 0.426 | |||||||||||||||||||||||||||||||||||||||||||||||||||||||||||||||||||||||||||||||||||||||||||||||
| PSAP | 1.706 | 0.345 | 8.443 | 0.513 | |||||||||||||||||||||||||||||||||||||||||||||||||||||||||||||||||||||||||||||||||||||||||||||||
| SUSD1 | 1.411 | 0.319 | 6.235 | 0.65 | |||||||||||||||||||||||||||||||||||||||||||||||||||||||||||||||||||||||||||||||||||||||||||||||
| GM2A | 0.955 | 0.373 | 2.448 | 0.924 | |||||||||||||||||||||||||||||||||||||||||||||||||||||||||||||||||||||||||||||||||||||||||||||||
| SRGAP2 | 0.985 | 0.196 | 4.953 | 0.985 | |||||||||||||||||||||||||||||||||||||||||||||||||||||||||||||||||||||||||||||||||||||||||||||||
| *. p < 0.05. | |||||||||||||||||||||||||||||||||||||||||||||||||||||||||||||||||||||||||||||||||||||||||||||||||||
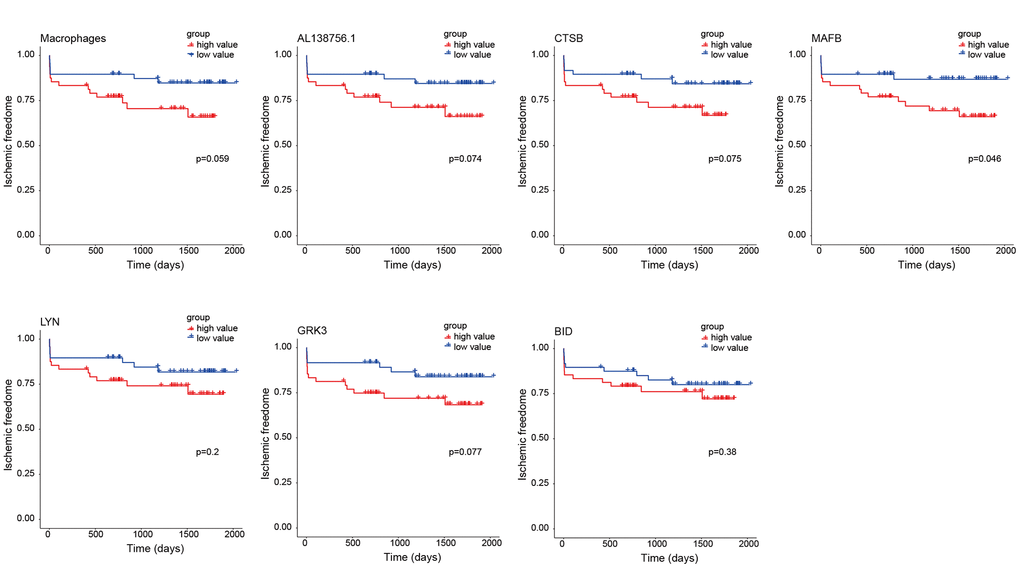
Figure 8. Kaplan-Meier survival curves of 7 factors in the macrophage related ceRNA subnetwork. The P-value was calculated by the log-rank test.
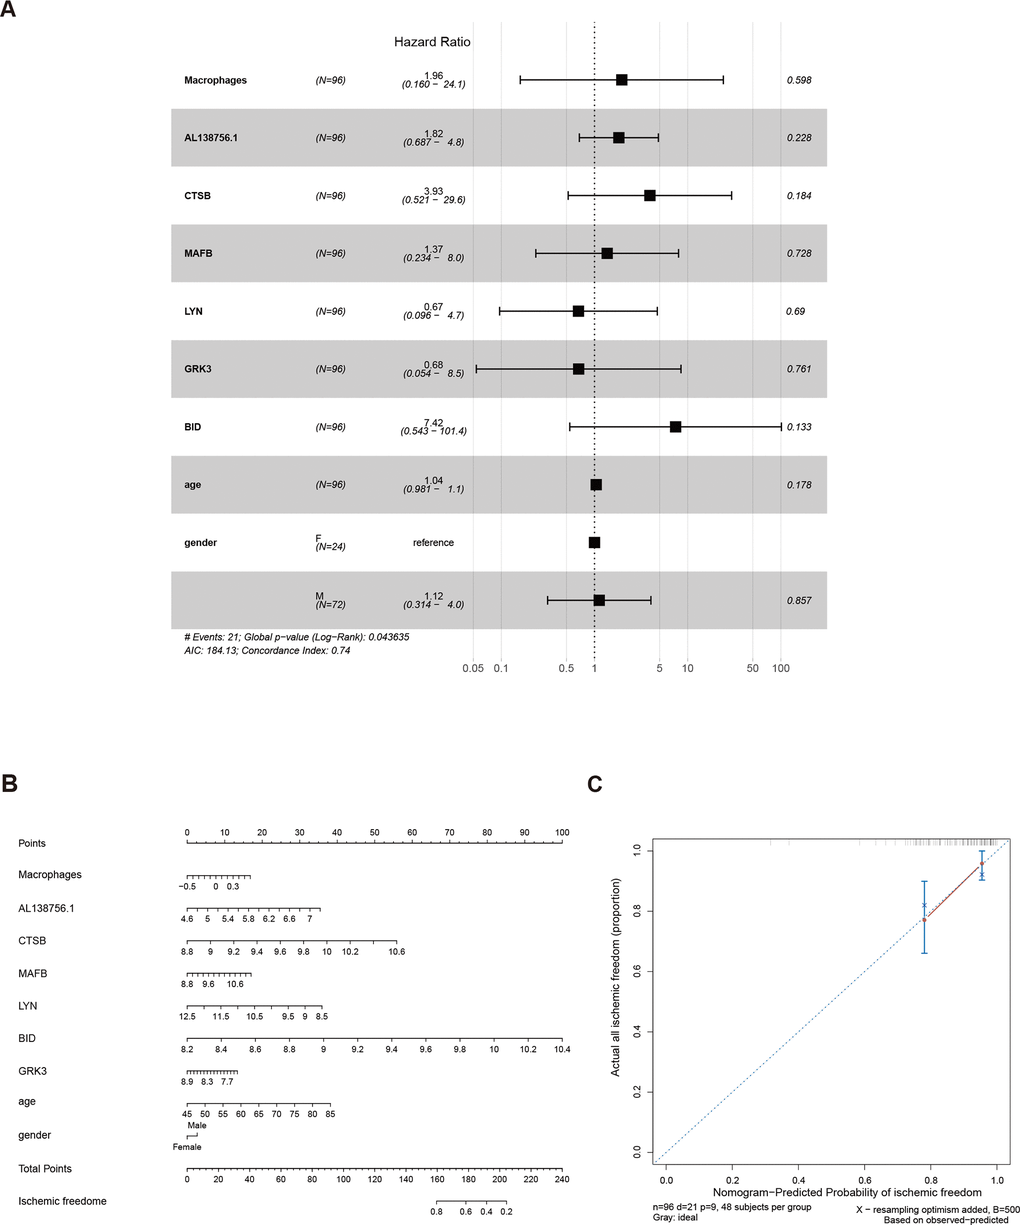
Figure 9. The results of the multivariate Cox regression (A), nomogram (B), and model diagnosis process of the calibration curve (C) constructed by the prognostic factors of the macrophage related ceRNA subnetwork (adjusted by age and gender).
GSEA analysis
The GSEA analysis was applied in GSE21545 to elucidate the regulatory pathways of the key prognostic factors after grouping by the median value of AL138756.1, CTSB, MAFB, LYN, GRK3, BID, and macrophage GSVA score. Through cluster analysis of the pathway NES values, phagosome and lysosome were significantly positively correlated with the expression value of AL138756.1, CTSB, MAFB, LYN, GRK3, BID, and macrophage GSVA score (Figure 10A). In contrast, the PD1 pathway, primary immunodeficiency were significantly negatively associated with these factors (Figure 10B). The negative correlation between PD1 signaling and the prognostic factors indicates that targeting the PD1 immune checkpoint during cancer immunotherapy may contribute to atherosclerosis development and ischemic risk through the macrophage related ceRNA subnetwork. Figure 11 further proves that a low level of PD1 might contribute to higher AL138756.1 expression.
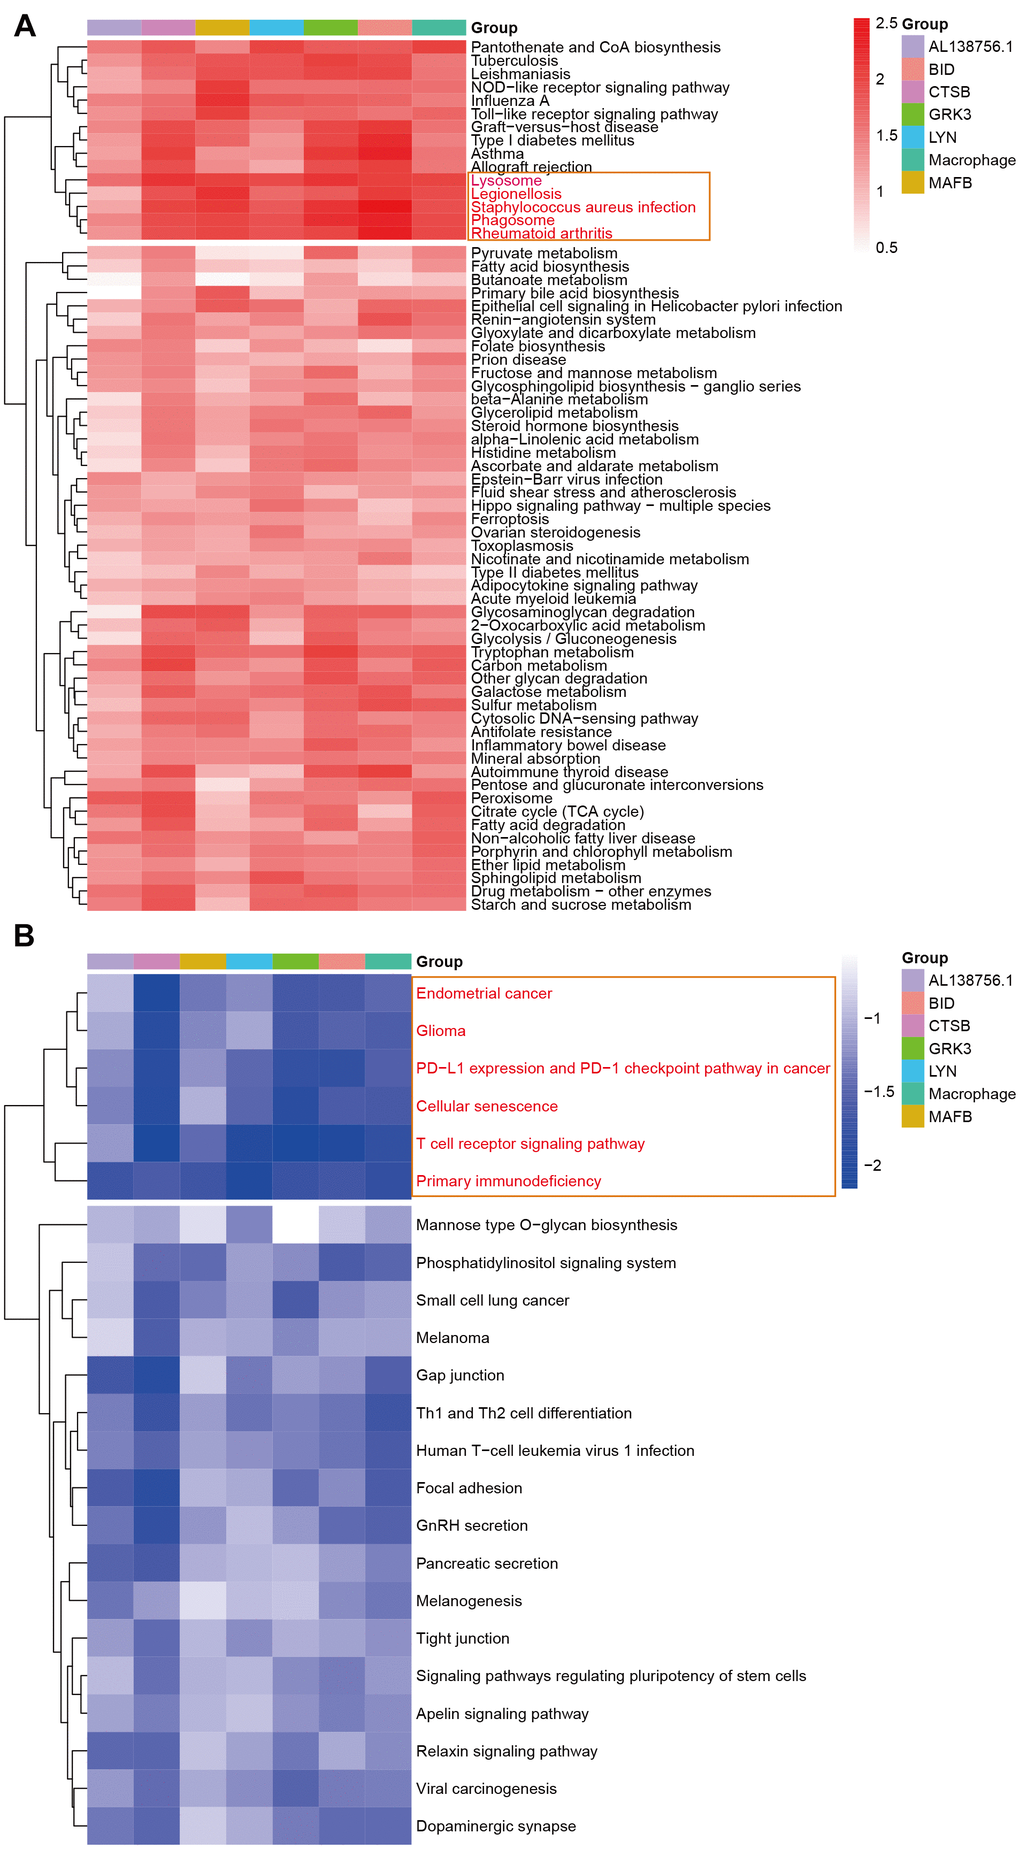
Figure 10. The GSEA in response to AL138756.1, CTSB, MAFB, LYN, GRK3, BID, and macrophage GSVA score. (A) shows the significant terms correlated with higher value, while (B) presents the opposite case.
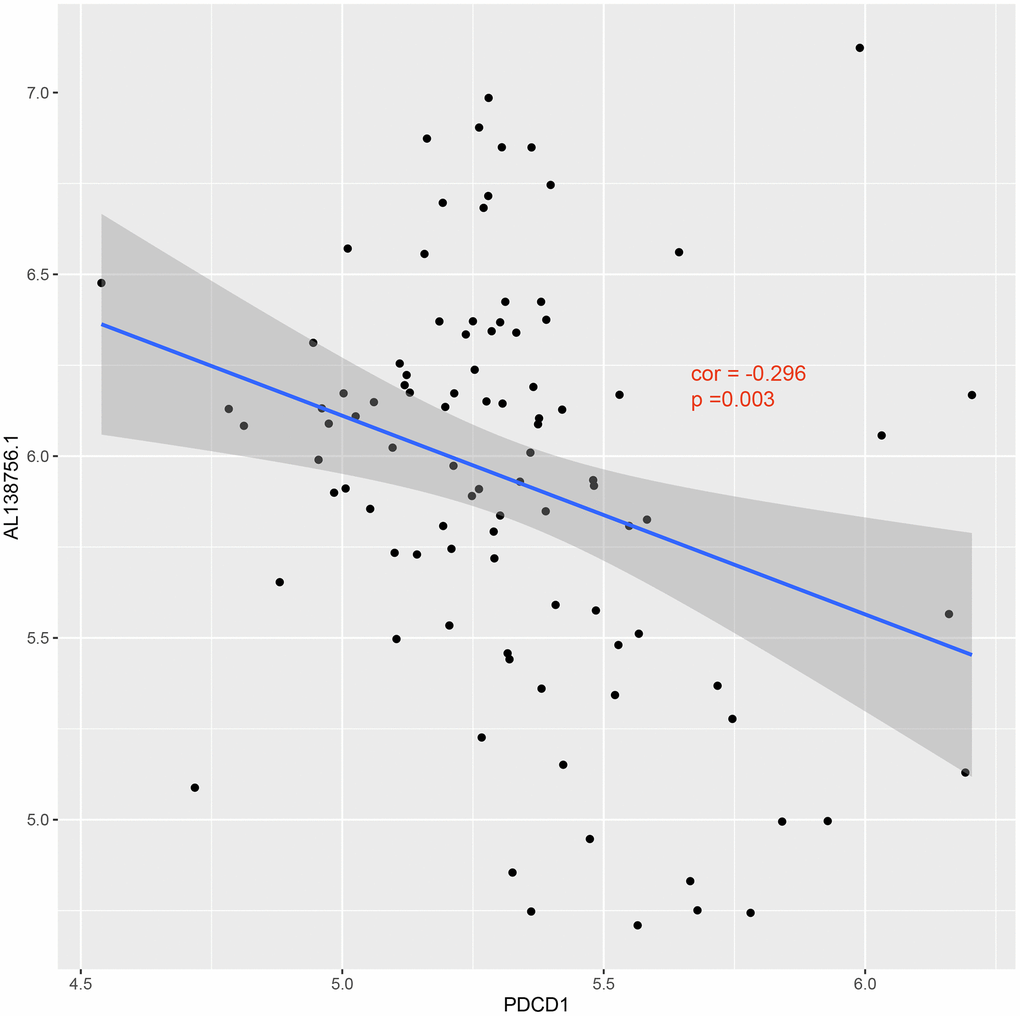
Figure 11. Correlation between expression of PDCD1 and AL138756.1.
Discussion
Atherosclerosis is initiated by the subendothelial retention of LDL, which then triggers a maladaptive inflammatory process that drives disease progression [16]. It is now understood that macrophage plays important roles in all stages of atherosclerosis, from initiation of lesions, to necrosis that leads to plaque rupture and the clinical manifestations, to resolution and regression of lesions [17]. In the current study, we identified a ceRNA immunoregulatory network in AS plaque development. We then established a macrophage related ceRNA subnetwork and identified several key factors that can be a prognostic tool to predict ischemic events including AL138756.1, CTSB, MAFB, LYN, GRK3, BID, and macrophage GSVA score.
To our knowledge, this is the first study to construct the ceRNA network in AS by using the method of WGCNA, the first to link ceRNA with immunoregulation, and the first to identify prognostic factors based on a ceRNA-immunoregulatory network. A previous study has used the differentially expressed gene (DEG) analysis to discover the ceRNA network in AS rabbits [18]. However, this method can be highly affected by the human-made criteria as a P-value and fold change must be set in advance, which ignores the high relationship between genes and may filter out those genes that have high interconnectivity in the network [19]. Our present study applied the WGCNA method and acquired the key modules of AS plaque development in which the lncRNAs and mRNAs were highly co-expressed. Therefore, it is more rational to construct the ceRNA network base on significant genes from the same module than simply using the results of DEG analysis.
Through enrichment analysis, the ceRNA network was mostly involved in the immune response. Therefore, we then conducted an immune infiltration analysis and identified macrophage as hub immunocyte in plaque development. In the established macrophage related ceRNA subnetwork, the two lncRNA AL138756.1 and LINC01094 lack sufficient investigation, while for the downregulated miRNAs, some of them have been implicated to be protective against AS. miR-106b can inhibit ox-LDL-induced endothelial cell apoptosis in AS [20]. It also inhibits the expression of PTEN in vascular ECs, which could block TNF-α-induced activation of caspase-3, thus preventing ECs apoptosis in AS [21]. miR-195-5p expressed in human aortic SMCs has the potential to inhibit SMC proliferation and migration in AS [22]. Thrombospondin 1 activates macrophage differentiation and SMC apoptosis [23] in human aortic dissection while decreases miR-25-5p expression in vascular SMCs [24]. miR-490-3p overexpression suppresses cell proliferation and inhibits proliferation and migration of vascular SMCs in AS [25]. ox-LDL inhibits the expression of miR-490-3p, resulting in vascular SMC proliferation on AS development [26].
Most of the mRNAs in the macrophage related ceRNA subnetwork have been reported in AS or macrophage related study. ADGRE2 (also known as EMR2), encodes for adhesion G protein-coupled receptor E2 and is expressed predominantly in macrophage [27]. EMR2 expression is upregulated during the differentiation and maturation of macrophage [28] and high levels of EMR2 have been detected in foamy macrophage in AS vessels [29]. A recent study indicated that macrophage BCAT1 (branched-chain amino acid transaminase 1) can interfere with metabolic reprogramming and was an attractive pharmacological target for the treatment of chronic inflammatory diseases [30]. CLEC7A (also known as Dectin-1), is a pattern recognition receptor necessary for the TLR2-mediated inflammatory response and enhances cytokine production in macrophage. Dectin-1 has been implicated to contribute to the oxidation of lipids and cholesterol accumulation in AS [31]. CTSS (cathepsin S) encodes a cysteine protease and is associated with lesion size, plaque vulnerability, and inflammatory markers in AS [32]. Of note, miR-106b-5p, the upstream of CTSS in the network, has been validated to bind to the 3'-untranslated region of CTSS while miR-106b-5p gain-of-function experiments lead to a decreased CTSS expression [33]. CXCL16 (C-X-C motif chemokine 16) significantly contributes to AS progression and functions as a biomarker for plaques at risk of rupture [34]. PYCARD, known as apoptosis-associated speck-like protein containing a CARD (ASC), is a component of NLRP3 inflammasome and is significantly increased in AS plaques compared to normal arteries [35]. Moreover, as the mRNAs are highly correlated, one could speculate that the upstream miRNA of one mRNA may affect other mRNAs. For instance, the miR-146a-3p targets BCAT1, GRK2 (G-protein-coupled receptor kinase 2), and P2RX7 (purinergic ligand-gated ion channel 7 receptor) in the network. These 3 mRNAs can therefore communicate with each other through ceRNA language. Studies have also proved that the miR-146a family can negatively regulate LPS-induced CXCL16 expression therefore preventing inflammation [36]. Interestingly, CXCL16 contributes to foam cell formation in the radial arteries and this process may be regulated by P2X7R [37]. These further support the high interconnections of the established ceRNA network and vouch for their importance in preventing macrophage-mediated AS development.
Through univariate Cox regression analysis, the lncRNA AL138756.1 and 5 mRNAs (CTSB, MAFB, LYN, GRK3, BID) were identified as prognostic biomarkers to ischemic events, which highlighted their importance in AS plaque development and rupture. Among them, the lncRNA AL138756.1 can upregulate the expression of CTSB, MAFB, LYN, and BID by competitively binding to miRNAs miR-1271-5p, miR-24-3p, let-7d-5p, and miR-195-3p/miR-507, respectively. Consistent with our results, previous studies suggested that CTSB (cathepsin B) contributed to AS vascular remodeling and plaque rupture [38, 39]. CTSB can regulate the activation of NLRP3 inflammasome [40, 41] and mediate macrophage promoted vascular inflammation and arterial remodeling. The CLARICOR study found that serum CTSB was associated with an increased risk of cardiovascular events in patients with stable coronary heart disease [42] and higher cathepsin activity along with an M2 macrophage phenotype was observed in carotid plaques from symptomatic patients [40]. MAFB is a transcription factor that regulates macrophage differentiation and function. It promotes AS by inhibiting foam-cell apoptosis in early plaque [43]. In advanced plaque, however, MAFB seems to be protective as macrophage-specific deletion of MAFB and exacerbated macrophage apoptosis in advanced AS results in more unstable and more vulnerable lesions because of defective efferocytosis [44]. Nevertheless, MAFB also seems to be related to atherogenesis through a macrophage-independent mechanism by exacerbating insulin resistance and lipid levels [45]. LYN (tyrosine-protein kinase Lyn) plays important role in CD36 mediated ox-LDL uptake by foam cell [46] and promotes AS. GRK3 belongs to the G protein-coupled receptor kinase family which serves broadly to regulate receptor function. BID is a member of the BCL-2 family of cell death regulators and promotes apoptosis. The functions of GRK3 and BID in atherosclerosis remain poorly investigated. The present study has pointed out their diagnostic and prognostic values.
We also conducted the GSEA analysis to identify key regulatory pathways of these prognostic factors. The results indicated that these factors were positively associated with phagocyte and lysome while negatively associated with PD1 signaling. Programmed cell death protein 1 (PD1, also known as PDCD1) is expressed during T cell activation and strongly interferes with T cell receptor signal transduction, thereby balancing protective immunity and immunopathology [47]. In animal studies, the PD-1 immune checkpoint has been implicated in protecting tissue tolerance while disruption of PD-1 associated negative signaling is associated with inflammatory disease including AS [48]. We found that the expression of AL138756.1 was significantly high when the PD1 immune checkpoint was down expressed. This may explain a recently published study in which targeting PD-1 signaling using monoclonal antibodies during cancer therapy leads to serious arterial inflammation [49].
There are limitations in our present study. Firstly, we didn’t conduct any validation and mechanism experiments, whether the identified association is a cause or result remains unclear. Besides, the miRNA profiles were retrieved from the platelets of patients with CAD. This is because no miRNAs feature of atherosclerotic plaque has been provided in GEO database. What’s more, the nomogram established has not been validated due to lacking external datasets. Further study can investigate their biological interaction in an experimental model and verify their prognostic values through a larger cohort.
In conclusion, our study innovatively linked ceRNA with immunoregulation in AS plaque development. Increased macrophage infiltration and higher expression of AL138756.1, CTSB, MAFB, LYN, GRK3, BID are associated with increased risk of ischemic events. These results will help us to better understand the mechanisms of immunoregulation in AS from the ceRNA perspective and provide candidate therapeutic and prognostic targets.
Materials and Methods
Data acquisition and preprocessing
Three datasets, GSE21545, GSE28829, and GSE28858, were obtained from the NCBI Gene Expression Omnibus (GEO) (http://www.ncbi.nlm.nih.gov/geo). The GSE21545 dataset contains 97 peripheral blood mononuclear cells (PBMC) gene expression profiles from the Biobank of Karolinska Endarterectomy (BiKE) [50]. The 97 patients with atherosclerosis were followed for 1,159 ± 631 days (average ± standard deviation) and the ischemic events were defined as myocardial infarctions or ischemic strokes. GSM892606 were excluded due to the lack of age information and the rest 96 samples were selected for the following analysis. The GSE28829 dataset includes 16 advanced and 13 early atherosclerotic plaque samples from human carotid from the Maastricht Pathology Tissue Collection [51]. The GSE28858 dataset contains platelet miRNAs profiles from 12 patients with premature coronary arterial disease (CAD) and 12 age- and sex-matched healthy controls.
Both GSE21545 and GSE28829 were based on the GPL570 [HG-U133_Plus_2] Affymetrix Human Genome U133 Plus 2.0 Array platform. We reannotated the probes of GPL570 as it improves accuracy and makes it possible to identify new transcripts. In brief, the probe sequences were downloaded from Affymetrix (https://www.affymetrix.com) and were remapped to the human genome (GRCh38 release 99 primary assembly) using the R package ‘Rsubread’ [52]. Then, the chromosomal positions of these probes were matched to the corresponding genome annotation database in Ensembl using the R package ‘GenomicRanges’ [53]. Probe sets that were mapped to >1 gene were removed to ensure the reliability of the reannotation. For each dataset, the raw CEL files were preprocessed using robust multi-array average algorithm for background correction, quantile normalization, and summarization with ‘affy’ package [54]. The mean expression values among all multiple probe IDs were selected to represent the corresponding gene symbol. After that, 19557 unique genes were retained, which included 15394 protein coding genes and 3479 lncRNA according to the biotypes identified by Ensembl.
Construction of weighted gene co-expression network
The expression profiles of GSE28829 were used to construct a gene co-expression network by using the package ‘WGCNA’ implemented in R software [55]. The top 50% mRNAs with the highest variability and all the lncRNAs were selected for further analysis. Subsequently, the power parameter ranging from 1-20 was screened out using the ‘pickSoftThreshold’ function. A suitable soft threshold of 10 was selected as it met the degree of independence of 0.85 with the minimum power value. The Dynamic Tree Cut method was applied to generate modules with the following major parameters to avoid the generation of too many modules: deepSplit of 2 and minModuleSize of 30. The height cut-off was set as 0.25, modules were merged if their similarity was >0.75. Ultimately, these mRNAs and lncRNAs in a co-expression module are considered to be highly interconnected. For each module, we conducted a gene ontology biological process enrichment analysis and the most significantly enriched term was summarized in Table 1.
Relationship between clinical information and modules
The correlation between modules and clinical information (advanced or early atherosclerosis plaque) was identified by Pearson correlation’s analysis. For each module, module eigengenes (MEs) referred to the first principal component of all gene expression levels in the module, and therefore, it was reasonable to consider that MEs represented all genes within a specific module. We identified the association between MEs and external clinical information. If P-value was < 0.05, it was considered to be a significant correlation. Gene significance (GS) was defined as the correlation between gene expression and plaque status.
CeRNA network construction and visualization
The expression file of GSE28858 was used to identify downregulated miRNAs in CAD using limma [56] packages in R with a criterion of P < 0.05 and CAD/healthy ratio < 1. Then, the downregulated miRNAs and lncRNAs/mRNAs in the most relevant module with a Gene significance >0.3/0.5 were used to construct a ceRNA network. Briefly, the associated ceRNA network in AF was constructed following three stages. (a) Prediction of lncRNA-miRNA: The potential miRNAs binding with lncRNAs were predicted based on the highly conserved microRNA family files of the miRcode [57] database (http://www.mircode.org/), and the primates conservative score should be >50%; (b) Prediction of miRNA-mRNA: We predicted the mRNAs binding with miRNAs identified from the previous step based on the annotation files of miRTarBase [58], which is one of the most comprehensively annotated and experimentally validated miRNA–target interaction databases.; (c) Construction of lncRNA-miRNA-mRNA ceRNA network: Cytoscape 3.7.2 software [59] (http://cytoscape.org/) was used to construct and visualize the ceRNA network based upon lncRNA-miRNA and miRNA-mRNA pairs.
Gene ontology annotation, pathway enrichment, and protein-protein interaction analysis
Gene Ontology functional annotation and Reactome pathway enrichment analysis were conducted using the ‘ClusterProfiler’ [60] and ‘ReactomePA’ [61] packages in R solftware. To find out the functional associations among the identified genes, we used the online Search Tool for the Retrieval of Interacting Genes (STRING database; http://string-db.org/) to construct a protein-protein interaction (PPI) network based on uniquely comprehensive coverage and predictive function of genome-wide data [62]. A reliability threshold of a combined score of > 0.4 was used to construct the PPI network and Cytoscape software was used to visualize and analyze the biological networks.
Computing the immune infiltration pattern
Two most popular methods were applied to quantify the infiltration of immune cell populations. The deconvolution method CIBERSORT [63] (https://cibersort.stanford.edu/) estimates the proportion of each immune cell population within the sample admixture, and the perm parameter was set as 1000. The Gene Set Variation Analysis (GSVA) [64] method computes the relative abundance of each immune cell population in each sample. We obtained gene signatures identifying 12 immune cell populations (B cells, Th1 cells, Th2 cells, Th17 cells, Tregs, CD8+ T cells, Macrophage, Neutrophils, Mast cells, Dendritic cells, NK cells, and Eosinophils) from the supplemental material of Bindea et al. [65]. Using the 12 gene sets, we computed the GSVA scores of each sample. Comparisons between Advanced and Early groups were tested by the Wilcoxon test, and cell type with P-value < 0.05 was considered significant.
Identification of regulatory pathways of prognostic factors
After grouping by the median expression value of the key mRNA, lncRNA, and macrophage infiltration score, we applied the gene set enrichment analysis (GSEA) to detect the downstream KEGG (Kyoto Encyclopedia of Genes and Genomes) pathways. The normalized enrichment score (NES) was obtained and was used to identify key downstream regulatory pathways.
Data availability statement
GSE21545, GSE28829, and GSE28858 can be downloaded from the GEO database. The results of WGCNA and R codes used in the present study were provided as Supplementary Materials 1 and 2.
Author Contributions
Yaozhong Liu performed the bioinformatic analysis and was a major contributor in writing the manuscript. Na Liu made important modifications to the manuscript. Yaozhong Liu and Qiming Liu designed the research project and created the final revision of the manuscript.
Acknowledgments
Dr. Yaozhong Liu would like to thank Miss Ziwei Wan for her love.
Conflicts of Interest
The authors declare that they have no conflicts of interest.
Funding
This work was supported by grants from the National Key Research and Development Program of China (no.2016YFC1301005) and the National Natural Science Foundation of China (no.81770337 and no.81700309).
References
- 1. Zhang Z, Salisbury D, Sallam T. Long noncoding RNAs in atherosclerosis: JACC review topic of the week. J Am Coll Cardiol. 2018; 72:2380–90. https://doi.org/10.1016/j.jacc.2018.08.2161 [PubMed]
- 2. Kruk ME, Gage AD, Joseph NT, Danaei G, García-Saisó S, Salomon JA. Mortality due to low-quality health systems in the universal health coverage era: a systematic analysis of amenable deaths in 137 countries. Lancet. 2018; 392:2203–12. https://doi.org/10.1016/S0140-6736(18)31668-4 [PubMed]
- 3. Herrington W, Lacey B, Sherliker P, Armitage J, Lewington S. Epidemiology of atherosclerosis and the potential to reduce the global burden of atherothrombotic disease. Circ Res. 2016; 118:535–46. https://doi.org/10.1161/CIRCRESAHA.115.307611 [PubMed]
- 4. Gisterå A, Hansson GK. The immunology of atherosclerosis. Nat Rev Nephrol. 2017; 13:368–80. https://doi.org/10.1038/nrneph.2017.51 [PubMed]
- 5. Libby P, Buring JE, Badimon L, Hansson GK, Deanfield J, Bittencourt MS, Tokgözoğlu L, Lewis EF. Atherosclerosis. Nat Rev Dis Primers. 2019; 5:56. https://doi.org/10.1038/s41572-019-0106-z [PubMed]
- 6. Libby P, Ridker PM, Hansson GK. Progress and challenges in translating the biology of atherosclerosis. Nature. 2011; 473:317–25. https://doi.org/10.1038/nature10146 [PubMed]
- 7. Stemme S, Faber B, Holm J, Wiklund O, Witztum JL, Hansson GK. T lymphocytes from human atherosclerotic plaques recognize oxidized low density lipoprotein. Proc Natl Acad Sci USA. 1995; 92:3893–97. https://doi.org/10.1073/pnas.92.9.3893 [PubMed]
- 8. Frostegård J, Ulfgren AK, Nyberg P, Hedin U, Swedenborg J, Andersson U, Hansson GK. Cytokine expression in advanced human atherosclerotic plaques: dominance of pro-inflammatory (Th1) and macrophage-stimulating cytokines. Atherosclerosis. 1999; 145:33–43. https://doi.org/10.1016/s0021-9150(99)00011-8 [PubMed]
- 9. Li X, Wu Z, Fu X, Han W. Long noncoding RNAs: insights from biological features and functions to diseases. Med Res Rev. 2013; 33:517–53. https://doi.org/10.1002/med.21254 [PubMed]
- 10. Mercer TR, Dinger ME, Mattick JS. Long non-coding RNAs: insights into functions. Nat Rev Genet. 2009; 10:155–59. https://doi.org/10.1038/nrg2521 [PubMed]
- 11. Huang Y. The novel regulatory role of lncRNA-miRNA-mRNA axis in cardiovascular diseases. J Cell Mol Med. 2018; 22:5768–75. https://doi.org/10.1111/jcmm.13866 [PubMed]
- 12. Salmena L, Poliseno L, Tay Y, Kats L, Pandolfi PP. A ceRNA hypothesis: the Rosetta Stone of a hidden RNA language? Cell. 2011; 146:353–58. https://doi.org/10.1016/j.cell.2011.07.014 [PubMed]
- 13. Kim MS, Pinto SM, Getnet D, Nirujogi RS, Manda SS, Chaerkady R, Madugundu AK, Kelkar DS, Isserlin R, Jain S, Thomas JK, Muthusamy B, Leal-Rojas P, et al. A draft map of the human proteome. Nature. 2014; 509:575–81. https://doi.org/10.1038/nature13302 [PubMed]
- 14. Navarro E, Mallén A, Cruzado JM, Torras J, Hueso M. Unveiling ncRNA regulatory axes in atherosclerosis progression. Clin Transl Med. 2020; 9:5. https://doi.org/10.1186/s40169-020-0256-3 [PubMed]
- 15. Ye ZM, Yang S, Xia YP, Hu RT, Chen S, Li BW, Chen SL, Luo XY, Mao L, Li Y, Jin H, Qin C, Hu B. LncRNA MIAT sponges miR-149-5p to inhibit efferocytosis in advanced atherosclerosis through CD47 upregulation. Cell Death Dis. 2019; 10:138. https://doi.org/10.1038/s41419-019-1409-4 [PubMed]
- 16. García de Tena J. Inflammation, atherosclerosis, and coronary artery disease. N Engl J Med. 2005; 353:429–30. https://doi.org/10.1056/NEJM200507283530425 [PubMed]
- 17. Tabas I, Bornfeldt KE. Macrophage phenotype and function in different stages of atherosclerosis. Circ Res. 2016; 118:653–67. https://doi.org/10.1161/CIRCRESAHA.115.306256 [PubMed]
- 18. Wu Y, Zhang F, Lu R, Feng Y, Li X, Zhang S, Hou W, Tian J, Kong X, Sun L. Functional lncRNA-miRNA-mRNA networks in rabbit carotid atherosclerosis. Aging (Albany NY). 2020; 12:2798–813. https://doi.org/10.18632/aging.102778 [PubMed]
- 19. Yao Y, Zhang T, Qi L, Zhou C, Wei J, Feng F, Liu R, Sun C. Integrated analysis of co-expression and ceRNA network identifies five lncRNAs as prognostic markers for breast cancer. J Cell Mol Med. 2019; 23:8410–19. https://doi.org/10.1111/jcmm.14721 [PubMed]
- 20. Zhang Y, Wang L, Xu J, Kong X, Zou L. Up-regulated miR-106b inhibits ox-LDL-induced endothelial cell apoptosis in atherosclerosis. Braz J Med Biol Res. 2020; 53:e8960. https://doi.org/10.1590/1414-431X20198960 [PubMed]
- 21. Zhang J, Li SF, Chen H, Song JX. MiR-106b-5p inhibits tumor necrosis factor-α-induced apoptosis by targeting phosphatase and tensin homolog deleted on chromosome 10 in vascular endothelial cells. Chin Med J (Engl). 2016; 129:1406–12. https://doi.org/10.4103/0366-6999.183414 [PubMed]
- 22. Ji Z, Chi J, Sun H, Ru A, Ni T, Zhang J, Jiang F, Lv H, Peng F, Guo H, Chen Y. linc-ROR targets FGF2 to regulate HASMC proliferation and migration via sponging miR-195-5p. Gene. 2020; 725:144143. https://doi.org/10.1016/j.gene.2019.144143 [PubMed]
- 23. Zeng T, Yuan J, Gan J, Liu Y, Shi L, Lu Z, Xue Y, Xiong R, Huang M, Yang Z, Lin Y, Liu L. Thrombospondin 1 is increased in the aorta and plasma of patients with acute aortic dissection. Can J Cardiol. 2019; 35:42–50. https://doi.org/10.1016/j.cjca.2018.11.008 [PubMed]
- 24. Maier KG, Ruhle B, Stein JJ, Gentile KL, Middleton FA, Gahtan V. Thrombospondin-1 differentially regulates microRNAs in vascular smooth muscle cells. Mol Cell Biochem. 2016; 412:111–17. https://doi.org/10.1007/s11010-015-2614-9 [PubMed]
- 25. Liu Y, Chen Y, Tan L, Zhao H, Xiao N. Linc00299/miR-490-3p/AURKA axis regulates cell growth and migration in atherosclerosis. Heart Vessels. 2019; 34:1370–80. https://doi.org/10.1007/s00380-019-01356-7 [PubMed]
- 26. Sun Y, Chen D, Cao L, Zhang R, Zhou J, Chen H, Li Y, Li M, Cao J, Wang Z. MiR-490-3p modulates the proliferation of vascular smooth muscle cells induced by ox-LDL through targeting PAPP-A. Cardiovasc Res. 2013; 100:272–79. https://doi.org/10.1093/cvr/cvt172 [PubMed]
- 27. Boyden SE, Desai A, Cruse G, Young ML, Bolan HC, Scott LM, Eisch AR, Long RD, Lee CC, Satorius CL, Pakstis AJ, Olivera A, Mullikin JC, et al. Vibratory urticaria associated with a missense variant in ADGRE2. N Engl J Med. 2016; 374:656–63. https://doi.org/10.1056/NEJMoa1500611 [PubMed]
- 28. Chang GW, Davies JQ, Stacey M, Yona S, Bowdish DM, Hamann J, Chen TC, Lin CY, Gordon S, Lin HH. CD312, the human adhesion-GPCR EMR2, is differentially expressed during differentiation, maturation, and activation of myeloid cells. Biochem Biophys Res Commun. 2007; 353:133–38. https://doi.org/10.1016/j.bbrc.2006.11.148 [PubMed]
- 29. van Eijk M, Aust G, Brouwer MS, van Meurs M, Voerman JS, Dijke IE, Pouwels W, Sändig I, Wandel E, Aerts JM, Boot RG, Laman JD, Hamann J. Differential expression of the EGF-TM7 family members CD97 and EMR2 in lipid-laden macrophages in atherosclerosis, multiple sclerosis and gaucher disease. Immunol Lett. 2010; 129:64–71. https://doi.org/10.1016/j.imlet.2010.02.004 [PubMed]
- 30. Papathanassiu AE, Ko JH, Imprialou M, Bagnati M, Srivastava PK, Vu HA, Cucchi D, McAdoo SP, Ananieva EA, Mauro C, Behmoaras J. BCAT1 controls metabolic reprogramming in activated human macrophages and is associated with inflammatory diseases. Nat Commun. 2017; 8:16040. https://doi.org/10.1038/ncomms16040 [PubMed]
- 31. Thiagarajan PS, Yakubenko VP, Elsori DH, Yadav SP, Willard B, Tan CD, Rodriguez ER, Febbraio M, Cathcart MK. Vimentin is an endogenous ligand for the pattern recognition receptor Dectin-1. Cardiovasc Res. 2013; 99:494–504. https://doi.org/10.1093/cvr/cvt117 [PubMed]
- 32. Stellos K, Gatsiou A, Stamatelopoulos K, Perisic Matic L, John D, Lunella FF, Jaé N, Rossbach O, Amrhein C, Sigala F, Boon RA, Fürtig B, Manavski Y, et al. Adenosine-to-inosine RNA editing controls cathepsin S expression in atherosclerosis by enabling HuR-mediated post-transcriptional regulation. Nat Med. 2016; 22:1140–50. https://doi.org/10.1038/nm.4172 [PubMed]
- 33. Pires D, Bernard EM, Pombo JP, Carmo N, Fialho C, Gutierrez MG, Bettencourt P, Anes E. Mycobacterium tuberculosis modulates miR-106b-5p to control cathepsin S expression resulting in higher pathogen survival and poor T-cell activation. Front Immunol. 2017; 8:1819. https://doi.org/10.3389/fimmu.2017.01819 [PubMed]
- 34. Bakogiannis C, Sachse M, Stamatelopoulos K, Stellos K. Platelet-derived chemokines in inflammation and atherosclerosis. Cytokine. 2019; 122:154157. https://doi.org/10.1016/j.cyto.2017.09.013 [PubMed]
- 35. Paramel Varghese G, Folkersen L, Strawbridge RJ, Halvorsen B, Yndestad A, Ranheim T, Krohg-Sørensen K, Skjelland M, Espevik T, Aukrust P, Lengquist M, Hedin U, Jansson JH, et al. NLRP3 inflammasome expression and activation in human atherosclerosis. J Am Heart Assoc. 2016; 5:e003031. https://doi.org/10.1161/JAHA.115.003031 [PubMed]
- 36. Xiao Q, Zhu X, Yang S, Wang J, Yin R, Song J, Ma A, Pan X. LPS induces CXCL16 expression in HUVECs through the miR-146a-mediated TLR4 pathway. Int Immunopharmacol. 2019; 69:143–49. https://doi.org/10.1016/j.intimp.2019.01.011 [PubMed]
- 37. Hu ZB, Chen Y, Gong YX, Gao M, Zhang Y, Wang GH, Tang RN, Liu H, Liu BC, Ma KL. Activation of the CXCL16/CXCR6 pathway by inflammation contributes to atherosclerosis in patients with end-stage renal disease. Int J Med Sci. 2016; 13:858–67. https://doi.org/10.7150/ijms.16724 [PubMed]
- 38. Lutgens SP, Cleutjens KB, Daemen MJ, Heeneman S. Cathepsin cysteine proteases in cardiovascular disease. FASEB J. 2007; 21:3029–41. https://doi.org/10.1096/fj.06-7924com [PubMed]
- 39. Liu CL, Guo J, Zhang X, Sukhova GK, Libby P, Shi GP. Cysteine protease cathepsins in cardiovascular disease: from basic research to clinical trials. Nat Rev Cardiol. 2018; 15:351–70. https://doi.org/10.1038/s41569-018-0002-3 [PubMed]
- 40. Abd-Elrahman I, Meir K, Kosuge H, Ben-Nun Y, Weiss Sadan T, Rubinstein C, Samet Y, McConnell MV, Blum G. Characterizing cathepsin activity and macrophage subtypes in excised human carotid plaques. Stroke. 2016; 47:1101–08. https://doi.org/10.1161/STROKEAHA.115.011573 [PubMed]
- 41. Bai H, Yang B, Yu W, Xiao Y, Yu D, Zhang Q. Cathepsin B links oxidative stress to the activation of NLRP3 inflammasome. Exp Cell Res. 2018; 362:180–87. https://doi.org/10.1016/j.yexcr.2017.11.015 [PubMed]
- 42. Wuopio J, Hilden J, Bring C, Kastrup J, Sajadieh A, Jensen GB, Kjøller E, Kolmos HJ, Larsson A, Jakobsen JC, Winkel P, Gluud C, Carlsson AC, Ärnlöv J. Cathepsin B and S as markers for cardiovascular risk and all-cause mortality in patients with stable coronary heart disease during 10 years: a CLARICOR trial sub-study. Atherosclerosis. 2018; 278:97–102. https://doi.org/10.1016/j.atherosclerosis.2018.09.006 [PubMed]
- 43. Hamada M, Nakamura M, Tran MT, Moriguchi T, Hong C, Ohsumi T, Dinh TT, Kusakabe M, Hattori M, Katsumata T, Arai S, Nakashima K, Kudo T, et al. MafB promotes atherosclerosis by inhibiting foam-cell apoptosis. Nat Commun. 2014; 5:3147. https://doi.org/10.1038/ncomms4147 [PubMed]
- 44. Hasegawa H, Watanabe T, Kato S, Toshima T, Yokoyama M, Aida Y, Nishiwaki M, Kadowaki S, Narumi T, Honda Y, Otaki Y, Honda S, Shunsuke N, et al. The role of macrophage transcription factor MafB in atherosclerotic plaque stability. Atherosclerosis. 2016; 250:133–43. https://doi.org/10.1016/j.atherosclerosis.2016.05.021 [PubMed]
- 45. Santos-Gallego CG. MafB and the role of macrophage apoptosis in atherosclerosis: a time to kill, a time to heal. Atherosclerosis. 2016; 252:194–96. https://doi.org/10.1016/j.atherosclerosis.2016.06.026 [PubMed]
- 46. Chen Y, Kennedy DJ, Ramakrishnan DP, Yang M, Huang W, Li Z, Xie Z, Chadwick AC, Sahoo D, Silverstein RL. Oxidized LDL-bound CD36 recruits an Na⁺/K⁺-ATPase-Lyn complex in macrophages that promotes atherosclerosis. Sci Signal. 2015; 8:ra91. https://doi.org/10.1126/scisignal.aaa9623 [PubMed]
- 47. Sharpe AH, Pauken KE. The diverse functions of the PD1 inhibitory pathway. Nat Rev Immunol. 2018; 18:153–67. https://doi.org/10.1038/nri.2017.108 [PubMed]
- 48. Weyand CM, Berry GJ, Goronzy JJ. The immunoinhibitory PD-1/PD-L1 pathway in inflammatory blood vessel disease. J Leukoc Biol. 2018; 103:565–75. https://doi.org/10.1189/jlb.3MA0717-283 [PubMed]
- 49. Calabretta R, Hoeller C, Pichler V, Mitterhauser M, Karanikas G, Haug A, Li X, Hacker M. Immune checkpoint inhibitor therapy induces inflammatory activity in large arteries. Circulation. 2020; 142:2396–98. https://doi.org/10.1161/CIRCULATIONAHA.120.048708 [PubMed]
- 50. Folkersen L, Persson J, Ekstrand J, Agardh HE, Hansson GK, Gabrielsen A, Hedin U, Paulsson-Berne G. Prediction of ischemic events on the basis of transcriptomic and genomic profiling in patients undergoing carotid endarterectomy. Mol Med. 2012; 18:669–75. https://doi.org/10.2119/molmed.2011.00479 [PubMed]
- 51. Döring Y, Manthey HD, Drechsler M, Lievens D, Megens RT, Soehnlein O, Busch M, Manca M, Koenen RR, Pelisek J, Daemen MJ, Lutgens E, Zenke M, et al. Auto-antigenic protein-DNA complexes stimulate plasmacytoid dendritic cells to promote atherosclerosis. Circulation. 2012; 125:1673–83. https://doi.org/10.1161/CIRCULATIONAHA.111.046755 [PubMed]
- 52. Liao Y, Smyth GK, Shi W. The R package rsubread is easier, faster, cheaper and better for alignment and quantification of RNA sequencing reads. Nucleic Acids Res. 2019; 47:e47. https://doi.org/10.1093/nar/gkz114 [PubMed]
- 53. Lawrence M, Huber W, Pagès H, Aboyoun P, Carlson M, Gentleman R, Morgan MT, Carey VJ. Software for computing and annotating genomic ranges. PLoS Comput Biol. 2013; 9:e1003118. https://doi.org/10.1371/journal.pcbi.1003118 [PubMed]
- 54. Gautier L, Cope L, Bolstad BM, Irizarry RA. Affy—analysis of affymetrix GeneChip data at the probe level. Bioinformatics. 2004; 20:307–15. https://doi.org/10.1093/bioinformatics/btg405 [PubMed]
- 55. Langfelder P, Horvath S. WGCNA: an R package for weighted correlation network analysis. BMC Bioinformatics. 2008; 9:559. https://doi.org/10.1186/1471-2105-9-559 [PubMed]
- 56. Ritchie ME, Phipson B, Wu D, Hu Y, Law CW, Shi W, Smyth GK. Limma powers differential expression analyses for RNA-sequencing and microarray studies. Nucleic Acids Res. 2015; 43:e47. https://doi.org/10.1093/nar/gkv007 [PubMed]
- 57. Jeggari A, Marks DS, Larsson E. miRcode: a map of putative microRNA target sites in the long non-coding transcriptome. Bioinformatics. 2012; 28:2062–63. https://doi.org/10.1093/bioinformatics/bts344 [PubMed]
- 58. Huang HY, Lin YC, Li J, Huang KY, Shrestha S, Hong HC, Tang Y, Chen YG, Jin CN, Yu Y, Xu JT, Li YM, Cai XX, et al. miRTarBase 2020: updates to the experimentally validated microRNA-target interaction database. Nucleic Acids Res. 2020; 48:D148–54. https://doi.org/10.1093/nar/gkz896 [PubMed]
- 59. Shannon P, Markiel A, Ozier O, Baliga NS, Wang JT, Ramage D, Amin N, Schwikowski B, Ideker T. Cytoscape: a software environment for integrated models of biomolecular interaction networks. Genome Res. 2003; 13:2498–504. https://doi.org/10.1101/gr.1239303 [PubMed]
- 60. Yu G, Wang LG, Han Y, He QY. clusterProfiler: an R package for comparing biological themes among gene clusters. OMICS. 2012; 16:284–87. https://doi.org/10.1089/omi.2011.0118 [PubMed]
- 61. Yu G, He QY. ReactomePA: an r/bioconductor package for reactome pathway analysis and visualization. Mol Biosyst. 2016; 12:477–79. https://doi.org/10.1039/c5mb00663e [PubMed]
- 62. Szklarczyk D, Morris JH, Cook H, Kuhn M, Wyder S, Simonovic M, Santos A, Doncheva NT, Roth A, Bork P, Jensen LJ, von Mering C. The STRING database in 2017: quality-controlled protein-protein association networks, made broadly accessible. Nucleic Acids Res. 2017; 45:D362–68. https://doi.org/10.1093/nar/gkw937 [PubMed]
- 63. Newman AM, Liu CL, Green MR, Gentles AJ, Feng W, Xu Y, Hoang CD, Diehn M, Alizadeh AA. Robust enumeration of cell subsets from tissue expression profiles. Nat Methods. 2015; 12:453–57. https://doi.org/10.1038/nmeth.3337 [PubMed]
- 64. Hänzelmann S, Castelo R, Guinney J. GSVA: gene set variation analysis for microarray and RNA-seq data. BMC Bioinformatics. 2013; 14:7. https://doi.org/10.1186/1471-2105-14-7 [PubMed]
- 65. Bindea G, Mlecnik B, Tosolini M, Kirilovsky A, Waldner M, Obenauf AC, Angell H, Fredriksen T, Lafontaine L, Berger A, Bruneval P, Fridman WH, Becker C, et al. Spatiotemporal dynamics of intratumoral immune cells reveal the immune landscape in human cancer. Immunity. 2013; 39:782–95. https://doi.org/10.1016/j.immuni.2013.10.003 [PubMed]
- 66. Wickham H. Ggplot2: Elegant Graphics for Data Analysis. Springer Publishing Company, Incorporated. 2009.