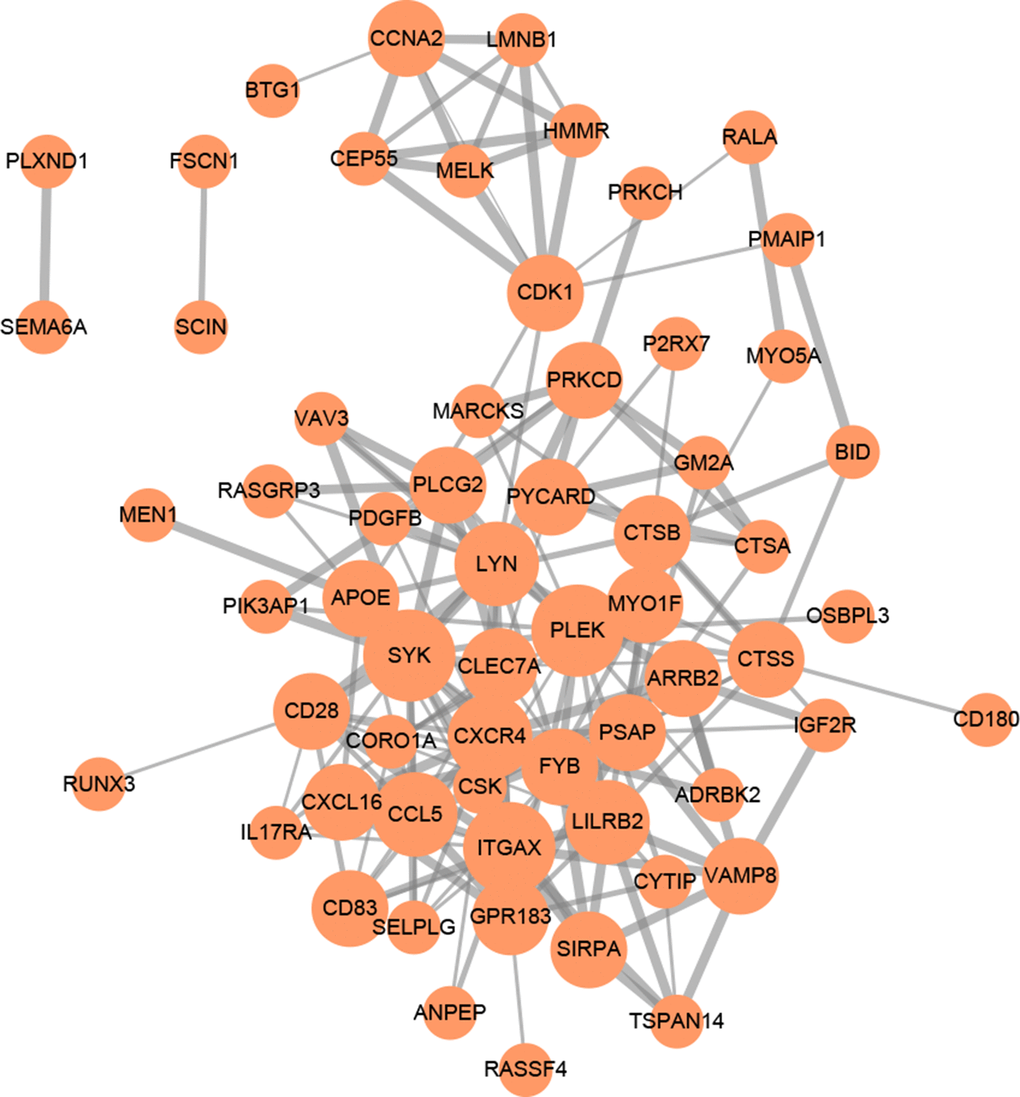
Figure 5.PPI network of 90 mRNAs based on the STRING database. Each node represents a protein-coding gene. The size of each node is mapped to its degree. Terms with a combined interaction score > 0.4 are linked by an edge (the thickness of the edge represents the interaction score).