Submit an Article
Navigate
Home
Editorial Board
Editorial Policies
Current Volume
Archive
Scientific Integrity
Publication Ethics Statements
Interviews with Outstanding Authors
Newsroom
Sponsored Conferences
Podcast
Contact
Special Collections
Submit an Article
Online ISSN: 1945-4589
Research Paper
|
Volume 13, Issue 2
|
pp. 3080–3100
Constructing a ceRNA-immunoregulatory network associated with the development and prognosis of human atherosclerosis through weighted gene co-expression network analysis
Back to article
Figure 10
(10 of 11)
−
100%
+
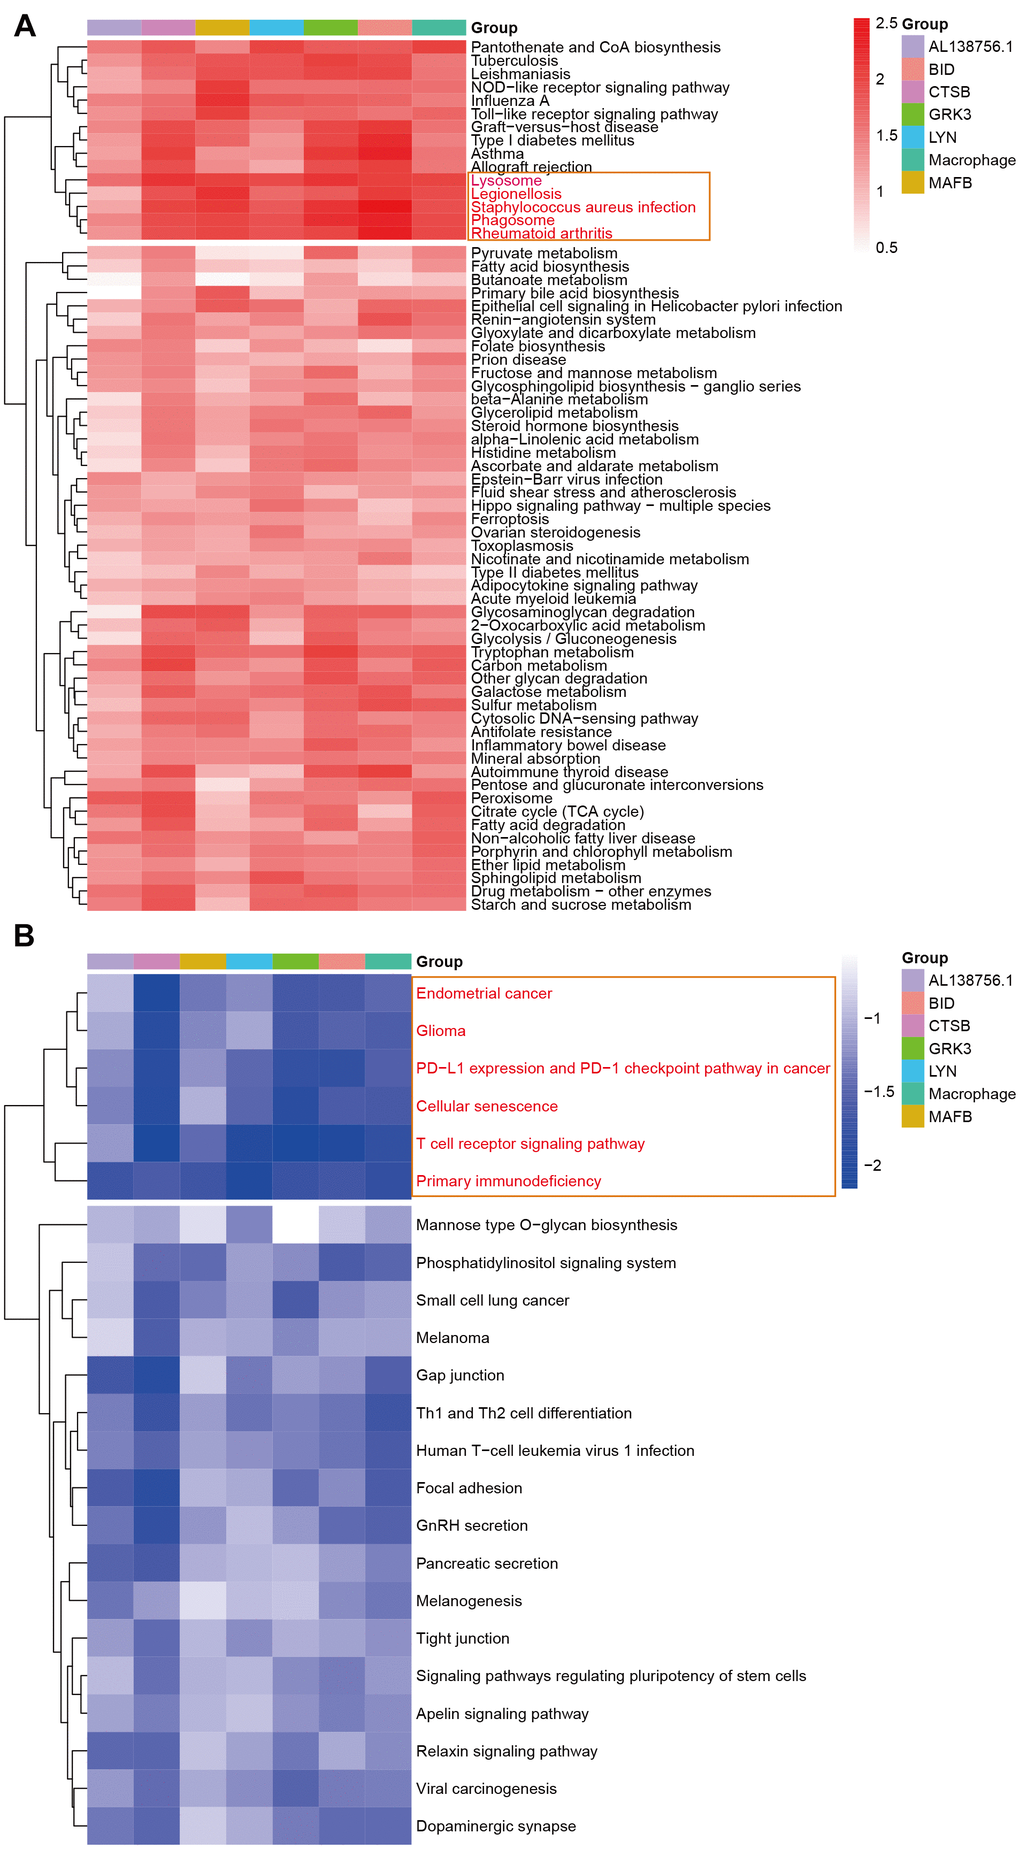
Figure 10.
The GSEA in response to AL138756.1, CTSB, MAFB, LYN, GRK3, BID, and macrophage GSVA score.
(
A
) shows the significant terms correlated with higher value, while (
B
) presents the opposite case.