


Introduction
Colon cancer is the third leading cause of cancer deaths, with more than 1 million new cases diagnosed every year [1]. Heterogeneity is a characteristic of colon cancer whereby the pattern of mutations differ significantly among patients [2]. Mutations in essential genes can affect the proliferation, differentiation, apoptosis, survival capacity, and distant metastasis of tumor cells [3]. Thus, therapeutic methods that target specific biomolecules or genes are effective in a small fraction of patients. It is necessary to explore gene mutations and more potential therapeutic targets for colon cancer. APC, a tumor suppressor gene, is the most frequently mutated gene in patients with colon cancer and influences the Wnt/β-catenin pathway [4]. Mutated APC has been observed in early stage colon cancer and is correlated with clinical outcomes [5]. However, it was seldom detected in patients with late stage colon cancer and metastasis. In contrast, the TP53 inactivating mutation is usually observed in more advanced tumors [6, 7]. Presently, RAS is the only predictive biomarker in the application of anti-EGFR agents to treat wild-type colon cancer [8, 9]. KRAS encodes a p21 protein, which couples with GTPase to transform GTP into GDP and regulates signaling pathways related to cellular growth and survival. When KRAS is mutated, the downstream signaling pathway (mitogen-activated protein kinase, MAPK) is activated, leading to cellular proliferation and tumor progression. In addition, KRAS mutations are predictive markers for breast, lung, ovarian, head/neck, and pancreatic cancers [4, 8, 9, 11]. For example, Jung et al. found that KRAS mutations were correlated with poor prognosis in patients with breast cancer, together with AKT signaling pathway activation, estrogen negative, and basal-like gene expression patterns. As BRAF is downstream of RAS in the MAPK/ERK signaling pathway, mutated BRAF is assumed to have the same resistance to the anti-EGFR agent as to the RAS-mutated colon tumor [10]. Furthermore, microsatellite instability (MSI) is another pathogenesis factor, and, if detected at an early stage, improves patient outcome [11, 12]. However, the mechanism of these gene mutations is unclear and personalized treatment requires further research on clinical biomarkers.
The minority of human colon cancers are genetically driven, including Lynch syndrome, familial adenomatous, and hamartomata’s polyposis [13]. The majority of colon cancer cases correlate with environmental and nonhereditary events, such as chronic inflammatory disease [14, 15]. Previous studies using mouse colon cancer models highlighted the importance of chronic inflammation in the development of colon cancer. In addition, these studies illustrated the mechanisms of inflammation-driven carcinogenesis in the intestine [16]. The infiltrating immune cells and their cytokines play a role in the inflammatory response. A higher neoantigen mutational load was positively correlated with T-lymphocyte infiltration and survival outcomes in patients with colon cancer [17]. Cytokines can be pro-inflammatory (IL-1, IL-6, IL-8, tumor-necrosis factor, transforming growth factor-β (TGF-β)) or anti-inflammatory (IL-1ra, IL-4, IL-10, IL-13) [18, 19]. Based on the successful utilization of immune checkpoint inhibitors, immunotherapy has gained grounds in clinical oncology practice in the last decade. Although patients with colon cancer have not benefited from immunotherapy, several studies have shown that colon tumors with high mutational burden may be potential targets of immune checkpoint inhibitors [20, 21]. Inhibition of MEK upregulates IFN-gamma-mediated human leukocyte antigen (HLA) and programmed death-1 receptor (PD-L1) expression in melanoma, colorectal, and breast cancers [22, 23]. The product of HLA genes—MHC protein—can also regulate the immune system [24]. There is an increasing role for PD-1 inhibition in MSI colon cancer, while the generalized activity of PD-1 inhibitors has not been seen in microsatellite stable (MSS) colon cancer [25, 26]. Thus, there is a need to study the relationship between specific genetic variants and immune events as well as alternative approaches to treat patients with different genetic characteristics.
In this study, we performed a comprehensive evaluation of somatic mutations in colon cancer. We found that KRAS mutations had a strong negative correlation with immunity and was of great prognostic value. We used single-sample Gene Set Enrichment Analysis (ssGSEA) and Gene Set Enrichment Analysis (GSEA) to identify the corresponding immune signatures of KRAS mutations and evaluated the relationship between KRAS-related pathways and immune cell infiltration. We compared the infiltration of immune cells, tumor mutational burden (TMB), HLA gene expression, and checkpoint-related genes between the KRAS-mutated and wild-type samples. Finally, in order to provide clues for the mechanism of KRAS-related immune alteration, we screened immune-related genes that differed in expression between the KRAS-mutated and wild-type samples.
Results
The landscape of genetic mutations in colon cancer
We detected the top thirty mutated genes in colon cancer samples from the ICGC database, and the top five of mutated genes were APC, TP53, TTN, MUC6, and KRAS (Figure 1A). We also detected the top thirty mutated genes in colon cancer samples from the The Cancer Genome Atlas (TCGA) database, and the top five mutated genes were APC, TTN, TP53, KRAS, and SYNE1 (Figure 1B). Among the detected genes, 17 were members of the 30 most frequently mutated genes in the ICGC and TCGA databases (Figure 1C). The expression of some genes were significantly different in the mutated group than the wild-type group and included APC (p = 0.003), DNAH11 (p = 0.021), FAT3 (p = 0.031), FAT4 (p = 0.002), KRAS (p = 0.039), MUC5B (p < 0.001), PIK3CA (p = 0.022), and TP53 (p < 0.001) (Supplementary Figure 1). Next, we analyzed the mutational frequency of specific loci in the TCGA cohort. We found that rs121913529 in KRAS had the highest mutational frequency with 90 out of 399 patients having a mutation in this locus (Supplementary Table 2). Therefore, we predicted that KRAS mutations play an important role in colon cancer. We also performed survival analysis of four types of KRAS mutations whose mutation frequency were higher than 10/399: rs112445441 (p = 0.339), rs121913527 (p = 0.359), rs121913529 (p < 0.001), and rs121913530 (p = 0.003) (Figure 2A–2D). KRAS-mutated groups also showed worse survival outcomes compared to the wild-type groups in the ICGC cohort (p = 0.040) (Figure 2E–2F). These results indicate that KRAS mutations, particularly rs121913529, have prognostic value in colon cancer.
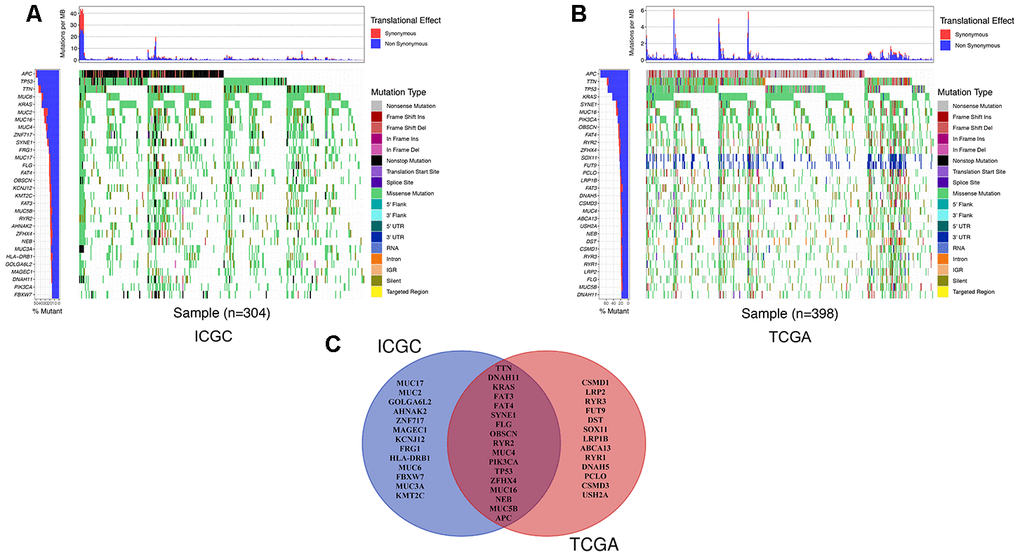
Figure 1. The landscape of genetic mutations in colon cancer. (A) The 30 most frequent mutations of samples in the ICGC database. The percentage of patients with mutations, translation effect (synonymous or non-synonymous), and mutation types were given. (B) The 30 most frequent mutations of samples in the TCGA database. (C) A Venn diagram of mutated genes. There were 17 genes that were members of the 30 most frequently mutated genes in the ICGC and TCGA databases.
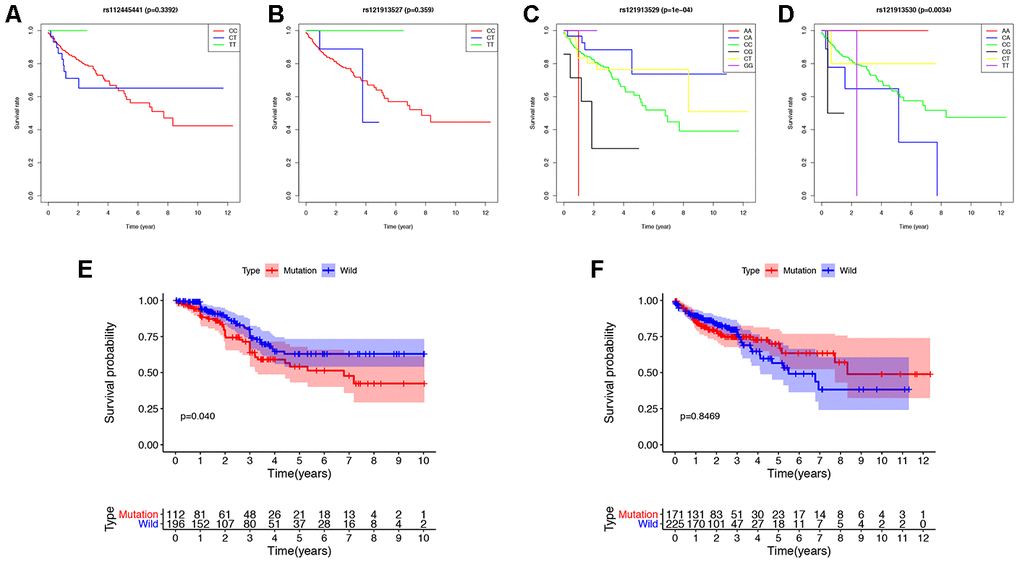
Figure 2. Survival analysis of KRAS mutations in colon cancer. (A–D) The survival rate of patients with different base-pairs in rs112445441, rs121913527, rs121913529, and rs121913530. (E, F) Comparison of the survival rates between KRAS-mutated and wild-type patients from the ICGC and TCGA databases. The difference in survival rate was statistically significant in ICGC (P=0.04), but not in TCGA (P=0.8469). In TCGA analysis, there were 171 and 225 patients with and without KRAS mutations, respectively. In ICGC analysis, there were 112 and 196 patients with and without KRAS mutations, respectively.
KRAS mutations are negatively correlated with immune activities in colon cancer
In order to explore the underlying mechanism of KRAS mutations in colon cancer, we performed GSEA to identify correlated pathways. We noticed that KRAS mutations had high enrichment in some immune signatures: macrophage M1 and M2, natural killer cell (NK cell) differentiation, class I MHC-mediated antigen processing, B-cell receptor signaling, IL-2, and IL-17 pathways (Figure 3). We assessed the immunity of tumor samples by applying the ssGSEA approach to the transcriptomes of TCGA colon cancer samples (Figure 4A). We incorporated 30 immune-related pathways and infiltrating cells to estimate the immune capacity of colon cancer tissues. We found significantly lower enrichment levels in 13 pathways within the KRAS-mutated group: pDCs, Treg, inflammation-promoting, Th1 cells, HLA, T cell co-stimulation, cytolytic activity, tumor infiltration lymphocyte (TIL), T cell co-inhibiting, T helper cells, neutrophils, macrophages, and checkpoint (Supplementary Table 3). Furthermore, we compared the tumor purity, immune score, and stromal score between the KRAS-mutated and wild-type groups. The KRAS-mutated group had lower immune and stromal scores while its tumor purity was higher than that in the wild-type group. This revealed that the KRAS mutation negatively correlated with immune activities (Figure 4B–4D). Moreover, we explored the correlation between KRAS mutation and specific immune signatures by analyzing expression levels of signature-related genes and immune cell infiltration. We compared the ssGSEA scores of 16 immune cell infiltration signatures between the KRAS-mutated and wild-type groups and found that the infiltration of macrophages (p = 0.033), neutrophils (p = 0.026), pDCs (p < 0.001), T-helper cells (p = 0.024), Th1 cells (p = 0.011), and Tregs (p = 0.001) were lower in KRAS-mutated group (Figure 5A). The TIL signature—composed of 117 genes—showed significantly higher enrichment in the wild-type than the KRAS-mutated groups (p = 0.015), and 64 out of 117 genes in this signature showed lower expression levels in the KRAS-mutated group (Figure 5B, Supplementary Table 4). As for the inflammation-promoting signature, the KRAS-mutated group showed lower enrichment and 9 out of 15 genes in this signature had decreased expression (p = 0.002, Figure 5C, Supplementary Table 5). Granzyme A (GZMA) and perforin 1 (PRF1) secreted by cytotoxic T-cells and NK cells are able to kill tumor cells [27]. GZMA is a tryptase that leads to caspase- independent apoptosis, while PRF1 is a pore-forming enzyme that facilitates the entry of granzymes into the target cells. Both effector molecules were considerably overexpressed upon CD8+ T cell activation [28]. The cytolytic activity was calculated as the mean of GZMA and PRF1 expression [29, 30]. The KRAS-mutated group had lower GZMA and PRF1 expression (Figure 5D–5F). These observations demonstrate that KRAS mutations are negatively correlated with immune cell infiltration, cytotoxic cell activity, and inflammatory response in colon cancer.
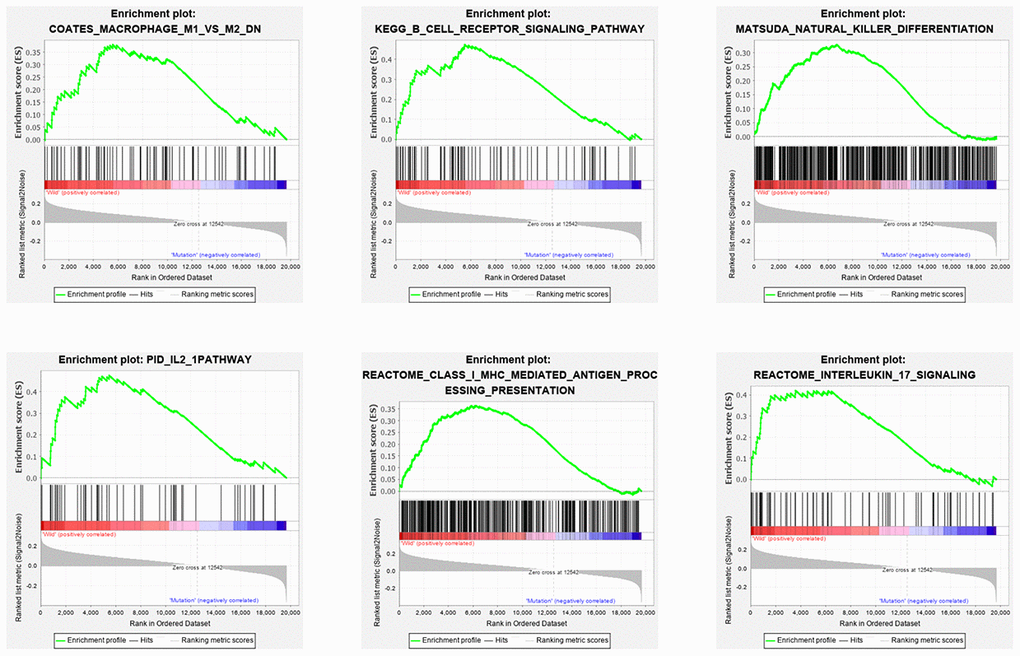
Figure 3. Six immune pathways were enriched with KRAS mutations. As shown in the enrichment plots, KRAS mutations were positively correlated with the immune pathways: macrophage M1 and M2, NK cell differentiation, class I MHC-mediated antigen processing, B cell receptor signaling, IL-2 and IL-17 pathways.
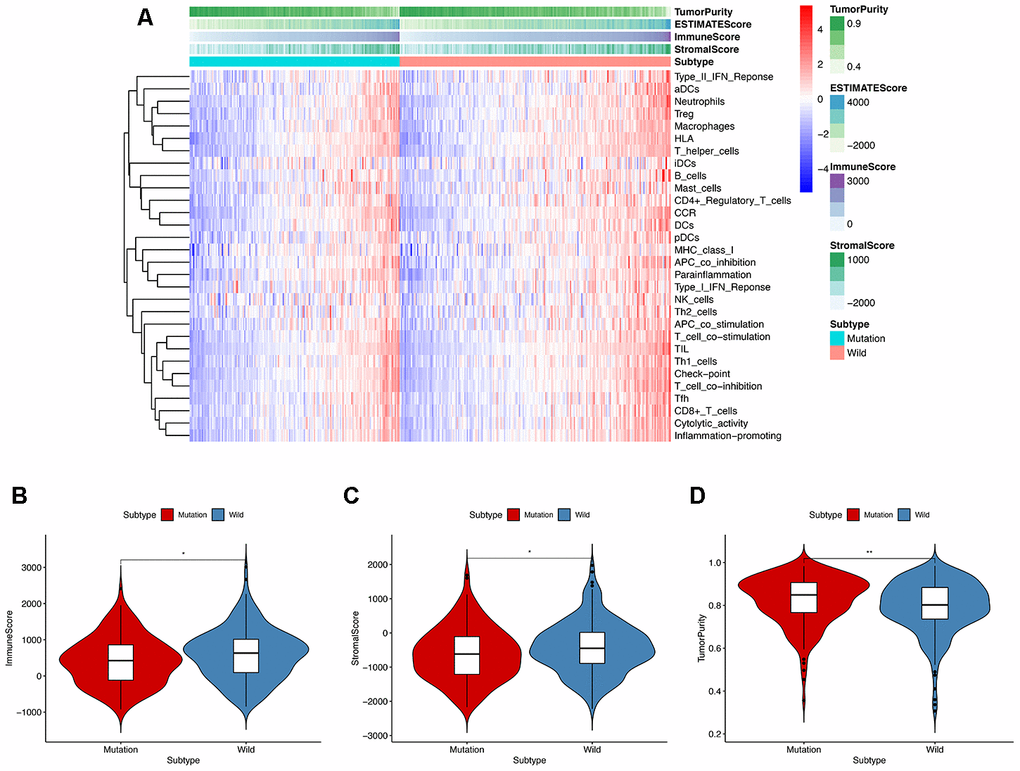
Figure 4. ssGESA and ESTIMATE analysis of the relationship between KRAS mutations and immune activities. (A) In ssGSEA, 30 immune-related pathways were incorporated to estimate the immune capacity of individual colon cancer samples. These gene sets were composed of immune cells and processes. The tumor purity, immune score, and stromal score are also shown in the heatmap. (B–D) Using the Mann-Whitney test, we found that the KRAS-mutated group was of lower immune and stromal score while its tumor purity was higher than the wild-type group.
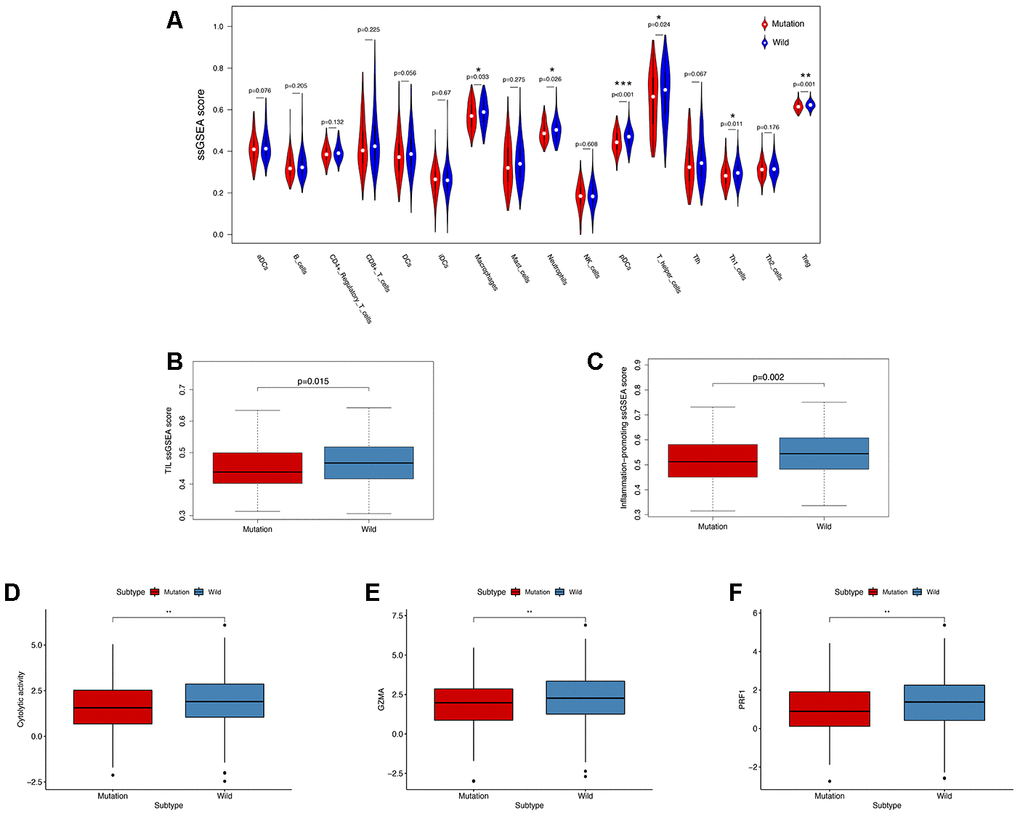
Figure 5. KRAS-mutated and wild-type groups differ in immune cell infiltration, inflammation, and cytolytic activities. (A) Relative infiltration levels of 17 immune cells in the KRAS-mutated and wild-type groups. P values were calculated using a Mann-Whitney test. (B, C) By comparing the ssGSEA score of two immune signatures, the KRAS-mutated group showed lower enrichment levels of TIL and inflammation-promoting. (D–F) The KRAS-mutated group showed a lower level of cytolytic activities and GZMA and PRF1 expression (* P<0.05, ** P<0.01, *** P<0.001).
Exploring the mechanism and function of KRAS mutation in immune activities
We analyzed TMB, HLA gene expression, and checkpoint-related genes in the KRAS-mutated and wild-type groups. Among the 19 HLA genes, 12 showed significantly lower expression levels in the KRAS-mutated group compared to the wild-type group (Figure 6A). For the checkpoint-related genes, we observed that BTLA, CD80, CD86, CTLA4, IDO1, PDCD1LG2, and TIGIT had decreased expression in the KRAS-mutated group (Figure 6B). Gene mutations can generate neoantigens that mediate anti-tumor immune activities, and TMB has also been shown to have a strong correlation with tumor immunity. However, there were no significant differences in TMB between the KRAS-mutated and wild-type groups. This suggests that TMB cannot explain their difference in immunity (Figure 6C). RAS-related pathways obtained from KEGG included RAP1, PI3K-ATK, mTOR, MAPK, FOXO, and ERBB signaling pathways. With the exception of mTOR and ERBB signaling pathways, most of the RAS-related pathways positively correlated with the immune signature. RAS (r = 0.61) and FOXO (r = 0.5) signaling pathways had strong positive correlations with neutrophils. RAS (r = 0.53) and PI3K-ATK signaling pathways (r = 0.56) exhibited a positive correlation with macrophages. There was also a positive correlation between the RAS signaling pathway and T-helper cells. Interestingly, neutrophils, macrophages, and T-helpers also showed differences in ssGSEA between the KRAS-mutated and wild-type groups. Finally, we used the Wilcoxon test to screen for differently expressed genes between the KRAS-mutated and wild-type groups, with FDR < 0.05. We calculated the Pearson correlation coefficients between these differentially expressed genes (Supplementary Table 6) and the immune score of every colon cancer sample from the TCGA datasets. We identified 24 genes, which had cor > 0.8 and p < 0.05 (Figure 7, Supplementary Table 7). The annotations of these genes are shown in Supplementary Table 8. KRAS mutations may affect the expression of these genes to further adjust the immune microenvironment.
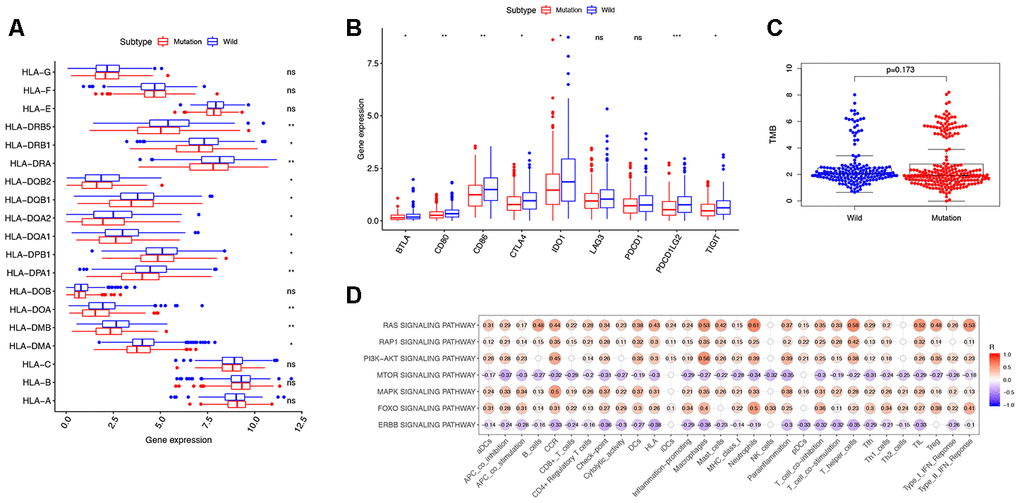
Figure 6. Exploring the mechanism of KRAS-related immune alteration. (A) 12 of the 19 HLA genes showed significantly lower expression levels in the KRAS-mutated group compared to the wild-type group. (B) The expression of 7 checkpoint-related genes (BTLA, CD80, CD86, CTLA4, IDO1, PDCD1LG2, and TIGIT) were lower in the KRAS-mutated group (* P<0.05, ** P<0.01, *** P<0.001). (C) Comparison of TMB between the KRAS-mutated and wild-type groups. (D) Spearman correlation analysis between 10 KRAS-related signaling pathways and 30 immune signatures.
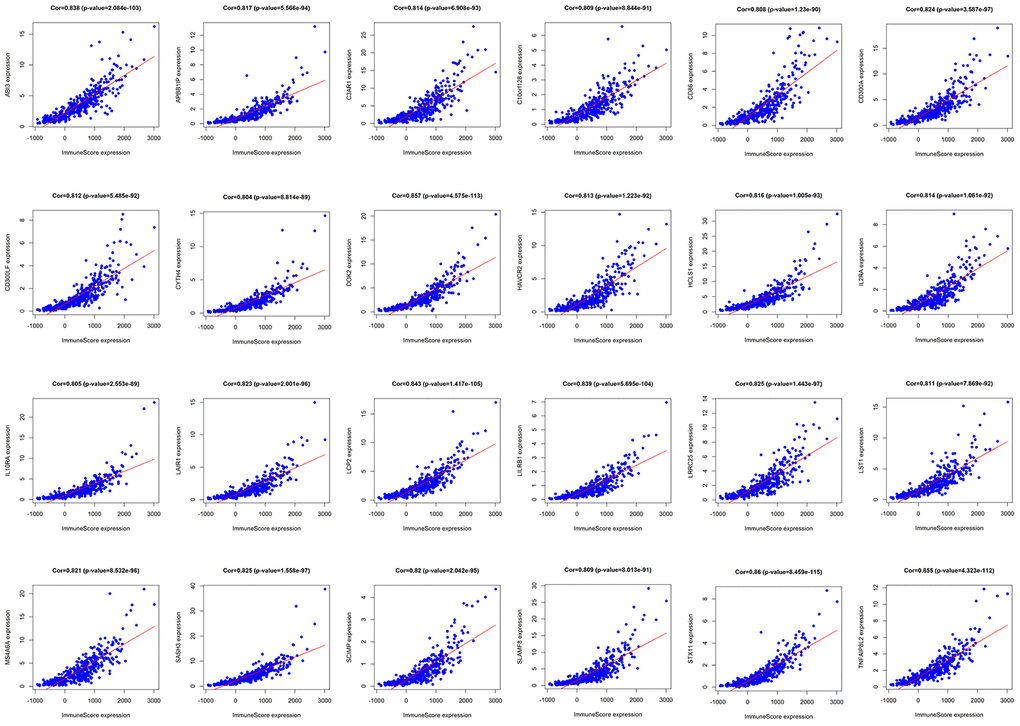
Figure 7. Pearson correlation analysis of immune score and differentially expressed genes. There were 24 differentially expressed genes that had a strong correlation with immune score, with cor>0.8 and P<0.05.
Discussion
Based on the gene mutational landscape in colon cancer, we found that KRAS mutations ranked in the top five of mutated genes in the TCGA and ICGC databases. KRAS is a member of the RAS family, which are G-proteins involved in intracellular signaling [31]. The contribution of RAS to anti-apoptosis, proliferation, and metastasis ability of cancer cells has been well validated [32, 33]. These activities were achieved via activation of several downstream effector pathways such as canonical PI3K-AKT-mTOR and RAF-MEK-ERK kinase cascades [34]. Numerous studies indicated that KRAS mutations serve as prognostic and predictive biomarkers in multiple types of cancer, as it can provide information for patients’ survival outcomes and suggestions on the use of EGFR-inhibitors. Activating KRAS was one of the most frequent oncogenic mutations in early colon cancer, recorded in 27–43% of patients [35]. Ablation of the KRAS mutation in colon cells can lead to tumor regression in mice, suggesting its importance in colon carcinogenesis [36]. In our study, we observed that rs121913529 was the most frequent mutational locus in colon cancer samples from the TCGA database. In addition, rs121913530 and rs121913529 correlated negatively with the survival rate of colon cancer patients. As the prognostic value of rs121913530 has only been proven in breast cancer among Chinese people, further validations are needed [37]. Given the significant oncogenic function of KRAS, drugs targeting KRAS may provide a promising selection for tumor therapy.
Recently, Liao et al. showed that the KRAS-IRF2 axis can drive immune suppression in colorectal cancer. A consensus molecular subtype classification provides some clues about the relationship between KRAS and immunity [38]. It was also reported that co-occurrence of KRAS and TP53 played a role in activating anti-tumor immunity and immune escape [39]. Still, the genetic heterogeneity of KRAS-mutant tumors impedes the development of immunotherapy for patients. Recent studies suggest that patients with activating mutations in KRAS may benefit from a PD-1 blockade, but the clinical experiments involved lung cancers with unclear underlying mechanisms [40, 41]. Few research studies have systemically analyzed the effect of KRAS mutations on immune activity in colon cancer. Therefore, we analyzed the relationship among KRAS mutations, immune cells, and pathways. From our results, KRAS mutations have a strong negative correlation with the immune response and cell infiltration. By comparing the ssGSEA enrichment scores, we found that the KRAS-mutated group had lower enrichment levels of TIL, inflammation, and cytolytic activity. KRAS-mutated groups had lower enrichment levels of macrophages, NK-cell differentiation, class I MHC-mediated antigen processing, B-cell receptor signaling, IL-2 and IL-17 pathways in ssGSEA. The relative infiltration levels of macrophages, neutrophils, dendritic cells, T-helper and T-regulatory cells were also lower in the KRAS-mutated group. We evaluated the patients’ cytolytic activity by calculating the geometric mean of GZMA and PRF1 expression. GZMA can lead to apoptosis without cascade activation, and PRF1 can help the granzyme enter and kill tumor cells [29]. Up-regulation of these two genes caused CD8+ T-cells and NK cells to activate and anti-CTLA-4 or anti-PD-L1 treatment to induce productive immune responses in the body. Some checkpoint-related genes (BTLA, CD80, CD86, CTLA4, IDO1, PDCD1LG2, and TIGIT) had decreased expression in the KRAS-mutated group, providing potential opportunities for immunotherapy in colon cancer.
Recent studies demonstrated that TMB could serve as a predictive biomarker for immunotherapy. Neoantigens presented by tumor cells can activate the infiltration of CD8+ T-cells to recognize antigens and release cytolytic enzyme into tumor cells [42]. However, the correlation among gene mutations, TMB, and immune activities in colon cancer remains unknown. Our results showed no significant difference in TMB between the KRAS-mutated and wild-type groups. This indicated that TMB could not explain the relationship between KRAS mutations and the immune response. HLA gene expression was different between the KRAS-mutated and wild-type groups, supporting the role of HLA genes in regulating KRAS-related immune activities. To explore the mechanism of immune differences between the two groups, we identified 24 differentially expressed genes, which strongly correlated with the immune score. These genes may participate in the upstream or downstream pathways of KRAS-related immune alteration. For example, overexpression of CD86 is one of the most recognized characteristics of M1 macrophages and a predictive biomarker for immunotherapy [43]. Redente et al. reported that the number of macrophages was increased in the background of a mutated oncogenic KRAS, providing support for mutated KRAS directing macrophage infiltration in tumor tissue [44]. There is a need to further investigate the predictive value of KRAS for immune activity in colon cancer. Future research should detail the mechanism of how KRAS mutation and its downstream signaling pathways alter the immune activities and clinical phenotypes of colon cancer.
Conclusions
In colon cancer, the KRAS gene was of high mutational frequency and rs121913529 was the most frequently mutated locus. Two loci of KRAS (rs121913529 and rs121913530) had prognostic value in patients with colon cancer. KRAS mutations had a strong negative correlation with TIL, inflammation, cytolytic activities, and HLA genes. Seven checkpoint-related genes (BTLA,CD80, CD86, CTLA4, IDO1, PDCD1LG2, and TIGIT) had decreased expression in the KRAS-mutated group, providing potential opportunities for immunotherapy in colon cancer. The KRAS-mutated group showed lower infiltration of macrophages, neutrophils, T-helper and T-regulatory cells. In order to explore the underlying mechanism, we also detected 24 immune-related genes that differed in expression in the KRAS-mutated and wild-type groups.
Materials and Methods
Downloaded data
We obtained somatic mutation data and clinical information of colon cancer samples from the TCGA database (n=399) via the GDC data portal (https://portal.gdc.cancer.gov/repository) and ICGC database (n=321, http://dcc.icgc.org/releases/current/Projects). We downloaded the RNA-seq data (level 3, HTSeq-FPKM) of 473 colon cancer patients with clinical information from the TCGA database. The mutation data was paired with the RNA-seq data according to patient ID. The annotations of genes were obtained from the Uniprot database (https://www.uniprot.org/).
Analysis of somatic gene mutations in colon cancer
For TCGA, we downloaded the “Masked Somatic Mutation” subtype of somatic mutation data and used the VarScan software for processing. We used an R package called “maftools” [45] to analyze and visualize the Mutation Annotation Format of somatic variants. We annotated TSV files containing somatic variant information from ICGC according to the hg19 reference genome. Both cohorts were visualized by the GenVisR package. The definition of TMB is the total number of coding errors of somatic genes per million bases, including base-pair substitutions, insertions, and deletions [20]. We counted all base-pair substitutions in the coding region of specific genes, except silent mutations that failed to alter amino acids. To calculate the TMB score of each sample, we divided the total number of mutations by the exome size (38 Mb). We analyzed the difference in overall survival rates between the mutated and wide-type groups using an R package called “survival.”
Implementation of ssGSEA and GSEA
We performed ssGSEA to acquire the enrichment score for each immune-related pair [46] and sample using an R package called “GSVA” [47] (Supplementary Table 1). We obtained 30 immune gene sets from several literature sources, including immune cell types and functions [48], tumor-infiltrating lymphocytes (TILs) [49], proinflammatory [50], para-inflammation (PI) [51], cytokine and cytokine receptor (CCR) [52], human leukocyte antigen (HLA) [53], regulatory T (Treg) cells [54], and immune checkpoints [55]. The ssGSEA applied gene signatures expressed by immune cells and pathways to the colon cancer samples. The approach used in our study involved immune cells and pathways in innate and adaptive immunity. We used an R package called “ESTIMATE” to calculate the immune score, tumor purity, and stromal score of every tumor sample [56]. The stromal score is defined as the presence of stroma in tumor tissue. The immune score is defined as the infiltration of immune cells in tumor tissue. The tumor purity score is defined as tumor purity. We performed GSEA to explore the correlated pathways of KRAS mutation. Gene ontology gene sets “c2.cp.v7.0.symbols.gmt” obtained from the Molecular Signatures Database (MSigDB, http://software.broadinstitute.org/gsea/downloads.jsp) were used for the enrichment analysis. The enriched gene set was considered statistically significant when the p value was less than 0.05. We demonstrated the correlation between KRAS mutations and immune cell infiltration by comparing the immune cell infiltration in KRAS-mutated and wild-type groups.
Statistical analysis
We used the Wilcoxon test to screen for gene expression differences between the KRAS-mutated and wild-type groups. We analyzed the relationship between differentially expressed genes and the immune score by calculating the Pearson correlation coefficients. The expression levels of checkpoint-related and HLA genes in the KRAS-mutated and wild-type groups were analyzed by the Mann–Whitney U test.
Supplementary Materials
Author Contributions
Qunguang Jiang, Xiaorui Fu and Xinyi Wang designed the study. Xinyi Wang and Taiyuan Li collected the mRNA transcriptome data and clinical information from TCGA and ICGC. Xiaorui Fu and Xinyi Wang performed analyses on the TCGA and ICGC data. Qunguang Jiang and Jinzhong Duanmu performed statistical analyses. Xiaorui Fu wrote the manuscript. Qunguang Jiang and Xinyi Wang reviewed and revised the manuscript. All authors read and approved the final manuscript.
Acknowledgments
The authors gratefully acknowledge contributions from the ICGC and TCGA databases.
Conflicts of Interest
The authors declare that they have no conflicts of interest.
Funding
This work was supported by a grant from National Natural Science Foundation of China (No:81560397 and 81660403).
References
- 1. Labianca R, Beretta GD, Kildani B, Milesi L, Merlin F, Mosconi S, Pessi MA, Prochilo T, Quadri A, Gatta G, de Braud F, Wils J. Colon cancer. Crit Rev Oncol Hematol. 2010; 74:106–33. https://doi.org/10.1016/j.critrevonc.2010.01.010 [PubMed]
- 2. Punt CJ, Koopman M, Vermeulen L. From tumour heterogeneity to advances in precision treatment of colorectal cancer. Nat Rev Clin Oncol. 2017; 14:235–46. https://doi.org/10.1038/nrclinonc.2016.171 [PubMed]
- 3. Muzny DM, Bainbridge MN, Chang K, Dinh HH, Drummond JA, Fowler G, Kovar CL, Lewis LR, Morgan MB, Newsham IF, Reid JG, Santibanez J, Shinbrot E, et al. Comprehensive molecular characterization of human colon and rectal cancer. Nature. 2012; 487:330–37. https://doi.org/10.1038/nature11252 [PubMed]
- 4. Kwong LN, Dove WF. APC and its modifiers in colon cancer. Adv Exp Med Biol. 2009; 656:85–106. https://doi.org/10.1007/978-1-4419-1145-2_8 [PubMed]
- 5. Narayan S, Roy D. Role of APC and DNA mismatch repair genes in the development of colorectal cancers. Mol Cancer. 2003; 2:41. https://doi.org/10.1186/1476-4598-2-41 [PubMed]
- 6. Soussi T, Wiman KG. TP53: an oncogene in disguise. Cell Death Differ. 2015; 22:1239–49. https://doi.org/10.1038/cdd.2015.53 [PubMed]
- 7. Iacopetta B. TP53 mutation in colorectal cancer. Hum Mutat. 2003; 21:271–76. https://doi.org/10.1002/humu.10175 [PubMed]
- 8. Arrington AK, Heinrich EL, Lee W, Duldulao M, Patel S, Sanchez J, Garcia-Aguilar J, Kim J. Prognostic and predictive roles of KRAS mutation in colorectal cancer. Int J Mol Sci. 2012; 13:12153–68. https://doi.org/10.3390/ijms131012153 [PubMed]
- 9. Siddiqui AD, Piperdi B. KRAS mutation in colon cancer: a marker of resistance to EGFR-I therapy. Ann Surg Oncol. 2010; 17:1168–76. https://doi.org/10.1245/s10434-009-0811-z [PubMed]
- 10. Huang L, Fu L. Mechanisms of resistance to EGFR tyrosine kinase inhibitors. Acta Pharm Sin B. 2015; 5:390–401. https://doi.org/10.1016/j.apsb.2015.07.001 [PubMed]
- 11. Boland CR, Goel A. Microsatellite instability in colorectal cancer. Gastroenterology. 2010; 138:2073–87.e3. https://doi.org/10.1053/j.gastro.2009.12.064 [PubMed]
- 12. Nojadeh JN, Behrouz Sharif S, Sakhinia E. Microsatellite instability in colorectal cancer. EXCLI J. 2018; 17:159–68. https://doi.org/10.17179/excli2017-948 [PubMed]
- 13. Terzić J, Grivennikov S, Karin E, Karin M. Inflammation and colon cancer. Gastroenterology. 2010; 138:2101–14.e5. https://doi.org/10.1053/j.gastro.2010.01.058 [PubMed]
- 14. Church J. Molecular genetics of colorectal cancer. Semin Colon Rectal Surg. 2016; 27:172–75. https://linkinghub.elsevier.com/retrieve/pii/S1043148916300203.
- 15. Rustgi AK. The genetics of hereditary colon cancer. Genes Dev. 2007; 21:2525–38. https://doi.org/10.1101/gad.1593107 [PubMed]
- 16. Kang CW, Dutta A, Chang LY, Mahalingam J, Lin YC, Chiang JM, Hsu CY, Huang CT, Su WT, Chu YY, Lin CY. Apoptosis of tumor infiltrating effector TIM-3+CD8+ T cells in colon cancer. Sci Rep. 2015; 5:15659. https://doi.org/10.1038/srep15659 [PubMed]
- 17. Samstein RM, Lee CH, Shoushtari AN, Hellmann MD, Shen R, Janjigian YY, Barron DA, Zehir A, Jordan EJ, Omuro A, Kaley TJ, Kendall SM, Motzer RJ, et al. Tumor mutational load predicts survival after immunotherapy across multiple cancer types. Nat Genet. 2019; 51:202–06. https://doi.org/10.1038/s41588-018-0312-8 [PubMed]
- 18. Ullman TA, Itzkowitz SH. Intestinal inflammation and cancer. Gastroenterology. 2011; 140:1807–16. https://doi.org/10.1053/j.gastro.2011.01.057 [PubMed]
- 19. Cullis J, Das S, Bar-Sagi D. Kras and tumor immunity: friend or foe? Cold Spring Harb Perspect Med. 2018; 8:a031849. https://doi.org/10.1101/cshperspect.a031849 [PubMed]
- 20. Goodman AM, Kato S, Bazhenova L, Patel SP, Frampton GM, Miller V, Stephens PJ, Daniels GA, Kurzrock R. Tumor mutational burden as an independent predictor of response to immunotherapy in diverse cancers. Mol Cancer Ther. 2017; 16:2598–608. https://doi.org/10.1158/1535-7163.MCT-17-0386 [PubMed]
- 21. Miao D, Margolis CA, Vokes NI, Liu D, Taylor-Weiner A, Wankowicz SM, Adeegbe D, Keliher D, Schilling B, Tracy A, Manos M, Chau NG, Hanna GJ, et al. Genomic correlates of response to immune checkpoint blockade in microsatellite-stable solid tumors. Nat Genet. 2018; 50:1271–81. https://doi.org/10.1038/s41588-018-0200-2 [PubMed]
- 22. Chang CH, Qiu J, O’Sullivan D, Buck MD, Noguchi T, Curtis JD, Chen Q, Gindin M, Gubin MM, van der Windt GJ, Tonc E, Schreiber RD, Pearce EJ, Pearce EL. Metabolic competition in the tumor microenvironment is a driver of cancer progression. Cell. 2015; 162:1229–41. https://doi.org/10.1016/j.cell.2015.08.016 [PubMed]
- 23. Brandt R, Sell T, Lüthen M, Uhlitz F, Klinger B, Riemer P, Giesecke-Thiel C, Schulze S, El-Shimy IA, Kunkel D, Fauler B, Mielke T, Mages N, et al. Cell type-dependent differential activation of ERK by oncogenic KRAS in colon cancer and intestinal epithelium. Nat Commun. 2019; 10:2919. https://doi.org/10.1038/s41467-019-10954-y [PubMed]
- 24. Parkhurst MR, Joo J, Riley JP, Yu Z, Li Y, Robbins PF, Rosenberg SA. Characterization of genetically modified t-cell receptors that recognize the CEA:691-699 peptide in the context of HLA-A2.1 on human colorectal cancer cells. Clin Cancer Res. 2009; 15:169–80. https://doi.org/10.1158/1078-0432.CCR-08-1638 [PubMed]
- 25. Yaghoubi N, Soltani A, Ghazvini K, Hassanian SM, Hashemy SI. PD-1/ PD-L1 blockade as a novel treatment for colorectal cancer. Biomed Pharmacother. 2019; 110:312–18. https://doi.org/10.1016/j.biopha.2018.11.105 [PubMed]
- 26. Nguyen LT, Ohashi PS. Clinical blockade of PD1 and LAG3—potential mechanisms of action. Nat Rev Immunol. 2015; 15:45–56. https://doi.org/10.1038/nri3790 [PubMed]
- 27. Woodsworth DJ, Dreolini L, Abraham L, Holt RA. Targeted cell-to-cell delivery of protein payloads via the granzyme-perforin pathway. Mol Ther Methods Clin Dev. 2017; 7:132–45. https://doi.org/10.1016/j.omtm.2017.10.003 [PubMed]
- 28. Johnson BJ, Costelloe EO, Fitzpatrick DR, Haanen JB, Schumacher TN, Brown LE, Kelso A. Single-cell perforin and granzyme expression reveals the anatomical localization of effector CD8+ T cells in influenza virus-infected mice. Proc Natl Acad Sci USA. 2003; 100:2657–62. https://doi.org/10.1073/pnas.0538056100 [PubMed]
- 29. Zaravinos A, Roufas C, Nagara M, de Lucas Moreno B, Oblovatskaya M, Efstathiades C, Dimopoulos C, Ayiomamitis GD. Cytolytic activity correlates with the mutational burden and deregulated expression of immune checkpoints in colorectal cancer. J Exp Clin Cancer Res. 2019; 38:364. https://doi.org/10.1186/s13046-019-1372-z [PubMed]
- 30. Narayanan S, Kawaguchi T, Yan L, Peng X, Qi Q, Takabe K. Cytolytic activity score to assess anticancer immunity in colorectal cancer. Ann Surg Oncol. 2018; 25:2323–31. https://doi.org/10.1245/s10434-018-6506-6 [PubMed]
- 31. Simanshu DK, Nissley DV, McCormick F. RAS proteins and their regulators in human disease. Cell. 2017; 170:17–33. https://doi.org/10.1016/j.cell.2017.06.009 [PubMed]
- 32. Pylayeva-Gupta Y, Grabocka E, Bar-Sagi D. RAS oncogenes: weaving a tumorigenic web. Nat Rev Cancer. 2011; 11:761–74. https://doi.org/10.1038/nrc3106 [PubMed]
- 33. Fernández-Medarde A, Santos E. Ras in cancer and developmental diseases. Genes Cancer. 2011; 2:344–58. https://doi.org/10.1177/1947601911411084 [PubMed]
- 34. Zhou B, Der CJ, Cox AD. The role of wild type RAS isoforms in cancer. Semin Cell Dev Biol. 2016; 58:60–69. https://doi.org/10.1016/j.semcdb.2016.07.012 [PubMed]
- 35. Demory Beckler M, Higginbotham JN, Franklin JL, Ham AJ, Halvey PJ, Imasuen IE, Whitwell C, Li M, Liebler DC, Coffey RJ. Proteomic analysis of exosomes from mutant KRAS colon cancer cells identifies intercellular transfer of mutant KRAS. Mol Cell Proteomics. 2013; 12:343–55. https://doi.org/10.1074/mcp.M112.022806 [PubMed]
- 36. Calcagno SR, Li S, Colon M, Kreinest PA, Thompson EA, Fields AP, Murray NR. Oncogenic k-ras promotes early carcinogenesis in the mouse proximal colon. Int J Cancer. 2008; 122:2462–70. https://doi.org/10.1002/ijc.23383 [PubMed]
- 37. Tong L, Yang XX, Liu MF, Yao GY, Dong JY, Ye CS, Li M. Mutational analysis of key EGFR pathway genes in Chinese breast cancer patients. Asian Pac J Cancer Prev. 2012; 13:5599–603. https://doi.org/10.7314/apjcp.2012.13.11.5599 [PubMed]
- 38. Liao W, Overman MJ, Boutin AT, Shang X, Zhao D, Dey P, Li J, Wang G, Lan Z, Li J, Tang M, Jiang S, Ma X, et al. KRAS-IRF2 axis drives immune suppression and immune therapy resistance in colorectal cancer. Cancer Cell. 2019; 35:559–72.e7. https://doi.org/10.1016/j.ccell.2019.02.008 [PubMed]
- 39. Skoulidis F, Byers LA, Diao L, Papadimitrakopoulou VA, Tong P, Izzo J, Behrens C, Kadara H, Parra ER, Canales JR, Zhang J, Giri U, Gudikote J, et al. Co-occurring genomic alterations define major subsets of KRAS-mutant lung adenocarcinoma with distinct biology, immune profiles, and therapeutic vulnerabilities. Cancer Discov. 2015; 5:860–77. https://doi.org/10.1158/2159-8290.CD-14-1236 [PubMed]
- 40. Rizvi NA, Hellmann MD, Snyder A, Kvistborg P, Makarov V, Havel JJ, Lee W, Yuan J, Wong P, Ho TS, Miller ML, Rekhtman N, Moreira AL, et al. Cancer immunology. Mutational landscape determines sensitivity to PD-1 blockade in non-small cell lung cancer. Science. 2015; 348:124–28. https://doi.org/10.1126/science.aaa1348 [PubMed]
- 41. Borghaei H, Paz-Ares L, Horn L, Spigel DR, Steins M, Ready NE, Chow LQ, Vokes EE, Felip E, Holgado E, Barlesi F, Kohlhäufl M, Arrieta O, et al. Nivolumab versus docetaxel in advanced nonsquamous non-small-cell lung cancer. N Engl J Med. 2015; 373:1627–39. https://doi.org/10.1056/NEJMoa1507643 [PubMed]
- 42. Gajewski TF, Schreiber H, Fu YX. Innate and adaptive immune cells in the tumor microenvironment. Nat Immunol. 2013; 14:1014–22. https://doi.org/10.1038/ni.2703 [PubMed]
- 43. Edwards JP, Zhang X, Frauwirth KA, Mosser DM. Biochemical and functional characterization of three activated macrophage populations. J Leukoc Biol. 2006; 80:1298–307. https://doi.org/10.1189/jlb.0406249 [PubMed]
- 44. Redente EF, Dwyer-Nield LD, Merrick DT, Raina K, Agarwal R, Pao W, Rice PL, Shroyer KR, Malkinson AM. Tumor progression stage and anatomical site regulate tumor-associated macrophage and bone marrow-derived monocyte polarization. Am J Pathol. 2010; 176:2972–85. https://doi.org/10.2353/ajpath.2010.090879 [PubMed]
- 45. Mayakonda A, Lin DC, Assenov Y, Plass C, Koeffler HP. Maftools: efficient and comprehensive analysis of somatic variants in cancer. Genome Res. 2018; 28:1747–56. https://doi.org/10.1101/gr.239244.118 [PubMed]
- 46. Barbie DA, Tamayo P, Boehm JS, Kim SY, Moody SE, Dunn IF, Schinzel AC, Sandy P, Meylan E, Scholl C, Fröhling S, Chan EM, Sos ML, et al. Systematic RNA interference reveals that oncogenic KRAS-driven cancers require TBK1. Nature. 2009; 462:108–12. https://doi.org/10.1038/nature08460 [PubMed]
- 47. Subramanian A, Tamayo P, Mootha VK, Mukherjee S, Ebert BL, Gillette MA, Paulovich A, Pomeroy SL, Golub TR, Lander ES, Mesirov JP. Gene set enrichment analysis: a knowledge-based approach for interpreting genome-wide expression profiles. Proc Natl Acad Sci USA. 2005; 102:15545–50. https://doi.org/10.1073/pnas.0506580102 [PubMed]
- 48. Rooney MS, Shukla SA, Wu CJ, Getz G, Hacohen N. Molecular and genetic properties of tumors associated with local immune cytolytic activity. Cell. 2015; 160:48–61. https://doi.org/10.1016/j.cell.2014.12.033 [PubMed]
- 49. Massink MP, Kooi IE, Martens JW, Waisfisz Q, Meijers-Heijboer H. Genomic profiling of CHEK2*1100delC-mutated breast carcinomas. BMC Cancer. 2015; 15:877. https://doi.org/10.1186/s12885-015-1880-y [PubMed]
- 50. Bedognetti D, Hendrickx W, Marincola FM, Miller LD. Prognostic and predictive immune gene signatures in breast cancer. Curr Opin Oncol. 2015; 27:433–44. https://doi.org/10.1097/CCO.0000000000000234 [PubMed]
- 51. Aran D, Lasry A, Zinger A, Biton M, Pikarsky E, Hellman A, Butte AJ, Ben-Neriah Y. Widespread parainflammation in human cancer. Genome Biol. 2016; 17:145. https://doi.org/10.1186/s13059-016-0995-z [PubMed]
- 52. Wong HS, Chang CM, Liu X, Huang WC, Chang WC. Characterization of cytokinome landscape for clinical responses in human cancers. Oncoimmunology. 2016; 5:e1214789. https://doi.org/10.1080/2162402X.2016.1214789 [PubMed]
- 53. Charoentong P, Finotello F, Angelova M, Mayer C, Efremova M, Rieder D, Hackl H, Trajanoski Z. Pan-cancer immunogenomic analyses reveal genotype-immunophenotype relationships and predictors of response to checkpoint blockade. Cell Rep. 2017; 18:248–62. https://doi.org/10.1016/j.celrep.2016.12.019 [PubMed]
- 54. Liu Z, Li M, Jiang Z, Wang X. A comprehensive immunologic portrait of triple-negative breast cancer. Transl Oncol. 2018; 11:311–29. https://doi.org/10.1016/j.tranon.2018.01.011 [PubMed]
- 55. De Simone M, Arrigoni A, Rossetti G, Gruarin P, Ranzani V, Politano C, Bonnal RJ, Provasi E, Sarnicola ML, Panzeri I, Moro M, Crosti M, Mazzara S, et al. Transcriptional landscape of human tissue lymphocytes unveils uniqueness of tumor-infiltrating T regulatory cells. Immunity. 2016; 45:1135–47. https://doi.org/10.1016/j.immuni.2016.10.021 [PubMed]
- 56. Yoshihara K, Shahmoradgoli M, Martínez E, Vegesna R, Kim H, Torres-Garcia W, Treviño V, Shen H, Laird PW, Levine DA, Carter SL, Getz G, Stemke-Hale K, et al. Inferring tumour purity and stromal and immune cell admixture from expression data. Nat Commun. 2013; 4:2612. https://doi.org/10.1038/ncomms3612 [PubMed]
- 57. Kim S. Ppcor: an R package for a fast calculation to semi-partial correlation coefficients. Commun Stat Appl Methods. 2015; 22:665–74. https://doi.org/10.5351/CSAM.2015.22.6.665 [PubMed]