Submit an Article
Navigate
Home
Editorial Board
Editorial Policies
Current Volume
Archive
Scientific Integrity
Publication Ethics Statements
Interviews with Outstanding Authors
Newsroom
Sponsored Conferences
Podcast
Contact
Special Collections
Submit an Article
Online ISSN: 1945-4589
Research Paper
|
Volume 13, Issue 1
|
pp. 750–768
KRAS mutations are negatively correlated with immunity in colon cancer
Back to article
Figure 7
(7 of 7)
−
100%
+
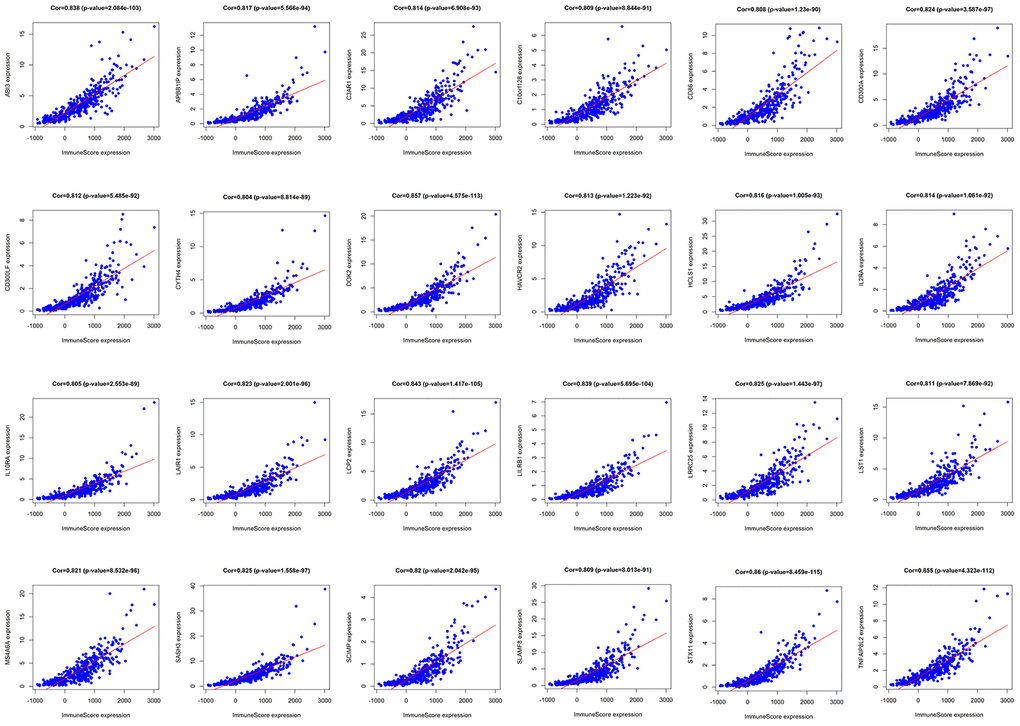
Figure 7.
Pearson correlation analysis of immune score and differentially expressed genes.
There were 24 differentially expressed genes that had a strong correlation with immune score, with cor>0.8 and P<0.05.