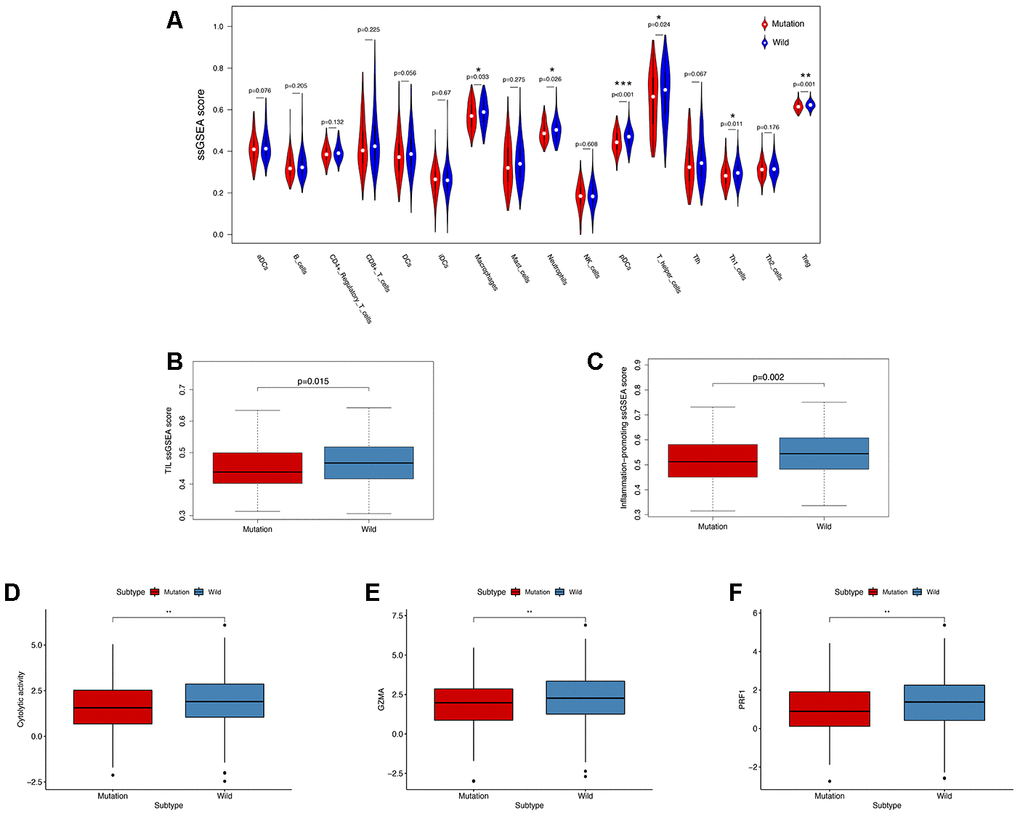
Figure 5.KRAS-mutated and wild-type groups differ in immune cell infiltration, inflammation, and cytolytic activities. (A) Relative infiltration levels of 17 immune cells in the KRAS-mutated and wild-type groups. P values were calculated using a Mann-Whitney test. (B, C) By comparing the ssGSEA score of two immune signatures, the KRAS-mutated group showed lower enrichment levels of TIL and inflammation-promoting. (D–F) The KRAS-mutated group showed a lower level of cytolytic activities and GZMA and PRF1 expression (* P<0.05, ** P<0.01, *** P<0.001).