


Introduction
Aging is defined as a progressive decline in physiological function, which results in increased risk of chronic diseases such as cancer, diabetes, and Alzheimer’s [1]. Geroscience has identified that environmental and genetic factors influence aging process. Genetically regulated longevity mechanisms have been identified to be evolutionarily conserved in Caenorhabditis elegans, Drosophila melanogaster and Mus musculus [2, 3]. Endocrine signaling is the most studied modulator of longevity in animal models [4–7]. Specifically, disruption of the growth hormone (GH) and insulin-like growth factor (IGF-1) pathways are linked to increased lifespan in mice [6, 8, 9]. In humans, a recent study showed that familial longevity is associated with lower GH secretion [10].
Ames and Snell mice are dwarf due to mutations in the Prophet of Pit-1 (Prop-1) and pituitary factor-1 (Pit1) genes, respectively, in the anterior pituitary [11, 12]. These mutations result in suppression of GH signaling in mice, which causes delayed aging, improved longevity, and increased insulin sensitivity. In addition, these mice have reduced age-related loss of cognitive function and decreased occurrence of neoplastic disease [13]. Additionally, in these models prolactin (PRL) is absent and levels of thyroid-stimulating hormone (TSH) is greatly reduced in the plasma [14, 15]. GH receptor/GH-binding protein (GHR/GHBP) knockout mice, which were made in the Kopchick lab, have higher levels of serum growth hormone in both sexes [16].
To generate an isolated growth hormone deficiency model, the Salvatori lab used traditional embryonic stem cell (ESC) based gene-targeting method to knock out growth hormone-releasing hormone (GHRH), which is a hypothalamic peptide that controls both the synthesis and secretion of GH [17, 18]. These mutant mice have significantly decreased body weight and possess increased insulin sensitivity and prolonged lifespan indicating GH deficiency is primarily responsible for longevity extension [5]. This GHRH-/- model was generated using 129SV agouti color mice resulting in the co-segregation of GHRH-/- and agouti alleles. Agouti is an important component of several biological pathways, including body weight homeostasis, regulation of food intake and, energy expenditure [19]. In addition, its expression was associated with metabolic syndrome [20]. Our goal for this study is to delineate the direct physiological and metabolic consequences of GH deficiency. To achieve this goal, we knocked out the GHRH gene with CRISPR/Cas9 technology, preventing the agouti gene from acting as a passenger allele. We produced our experimental knockout model on mixed genetic background to avoid any phenotype resulting from strain-specific inbreeding. This is the first in-depth metabolic and physiological profiling of GH-suppressed mice generated with CRISPR/Cas9 technology on mixed genetic background.
Our novel GHRH-/- mice have decreased body weight and higher insulin sensitivity despite having normal glucose tolerance. GH deficiency resulted in dramatically decreased bone mineral density (BMD), bone mineral content (BMC), and lean mass. However, GHRH-/- mice have significantly increased fat mass compared to littermate controls. Indirect calorimetry allowed us to measure physiological respiratory parameters, which were used to calculate respiratory exchange ratio (RER) and energy expenditure. RER data demonstrated a significant difference in metabolism between GHRH-/- and wild type (WT) mice during light cycle. GHRH-/- mice had significantly lower energy expenditure during both light and dark cycles. Our GH-deficient mouse model has physiological characteristics consistent with our previous study and similar to other GH-related mutants. It was hypothesized that slowing the biological process of aging is associated with GH deficiency. Our model helps understand key physiological and metabolic characteristics that are involved in the process of aging.
Results
Utilizing CRISPR/Cas9-mediated gene-editing method, we generated homozygous GHRH-/- mice (Figure 1A). In a litter of 10 G0 pups, 8 carried indels and large deletions in the GHRH locus. Our targeted allele (#28528) is a 291 base pairs deletion that eliminates the splice donor site at exon 2, intron 2-3 and a large part of Exon 3 (77 base pairs out of 102 base pairs); this allele was selected based on, successful germline transmission (Figure 1A, 1B). Predicted translation of the resulting sequence suggests an in-frame mutation leading to a loss of 26 amino acids, including 21 amino acids required for full activity (RMQRHVDAIFTTNYRKLLSQLYARKV). The line was used in all subsequent studies. We measured body weight and food consumption of GHRH-/- and WT littermates longitudinally. Male and female GHRH-/- mice were significantly lighter than their littermate controls (Figure 1C, 1D). In addition, GHRH-/- mice consumed dramatically fewer calories than WT littermates (Figure 1E, 1F).
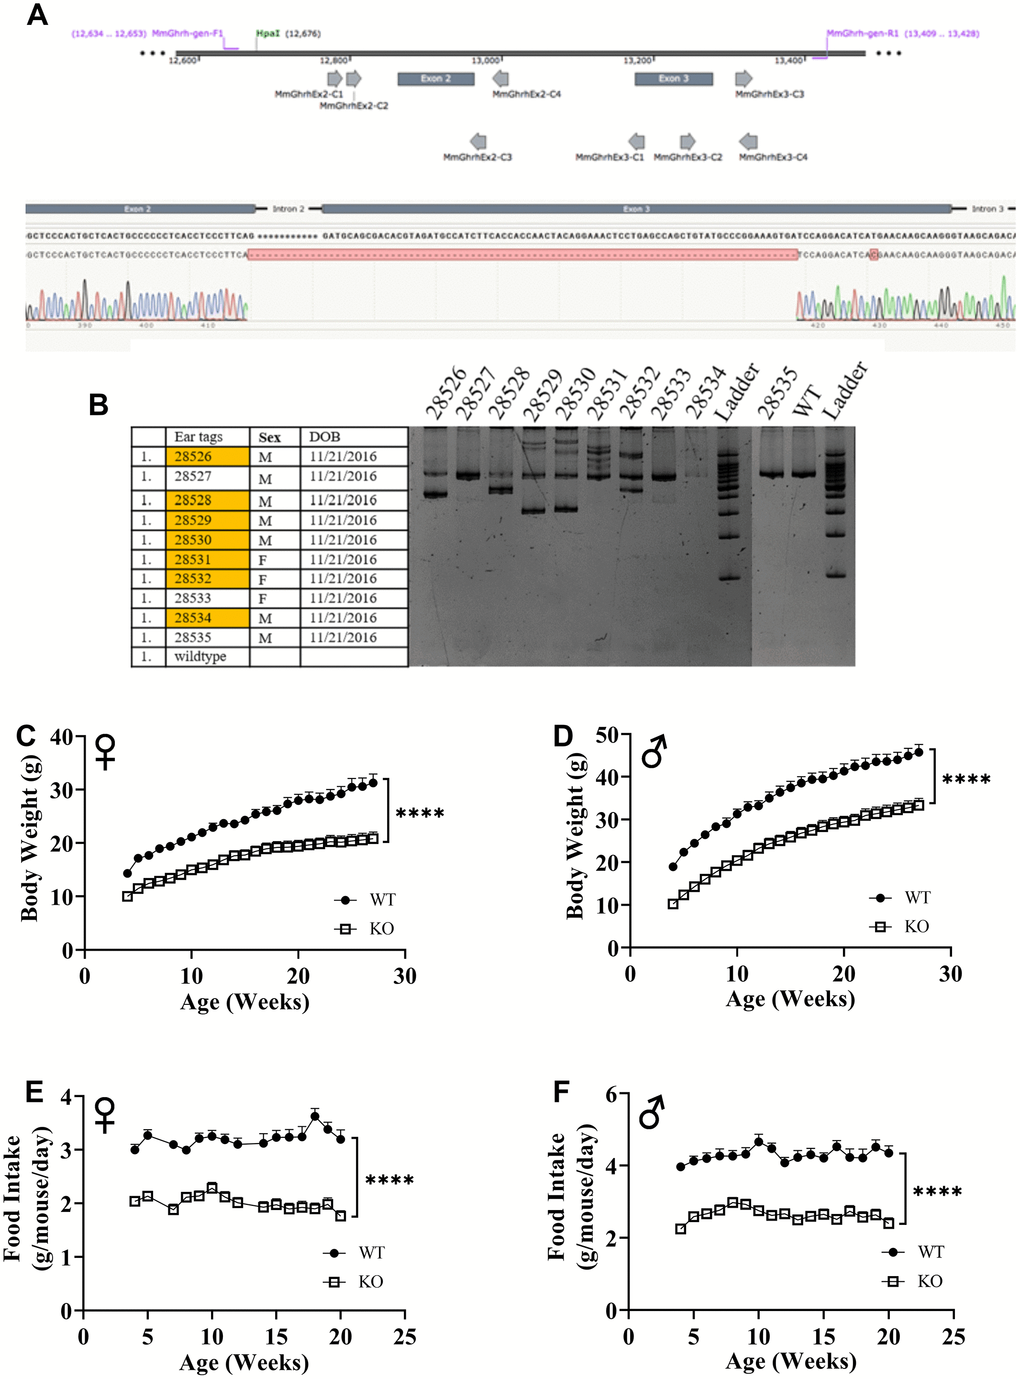
Figure 1. GHRH knockout with CRISPR technology. Location of guide RNAs with respect to exon 2 and exon 3 of GHRH and DNA sequencing chromatogram of mutant GHRH gene between exon 2 and intron 3. (A) Identification of mutations introduced by CRISPR/Cas9 in GHRH gene in founder animals by PCR analysis. (B) 10 G0 pups were tested for indels or deletions. 28528 had a 291 base pairs deletion that eliminates the splice donor site at exon 2, intron 2-3 and a large part of Exon 3 (77 base pairs out of 102 base pairs), showed successful germline transmission. (B) Body weights of female (C) and male (D) WT and GHRH-/- mice from weaning to adulthood. Food intake per mice per day of female (E) and male (F) WT and GHRH-/- mice. Female WT n=11, GHRH-/- n=14, male WT n=11, GHRH-/- n=15. Each bar represents mean ± SEM. Statistical analysis was performed by unpaired Student’s t-test with Welch’s correction; ****p<0.0001.
Previously, knockout of GHRH gene was shown to result in significant reduction of GH expression in pituitary and IGF-1 expression in liver [17]. To assess loss of function of GHRH, we measured mRNA levels of GH in pituitary and IGF-1 in liver. We observed that expression of both GH and IGF-1 genes were significantly decreased in GHRH-/- mice compared to WT littermates (Figure 2A, 2B, 2E, 2F). These results confirm the reduction in GH/IGF-1 signaling. However, we did not observe significant change in prolactin expression in the pituitary (Figure 2C, 2D).
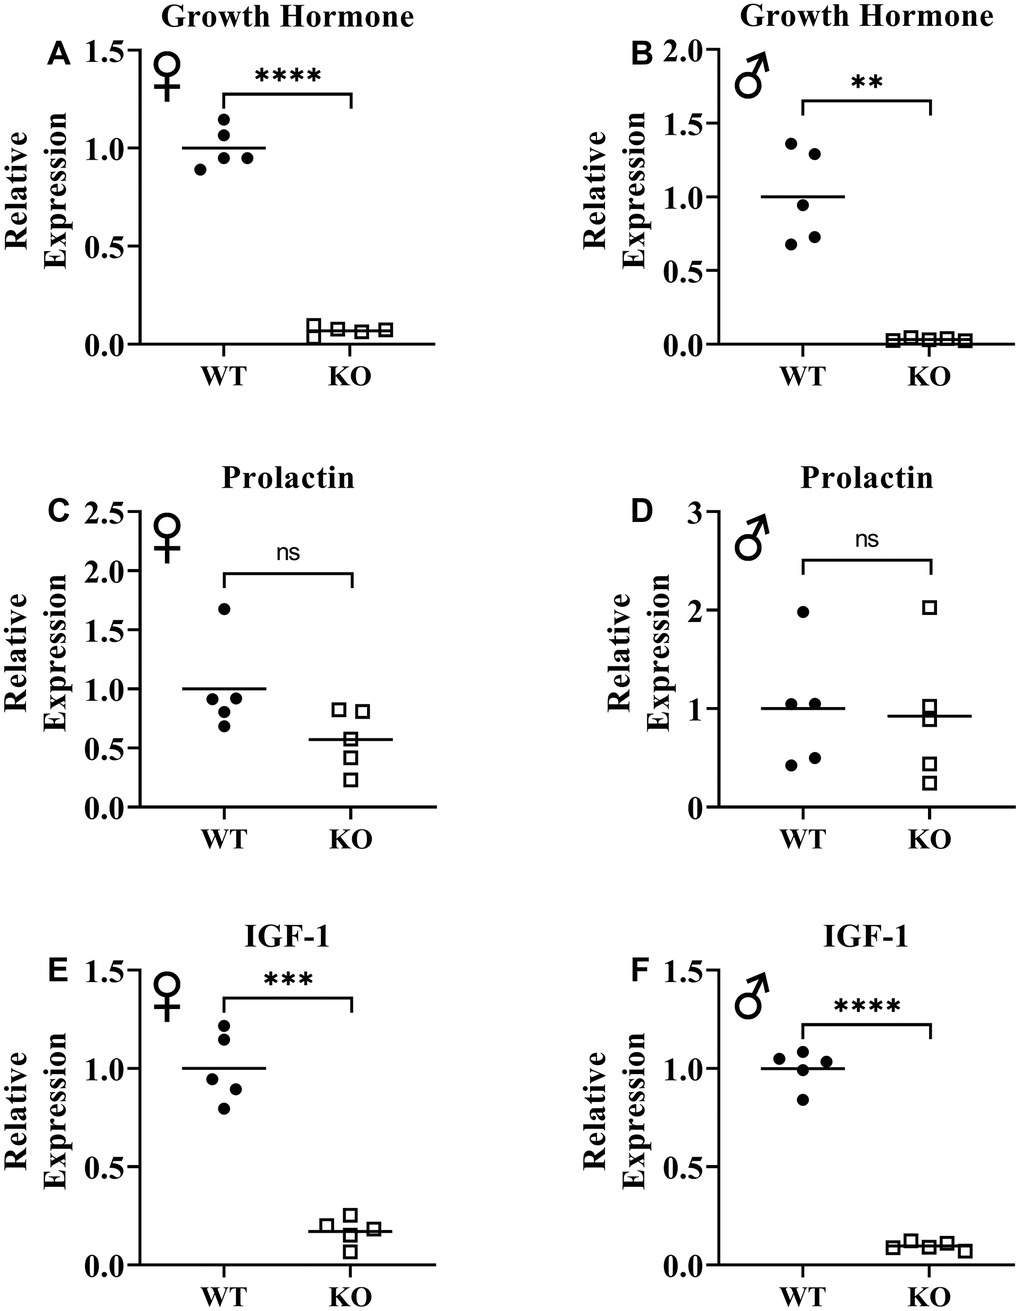
Figure 2. Suppression of growth hormone signaling. Expression of growth hormone gene in pituitary gland in female (A) and male (B) WT and GHRH-/- mice. Expression of prolactin gene in pituitary gland in female (C) and male (D) WT and GHRH-/- mice. Expression of IGF-1 gene in liver in female (E) and male (F) WT and GHRH-/- mice. Expression levels are shown as relative expression compared to WT mice. For all biological groups n=5. Each bar represents means. Statistical analysis was performed by unpaired Student’s t-test with Welch’s correction; ns= not significant, **p<0.01, ***p<0.001, ****p<0.0001.
The effect of GH signaling on body weight (Figure 3A, 3B) and composition is well documented in GH related mutant mice [21–23]. Therefore, we performed dual-energy X-ray absorptiometry (DXA) to study the effects of reduced GH signaling on body composition parameters in our knockout model of GHRH. Absolute BMD, BMC, and lean mass values were significantly lower in both male and female GHRH-/- mice compared to WT littermates (Figure 3C–3H). In order to account for the significant body weight differences between GHRH-/- and WT mice, we used analysis of covariance (ANCOVA) method, which revealed that BMD, BMC, and lean mass were significantly reduced (Figure 4A–4F), whereas, fat mass was significantly increased in GHRH-/- mice (Figure 4G, 4H).
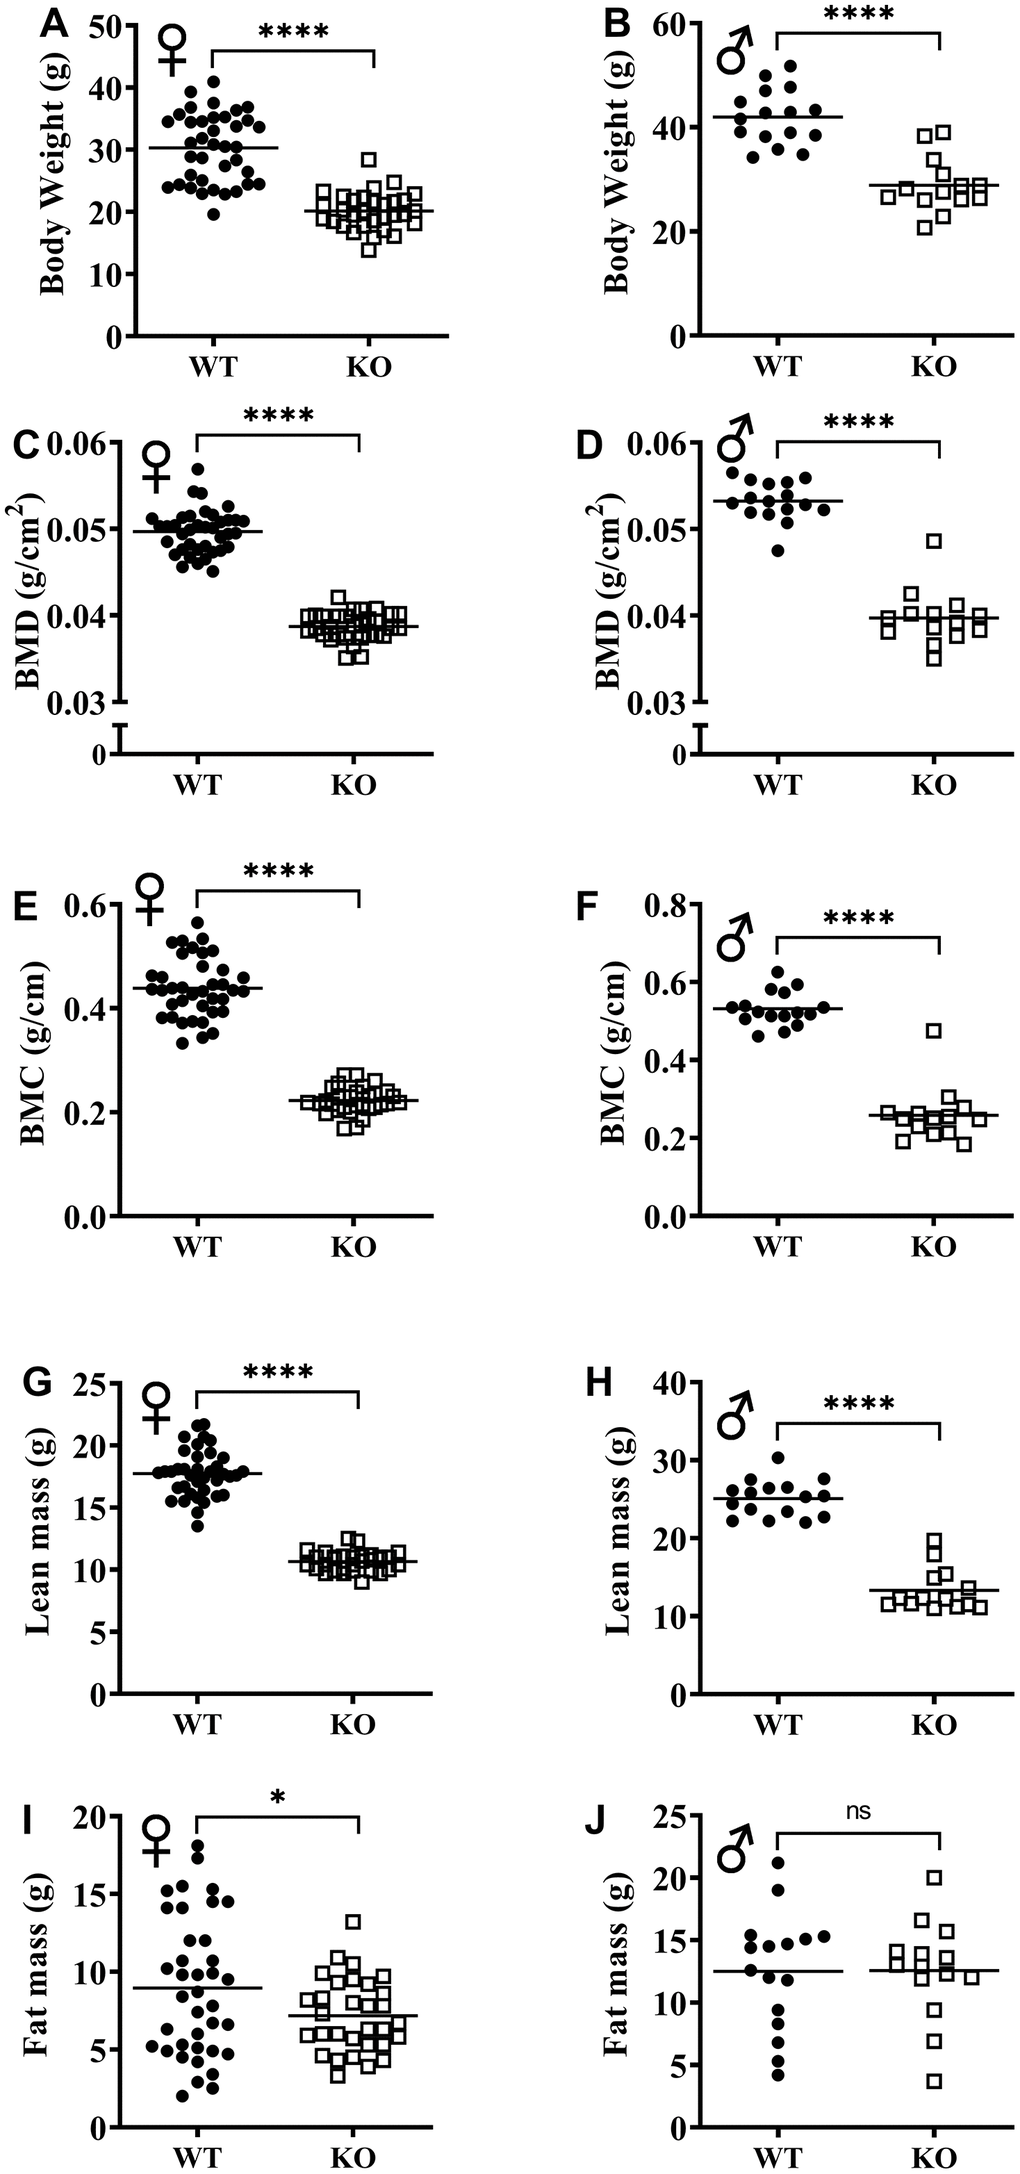
Figure 3. GH-deficiency alters absolute body composition parameters. Body composition parameters: BMD (C, D), BMC (E, F), lean mass (G, H) and fat mass (I, J) were measured by DXA. Female WT n=38, GHRH-/- n=31, male WT n=16, GHRH-/- n=14. Each bar represents mean. Statistical analysis was performed by unpaired Student’s t-test with Welch’s correction; ns= not significant, *p<0.05, ****p<0.0001.
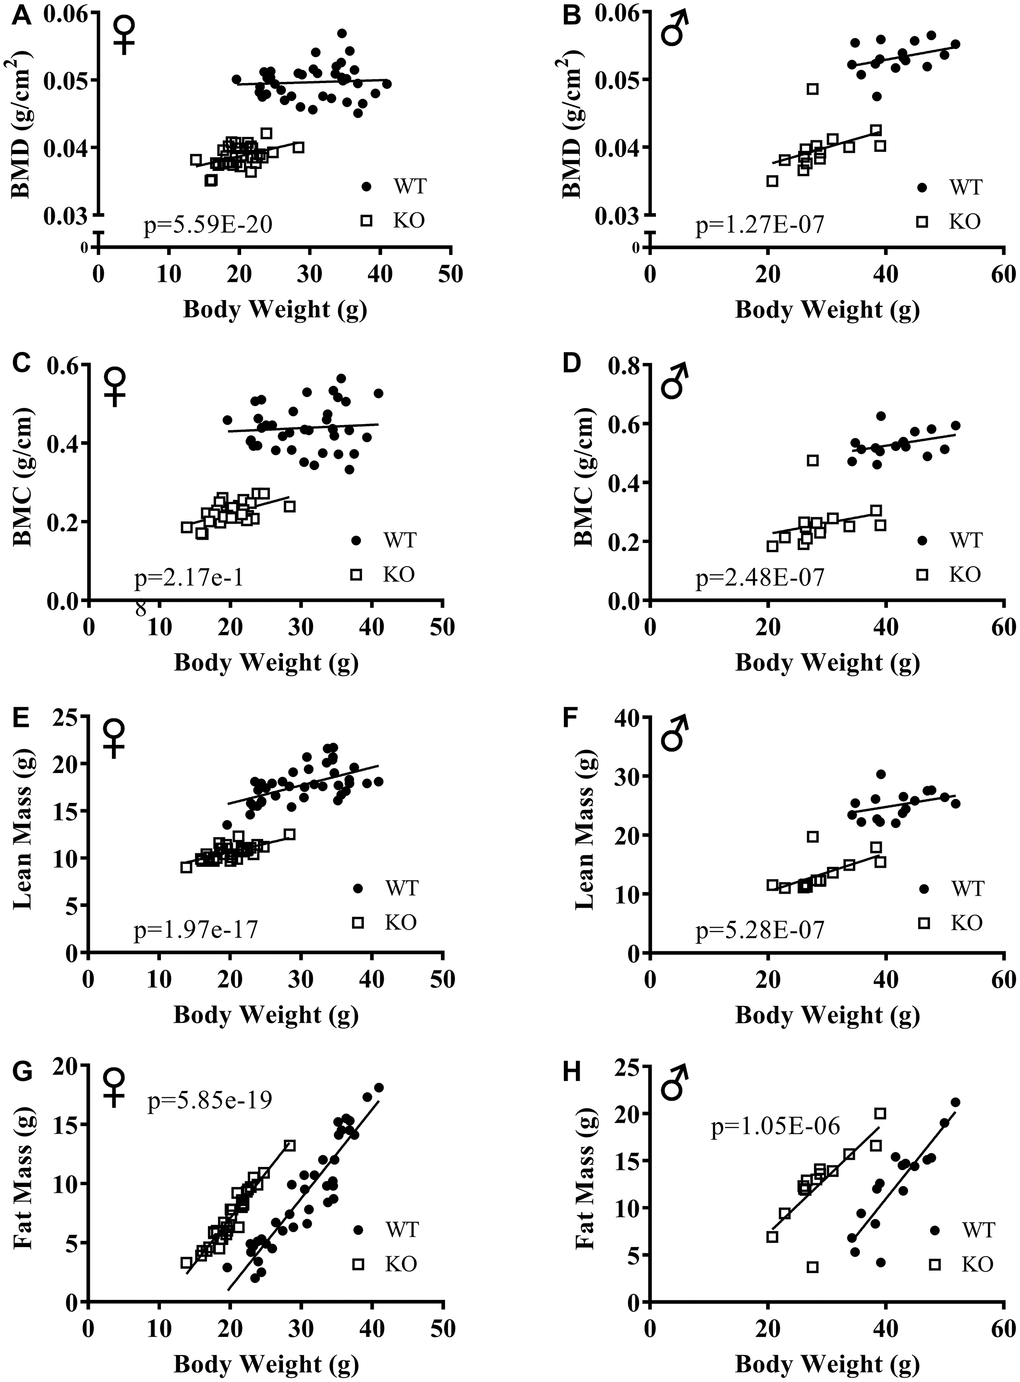
Figure 4. ANCOVA shows that GH-deficiency alters body composition parameters. Body composition parameters were measured by DXA. Body composition parameters are plotted on the y-axis and body weights are plotted on the x-axis (A–H). Relationship between body weight and BMD in female (A) and male (B) WT and GHRH-/- mice. Relationship between body weight and BMC in female (C) and male (D) WT and GHRH-/- mice. Relationship between body weight and lean mass in female (E) and male (F) WT and GHRH-/- mice. Relationship between body weight and fat mass in female (G) and male (H) WT and GHRH-/- mice. Female WT n=38, GHRH-/- n=31, male WT n=16, GHRH-/- n=14. The WT and GHRH-/- groups were statistically analyzed with ANCOVA method, which was used to calculate p values, shown on each panel.
To explore the effect of GH deficiency on metabolic phenotype of mice, we measured RER using indirect calorimetry. Figure 5A, 5B provides overview of RER values for each hour recorded for 6 days for female and male mice, respectively. Notably, the RER of both male and female GHRH-/- mice decreased much more rapidly during the transition between dark and light cycles compared with WT littermates (Figure 5A, 5B). RER measurements collected for 6 days were averaged into a single day (Figure 5C, 5D). These results indicate lower RER for both male and female GHRH-/- mice compared to WT littermates during the light cycle, but not the dark cycle (Figure 5C, 5D). Comparisons of RER confirm that the significant differences in metabolism functions in a circadian manner (Figure 5E–5H).
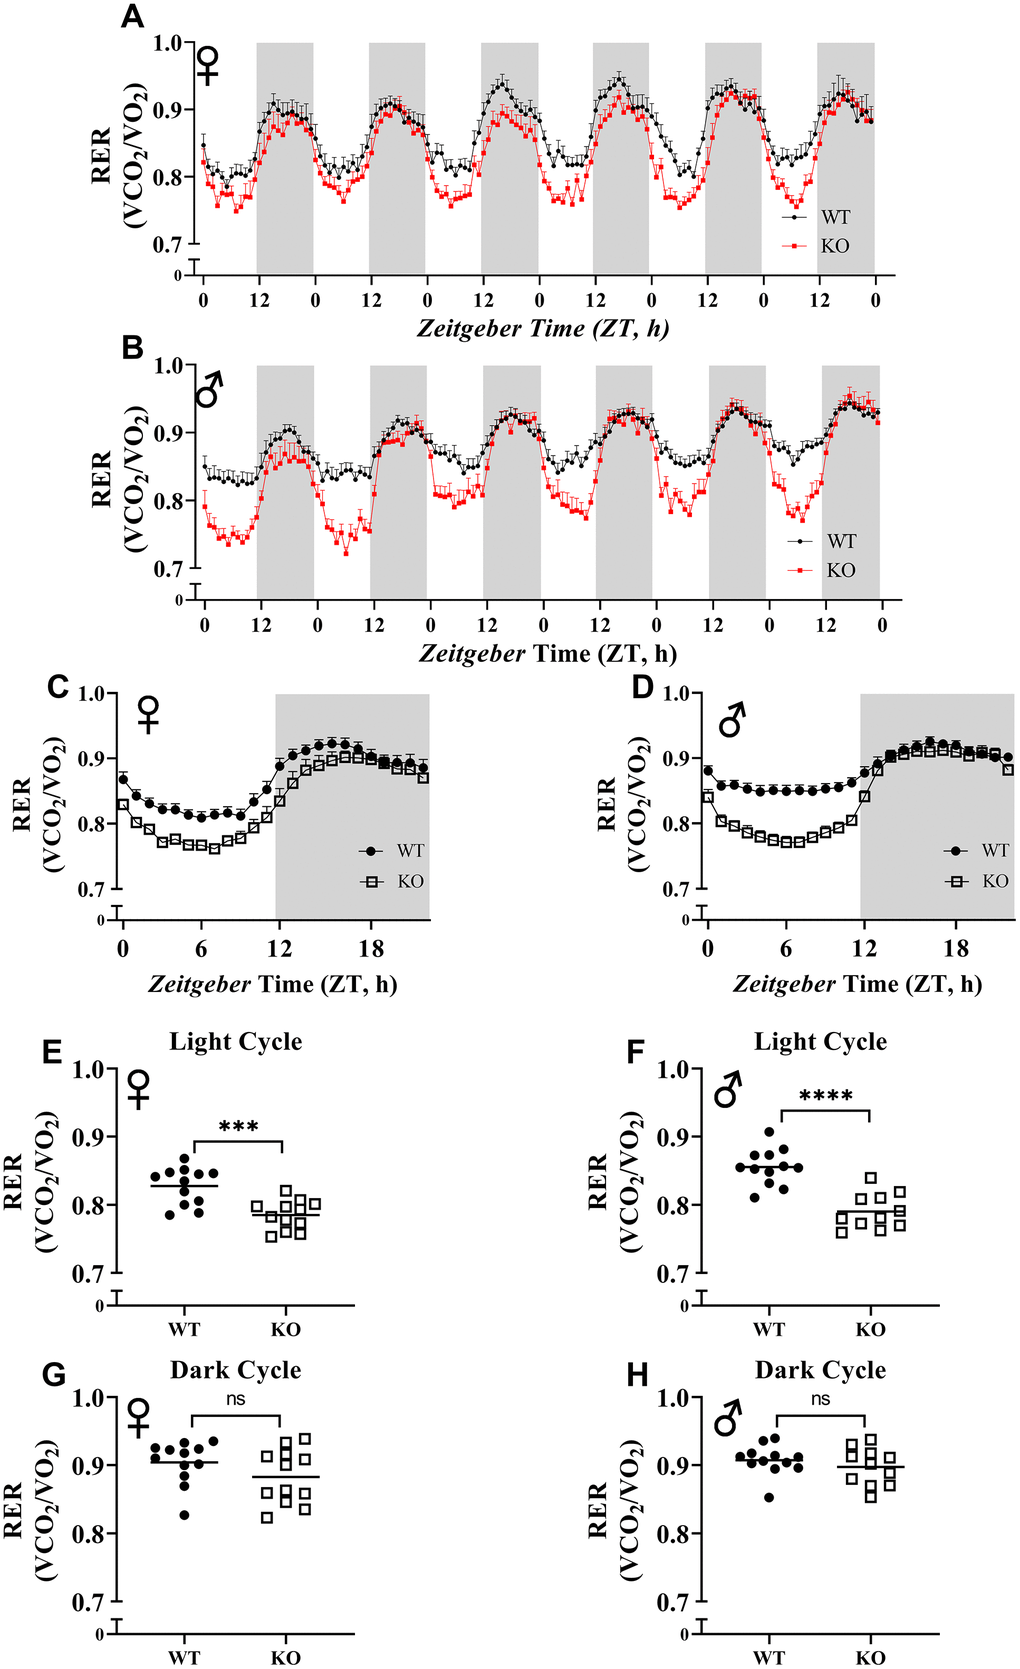
Figure 5. Respiratory exchange ratio (VCO2/VO2). RER values were calculated by dividing VCO2 with VO2. 6 days of female (A) and male (B) WT and GHRH-/- mice RER values are shown. Hourly averaged RER values on day of female (C) and male (D) WT and GHRH-/- mice. Overall averaged RER values are shown as light (E, F) and dark cycles (G, H) for female (E, G) and male (F, H) WT and GHRH-/- mice. Female WT n=12, GHRH-/- n=12, male WT n=12, GHRH-/- n=11. Each bar represents mean ± SEM. Statistical analysis was performed by unpaired Student’s t-test with Welch’s correction; ns= not significant, a; *p<0.05, b; **p<0.01, c; ***p<0.001, d; ****p<0.0001.
Figure 6A, 6B, 6E, 6F show mean hourly oxygen consumption (VO2) and carbon dioxide production (VCO2) of male and female mice for 6 days. All mice presented diurnal rhythm of higher VO2, VCO2 during the dark cycles compared to VO2, and VCO2 measured during the light cycles. Figure 5C, 5D, 5G, 5H show VO2 and VCO2 measurements collected for 6 days were averaged into a single day. Overall averages of absolute VO2 and VCO2 measurements were significantly lower in GHRH-/- female and male mice compared to WT littermates in both light and dark cycles (Figure 7A–7H). ANCOVA method, which controls for differences in body weight, showed male and female GHRH-/- mice have significantly lower VO2 and VCO2 compared to WT littermates, during both light and dark cycles (Figure 8A–8H).
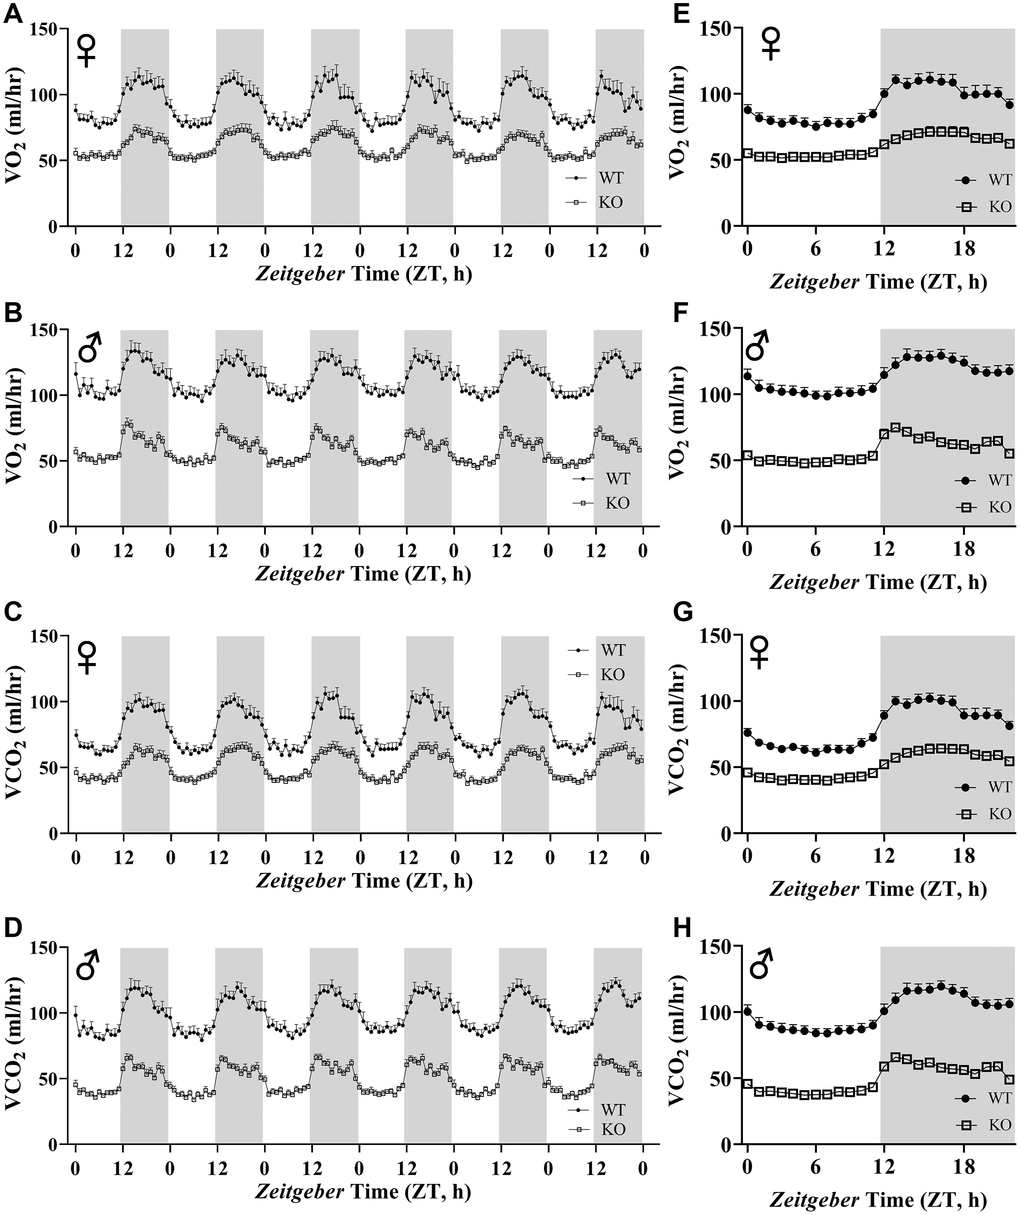
Figure 6. Absolute VO2 and VCO2 recordings in GHRH-/ mice. VO2 and VCO2 were measured by indirect calorimetry. Hourly averages of respiratory parameters measured for 6 days for female (A, E) and male (B, F) WT and GHRH-/- mice. 6 days of VO2 and VCO2 data were averaged into a single day for female (C, G) and male (D, H) WT and GHRH-/- mice. Female WT n=12, GHRH-/- n=12, male WT n=12, GHRH-/- n=11. Each bar represents mean ± SEM.
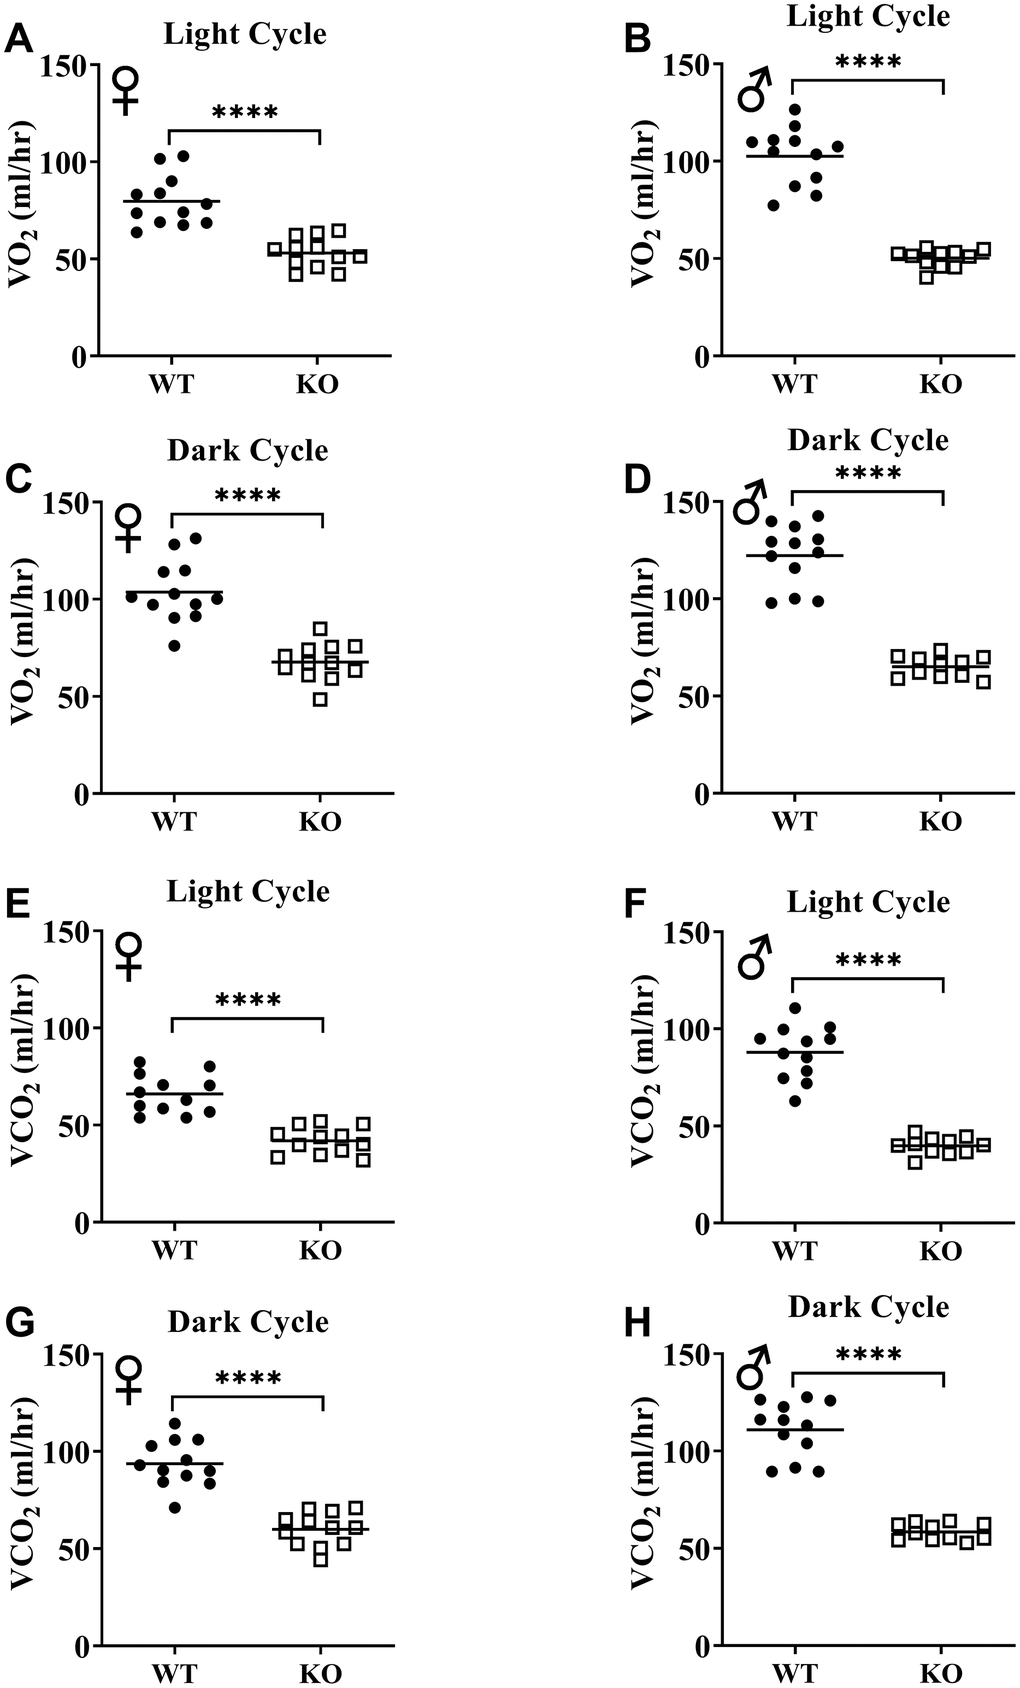
Figure 7. GH-deficiency decreases absolute VO2 and VCO2. VO2 (A–D) and VCO2 (E–H) values measured on light and dark cycles were averaged. WT female n=12, KO female n=12, WT male n=12, KO male n=11. Each bar represents mean. Statistical analysis was performed by unpaired Student’s t-test with Welch’s correction; ****p<0.0001.
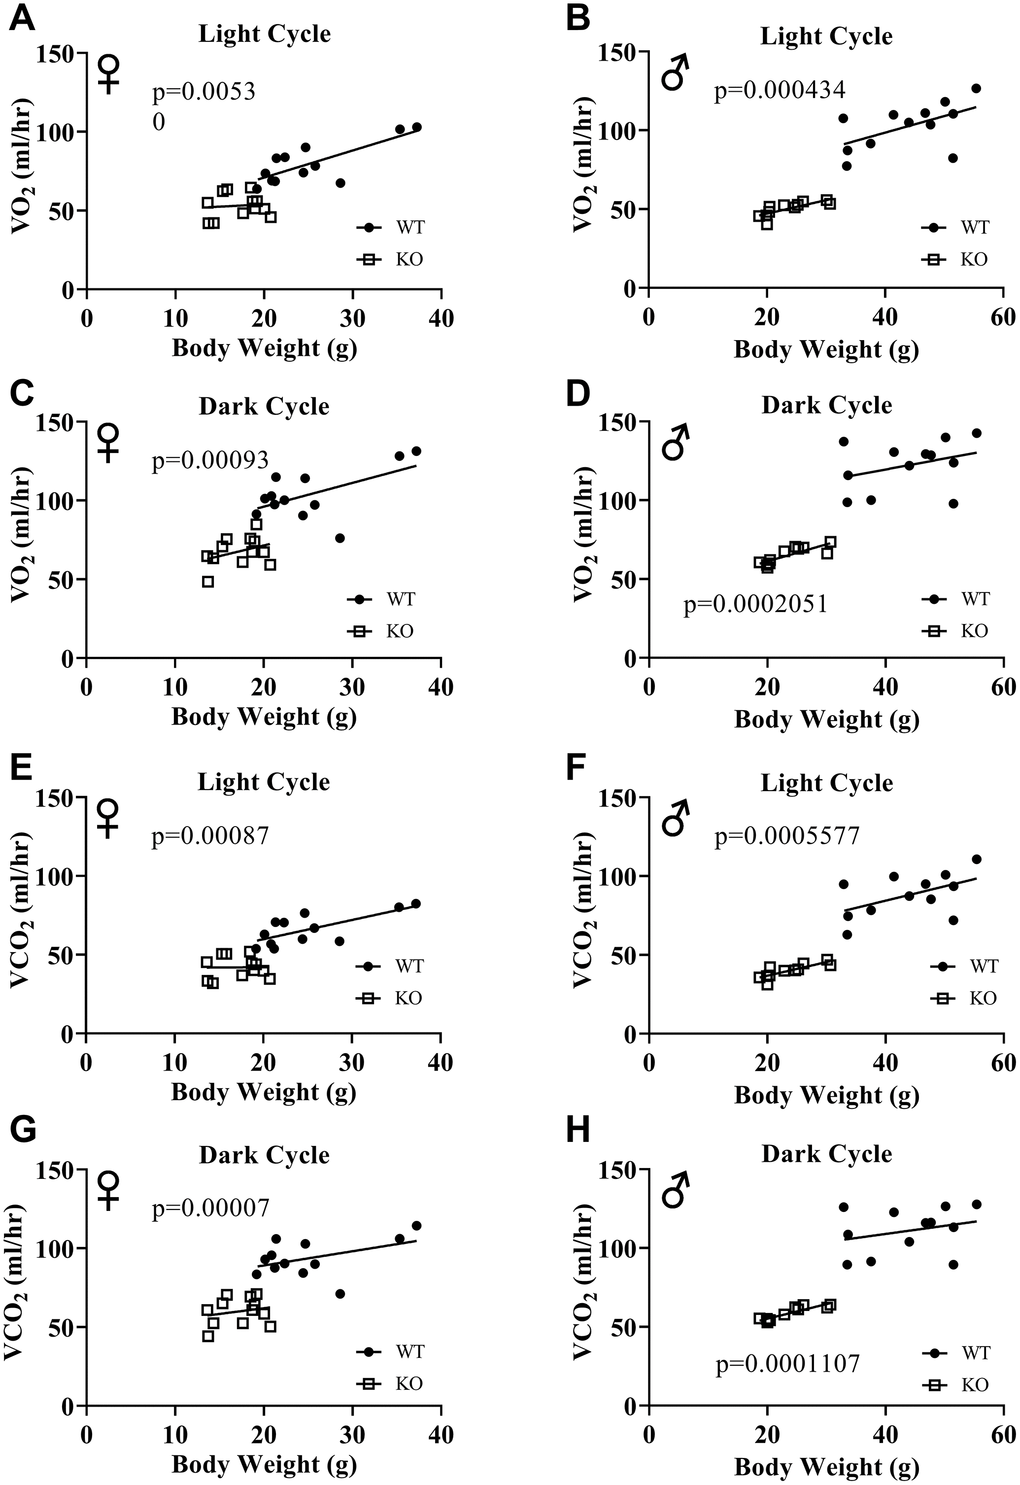
Figure 8. ANCOVA shows that GH-deficiency decreases VO2 and VCO2. Overall averaged VO2 (A–D) and VCO2 (E–H) values are plotted on the y-axis and body weights are plotted on the x-axis. Relationship between body weight and VO2 in female (A, C) and male (B, D) WT and GHRH-/- mice during light cycle (A, B) and dark cycle. (C, D) Relationship between body weight and VCO2 in female (E, G) and male (F, H) WT and GHRH-/- mice in light cycles (E, F) and dark cycles. (G, H) Female WT n=12, GHRH-/- n=12, male WT n=12, GHRH-/- n=11. The WT and GHRH-/- groups were statistically analyzed with ANCOVA method, which was used to calculate p values, shown on each panel.
We calculated energy expenditure from the respiratory parameters collected by indirect calorimetry to assess the effect of GH-deficiency on metabolic rate. Figure 9A, 9B show energy expenditure of female and male GHRH-/- mice compared with WT littermates over 6 days. We averaged this data into a single day (Figure 9C, 9D). The analyses of energy expenditure representing the 6 light and the 6 dark cycles confirmed the dramatic downward shift of metabolic rate in GH-deficient mice (Figure 10A–10D). Controlling for the effect of significant differences in body weight, ANVOCA method, showed significant reduction in metabolic rates of both male and female GHRH-/- mice compared to WT littermates in light and dark cycles (Figure 9E, 9H). We further measured voluntary physical activity of mice during our indirect calorimetry study. Overall pattern indicates both male and female GHRH-/- mice have reduced activity compared to WT littermates during light and dark cycles (Figure 11A–11D).
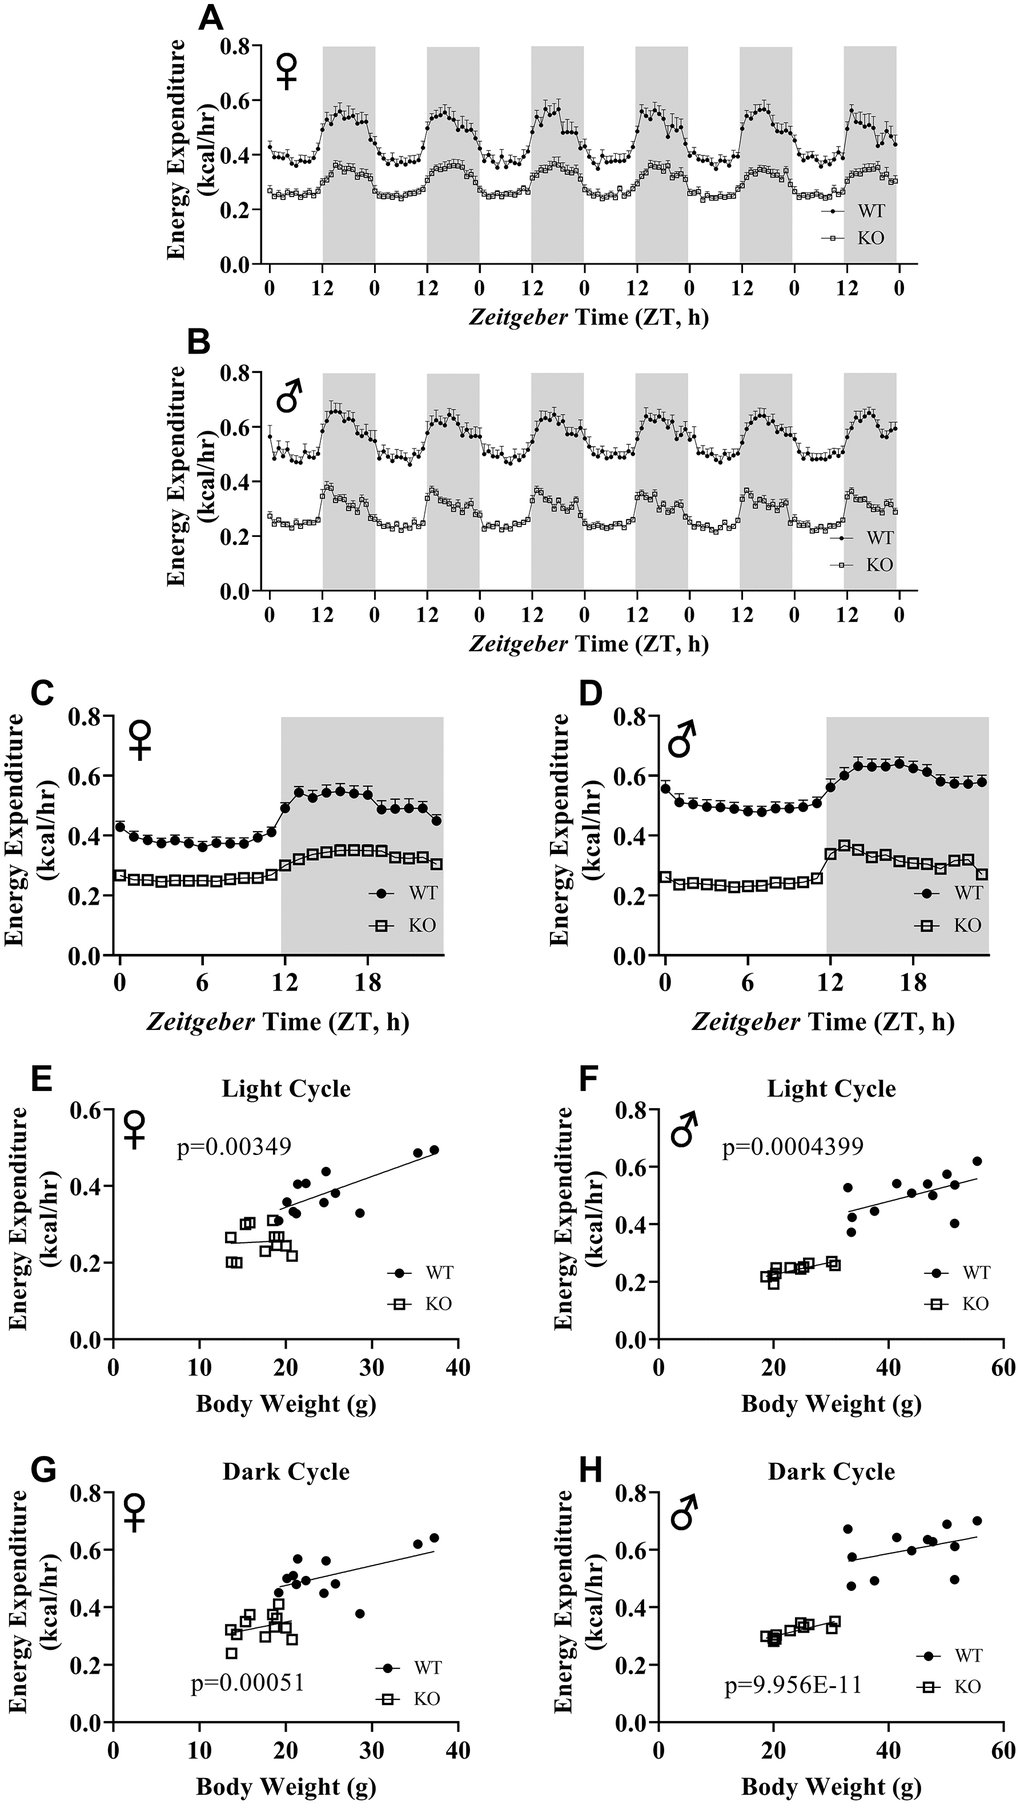
Figure 9. ANCOVA shows that GH-deficiency reduces metabolic rate. Energy expenditure values for 6 days for female (A) and male (B) GHRH-/- and WT mice. 6 days of energy expenditure data were averaged into a single day for female (C) and male (D) mice. Analysis of energy expenditure with body weight as a co-variant for female (E, G) and male (F, H) GHRH-/- and WT mice in light cycles (E, F) and dark cycles. (G, H) Female WT n=12, GHRH-/- n=12, male WT n=12, GHRH-/- n=11. Each bar represents mean ± SEM. The WT and GHRH-/- groups were statistically analyzed with ANCOVA method, which was used to calculate p values, shown on panels E-H.
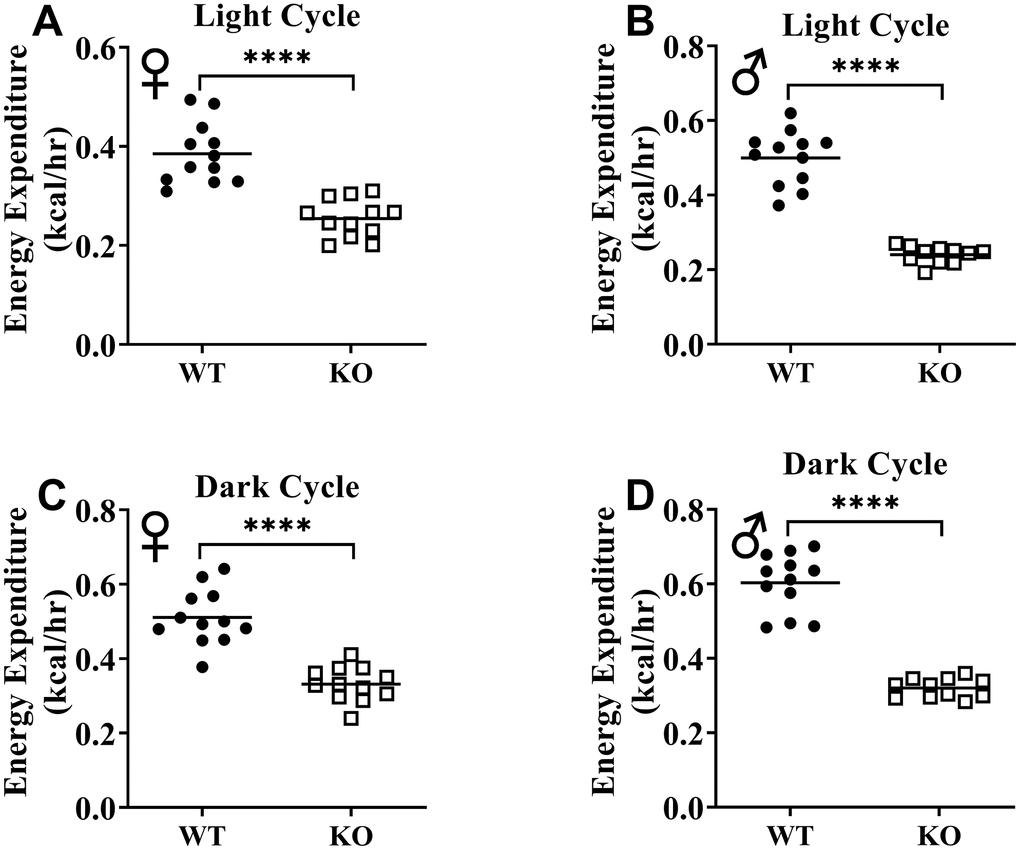
Figure 10. GH-deficiency results in decreased absolute metabolic rate. Overall averaged energy expenditure of WT and GHRH-/- are shown as light (72 hours; A, B) and dark cycles (72 hours; C, D). WT female n=12, KO female n=12, WT male n=12, KO male n=11. Each bar represents mean. Statistical analysis was performed by Student’s t-test with Welch’s correction; ****p<0.0001.
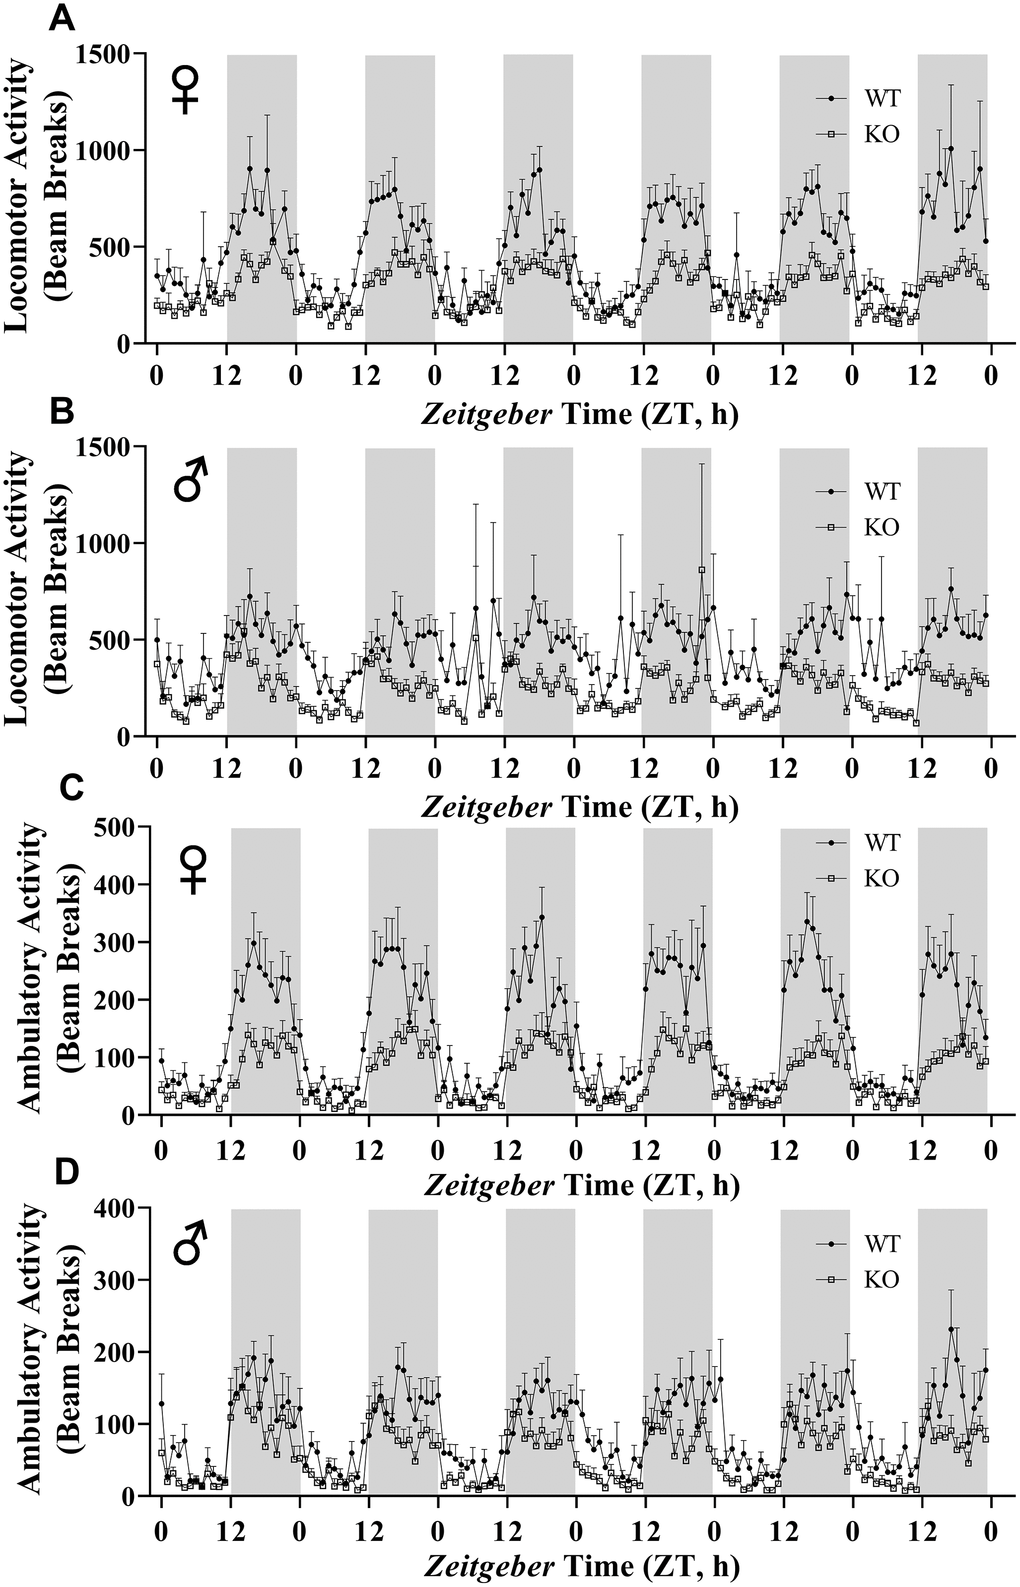
Figure 11. GH-deficiency results in decreased physical activity. Locomotor activity (A, B) and ambulatory activity (C, D) of WT and GHRH-/- mice for 6 days are shown. WT female n=12, KO female n=12, WT male n=12, KO male n=11.
To assess insulin tolerance, we performed intraperitoneal insulin injections and measured blood glucose levels. Upon injection with insulin, glucose concentrations significantly decreased in GHRH-/- female and male mice compared to their littermate controls (Figure 12A, 12B). Area under the curve (AUC) data were significantly lower GHRH-/- female and male mice than their littermate controls (Figure 12C, 12D). To evaluate the glucose homeostasis in vivo, we performed intraperitoneal glucose tolerance test (IPGTT) with mice fasted overnight. We did not observe any significant differences in blood glucose levels throughout the 2-hour period following glucose injection (Figure 12E, 12F). AUC analyses did not reveal any statistical significance due to loss of GHRH (Figure 12G, 12H). This data strongly supports the notion that GH deficiency improves insulin sensitivity, but not glucose homeostasis in vivo.
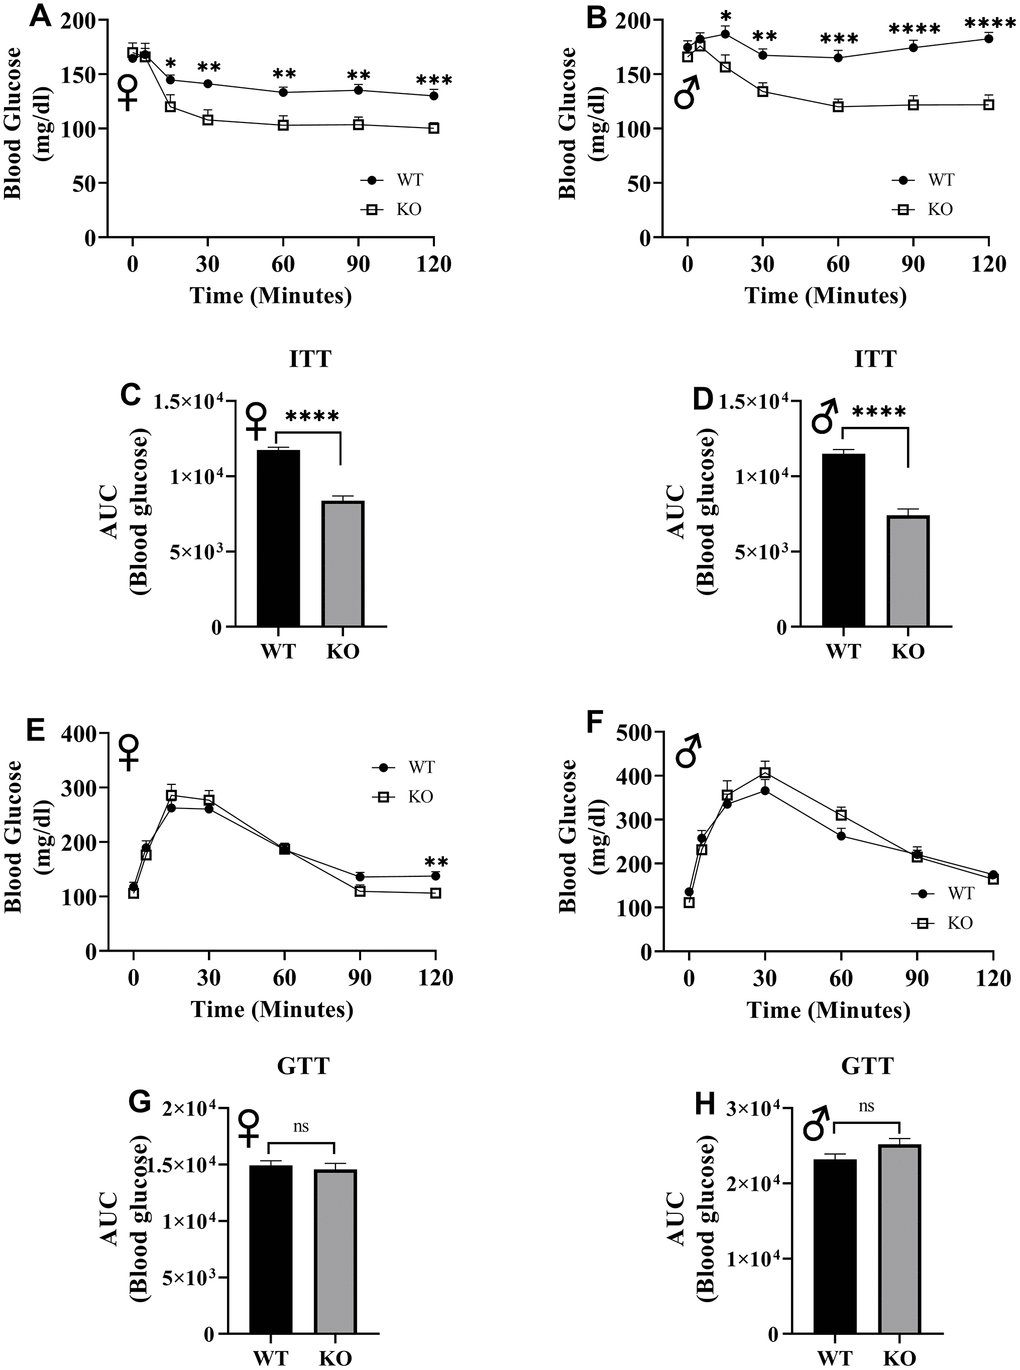
Figure 12. Insulin and glucose tolerance tests. GHRH-/- and WT mice were fasted for 4 hours and injected with 1 IU porcine insulin per kg of body weight. Blood glucose levels of female (A) and male (B) were measured the following 2 hours. Area under the curve analyses for female (C) and male (D) mice are shown. GHRH-/- and WT mice were fasted overnight and injected with 1 g glucose per kg of body weight. Blood glucose levels of female (E) and male (F) were measured the following 2 hours. Area under the curve analyses for female (G) and male (H) mice are shown. Female WT n=14, GHRH-/- n=13, male WT n=14, GHRH-/- n=13-14. Each bar represents mean ± SEM. Statistical analysis was performed by unpaired Student’s t-test with Welch’s correction; *p<0.05, **p<0.01, ***p<0.001, ****p<0.0001.
Discussion
Previously, GHRH was knocked out in mice using a neomycin resistance cassette to replace parts of both exon 2 and 3 [17]. This approach introduces the possibility of passenger flanking alleles/mutations, which may be responsible for phenotypic variations between mice generated with CRISPR/Cas9-based gene-editing and classical knockout method [24, 25]. Agouti gene and GHRH-/- alleles co-segregate in the mouse model generated by Salvatori lab [17]. Previously, GHRH-/- mice were shown to have increased adiposity and insulin sensitivity, which are the two key parameters linked to longevity in different knockout models of the growth hormone pathway. However, insulin resistance and obesity are both linked to agouti gene expression [20]. We generated a ‘clean’ model for GHRH loss of function mutation in mice using the CRISPR/Cas9 system, which provides precise genome-editing without leaving any exogenous DNA sequences behind, eliminating the possibility of passenger alleles/mutations influencing the phenotype resulting from the GH-deficiency [26]. It has been shown in the literature that CRISPR/Cas9 method can result in off-target mutations. We have outcrossed our mice several generations to minimize the possibility of off-target mutations in the genome. Some of the phenotypic variability observed in transgenic animals has been attributed to the genetic background of animal models [27, 28]. To rule out this possibility, we used GHRH-/- mice on mixed genetic background for this study.
Indirect calorimetry provides highly sensitive, accurate, and noninvasive measurements of energy expenditure and substrate utilization in live animals [29]. One important technical issue for indirect calorimetry is the duration of acclimation and data acquisition period. Generally, data collection by indirect calorimetry is limited to 24 hours, which usually takes place after a 24 hours acclimation period [5, 30, 31]. Temperature within the cage is thought to be closer to the thermoneutral zone, where energy expenditure required for maintaining body temperature is at its lowest. Moving mice from group housing to single housing is expected to increase their expenditure [32]. For this reason, it is critical for mice to adjust to cold stress before any respiratory measurements are performed. In order to obtain accurate and reliable results from indirect calorimetry, we acclimated mice in the respiratory chambers for 7 days and subsequently, collected the measurements for 6 days.
Interpretation of metabolic and physiological parameters has been problematic due to differences in body weight in some genetic models [33]. In order to compensate for these differences, researchers have argued for different methods of analysis, including ratio-based normalization and allometric scaling [34]. Studies illustrated that these methods are improper and result in flawed conclusions [33–36]. ANCOVA method has been promoted as the suitable method of analysis for physiological parameters that are influenced by variables such as body weight [35, 37, 38]. We utilized this unbiased statistical approach to control for the influence of body weight on body composition and indirect calorimetry data.
The inverse relationship between lifespan and body size within species has been observed not only in mice but also, in rats, dogs, horses and humans [6, 39–41]. Decreased body size is one of the strongest phenotypic characteristics of growth hormone deficiency models [5, 8]. Our longitudinal study of body weight showed that GHRH-/- mice are significantly lighter than the WT controls. Analyses of body composition parameters with DXA revealed remarkable effects of reduced GH signaling on bone, lean, and fat tissues. Absolute BMD, BMC, lean mass measurements are significantly lower in GHRH-/- female and male mice compared to littermate controls. Reduced absolute lean mass and BMD have been documented in the GHR-/- model [23]. Previously, Ames dwarf mice were shown to have significantly reduced absolute lean mass and BMC [42]. For BMC, BMD, and lean mass, comparison of absolute measurements and ANCOVA method using body weight as a co-variant showed the same results. ANCOVA method demonstrated that fat mass adjusted for body weight is significantly increased in mice lacking GHRH.
We aimed to utilize indirect calorimetry to investigate the metabolic effects, which are associated with reduced GH signaling and may be related to improved longevity. Analyses of absolute energy expenditure and body weight adjusted energy expenditure values lead to the same conclusion that our novel GHRH-/- mice have significantly decreased metabolic rates compared to WT littermates. Previous study using Ames dwarf and GHR-/- found significantly decreased absolute energy expenditures for both models [30]. Using indirect calorimetry, we examined the RER, which is a unitless ratio obtained by dividing VCO2 by VO2. RER is close to 0.7 when mice metabolize fat as an energy source and is close to 1.0 when metabolizing carbohydrates [43]. Our results demonstrate that GH-deficiency is significantly associated with lower RER during the light cycle, but not during the dark cycle in both female and male mice. This suggests that GHRH-/- mice have a greater level of fat utilization, which appears in a circadian pattern. Previous studies have shown lower RER for Ames and GHR-/- mice during both light and dark cycles [30]. However, these animals were only acclimated for 24 hours and data were collected in 24 hours. This technical difference is a likely cause for the different results.
Our study shows that GHRH-/- mice have decreased physical activity compared to their WT littermates. Another study showed increased physical activity in GHRH deficient mice [44]. This study recorded physical activity for only 10 minutes. However, our measurements lasted 6 days. This difference in methodology might be the likely contributor to the difference in results.
In humans, insulin resistance is one of the hallmarks of aging and is associated with chronic conditions such as diabetes, cancer, and cardiovascular disease [45, 46]. One of the physiological characteristics of long-lived GH-related mutant mouse models is elimination of insulin resistance [5, 47, 48]. In this study, our novel CRISPR/Cas9 GHRH-/- female and male mice exhibited insulin sensitivity compared to their WT littermates, affirming the relationship between growth hormone deficiency and increased sensitivity to insulin.
This study validates our previous findings and establishes the GHRH-/- mouse as an important animal model to study mechanisms of extended longevity and slow aging in mammals. Our next goal is to assess impact of high-fat diet, which is expected to shorten lifespan and cause metabolic dysfunction, on GHRH-/- mice. To achieve this goal, we are conducting a longevity study with GHRH-/- and control mice fed high-fat and control diet. Preliminary results from the ongoing longevity study indicate that our GH-deficient model is protected from harmful effects of high-fat diet. Our current work provides a practical model for a CRISPR/Cas9 system, which leads to improved locus specificity and ease of multiplexed targeting in mammalian aging and longevity studies.
Materials and Methods
CRISPR/sgRNA design and synthesis
Owing to the small size of the mouse GHRH exons (17.16 kb with 5 exons), eight CRISPR targets with high scores were identified in the sequences flanking exons 2 and 3, including the intronic sequences, using Benchling (https://www.benchling.com/) with the goal of creating deletion alleles spanning exons 2 and 3. Single guide RNA (sgRNA) molecules were generated using a cloning-free method as described earlier [49]. Cas9 protein was obtained from MacroLabs at UC Berkeley.
Generation of G0 (founder) animals and germline transmission of mutant alleles
All animal procedures were performed in accordance with the recommendations in the guide for the care and use of laboratory animals published by the National Institutes of Health. The protocols used were approved and conducted according to the University of Alabama at Birmingham institutional animal care and use committee. Pronuclear injections into C57BL/6J zygotes were performed with a solution of sgRNAs (50 ng/μl each) and Cas9 protein (50 ng/μl per guide). Injected zygotes were implanted into pseudo-pregnant CD1 recipients. Genomic DNA obtained from tail biopsies of putative founder (G0) animals were assessed for the presence of mutations in the targeted genes. G0 animals were bred to WT C57BL/6J mice for germline transmission of mutant alleles.
Detecting the presence of indels
Genomic DNA from mouse-tail biopsies was obtained by digesting in lysis buffer (50 mM Tris-HCl pH 8.0, 100 mM EDTA pH 8.0, 100 mM NaCl, 1% SDS) with proteinase K (0.3 mg/ml), followed by a phenol: chloroform extraction and ethanol precipitation procedure. PCRs were set up using the oligonucleotide primers MmGhrh-gen-F1: 5’-CTTGCTTCTCTCACACTTGC-3’; MmGhrh-gen-R1: 5’-TTAAAGGGTCGGAGCAGTAG-3’ with NEB Taq 2x Master Mix. The amplicons (795 base pairs) were subjected to denaturation-slow renaturation to facilitate formation of hetero-duplexes using a thermocycler. These samples were then resolved on polyacrylamide gels (6%) and the resulting mobility profiles used to infer efficiency of CRISPR-Cas9 nuclease activity. Indels or deletions were detected by heteroduplex mobility analysis (HMA) from tail genomic DNA of potential founder animals. PCR amplicons were cloned using the TOPO-TA cloning kit (ThermoFisher/Invitrogen, Carlsbad CA). Colonies were picked from each plate and grown in 1.5 ml liquid cultures to isolate plasmid DNA using an alkaline lysis procedure. Plasmid DNA was sequenced using M13 forward or reverse primers.
Breeding
Mice were housed under standard conditions (12-hours light and 12-hours dark cycles at 20–23°C) with ad libitum access to food and water and fed with NIH-31 rodent formula. A GHRH heterozygous (+/-) G0 mouse obtained from the University of Alabama at Birmingham (UAB) genomics core was crossed with a BALB/cByJ for increased genetic diversity, increased fecundity, and reduced aggression. To obtain experimental animals, mice heterozygous for GHRH mutation were crossed with littermates to obtain homozygous GHRH mutant and homozygous GHRH wild type animals, which served as controls. Experiments were performed with age-matched mice. Females were 6 months old and males were 8 months old at the time of the experiments.
DXA
The mice were scanned using the GE Lunar PIXImus DXA with software version 1.45. The mice were anesthetized using an Isoflurane (3%) and oxygen (500ml/min) mixture, delivered by a Surgivet anesthesia machine, and then placed in a prostrate position on the DXA imaging plate and scanned. During the scan, the mice remained anesthetized. For all scans, the head was excluded from the analysis and the data obtained included BMC, BMD, lean mass and fat mass.
Indirect calorimetry
Indirect calorimetry was performed using comprehensive lab animal monitoring system (Oxymax-CLAMS; Columbus Instruments Co., Columbus, OH). This system uses zirconia and infrared sensors to monitor oxygen (O2) and carbon dioxide (CO2), respectively. We performed indirect calorimetry with 24 mice (12 wild type and 12 GHRH-/-). We divided mice into 3 groups and collected measurements on 8 animals at a time (4 WT and 4 GHRH-/-). The mice were housed in separate respiratory chambers for 7 days for acclimatization before recording the measurements. After a 7-day acclimation period, respiratory parameters of mice were recorded for 6 days with ad libitum access to standard chow and water (12-hours light and 12-hours dark cycles at 20–23°C). Respiratory samples were measured every 9 minutes per mouse, and the data were averaged for each hour. RER was calculated by dividing VCO2 by VO2. Energy expenditure was calculated by the equation as energy expenditure = (3.815 + 1.232 × VCO2/VO2) × VO2 [43]. We used infrared beam system in X, Y, and Z coordinates to record physical activity of mice. If the mouse is standing still and starts a repetitive act, such as grooming, it will continuously break the same beam indicating locomotor activity. When the currently broken beam is different from the previous one, activity is counted as ambulatory.
Glucose and insulin tolerance tests
Overnight-fasted mice underwent glucose tolerance test by intraperitoneal injection with 1 g of glucose per kg of body weight. Blood glucose levels were measured at 0, 5, 15, 30, 60, 90, and 120 minutes. 4-hours fasted mice underwent insulin tolerance test by intraperitoneal injection with 1 IU porcine insulin (Sigma-Aldrich, St. Louis, MO) per kg of body weight. Blood glucose levels were measured at 0, 5, 15, 30, 60, 90, and 120 minutes.
Real-time quantitative PCR
RNA was harvested from tissues using RNeasy plus kit (Qiagen, Hilden, Germany). Total RNA was reverse transcribed with LunaScript RT SuperMix Kit (New England Biolabs, Ipswich, MA). Real-time quantitative PCR was performed using a QuantStudio 3 with a PowerUp SYBR green master mix (ThermoFisher Scientific, Waltham, MA). Glyceraldehyde-3-phosphate dehydrogenase (GAPDH) or beta-actin expression was used to normalize gene of interest in each sample. Real-time quantitative PCRs were set up using the oligonucleotide primers Mm GAPDH F1 5-CCTGGAGAAACCTGCCAAGTATGATG-3’; Mm GAPDH R1 5-AAGAGTGGGAGTTGCTGTTGAAGTC-3’, Mm Actb F4 5’-TCTTTGCAGCTCCTTCGTTGCC-3; Mm Actb R4 5’-CTGACCCATTCCCACCATCACAC-3’, Mm IGF-1 F2 5’-CATAGTACCCACTCTGACCTGCTGTG-3’; Mm IGF-1 R2 5’-CGCCAGGTAGAAGAGGTGTGAAGAC-3’; Mm GH F1 5’- TGGCTACAGACTCTCGG-3’; Mm GH R1 5’-AGAGCAGGCAGAGCAGGCTGA-3’. Fold change was obtained by calculating 2-ΔΔCt.
Statistical analyses
The unpaired Student’s t-test with Welch’s correction was used for statistical analysis. Statistical significance was established at p<0.05, two-tailed. We used (generalized linear model) GLM package with R software for analysis of indirect calorimetry and body composition data. When interaction was not found, the code was run without the interaction term. Our GLM models were validated with the MMPC’s (National Mouse Metabolic Phenotyping Center, https://www.mmpc.org/shared/regression.aspx) energy expenditure analysis tool. Graphs were generated with GraphPad Prism 8 (San Diego, CA).
Acknowledgments
We thank Sofia Canlas, Joseph Jablonsky, Whitney Turner, and Matthew Joyner for technical assistance. We also thank other members of the Sun lab for their helpful discussion and comments on the revision of the manuscript.
Conflicts of Interest
All of the contributing authors declared no conflicts of interest.
Funding
This work was supported in part by National Institute on Aging grants AG048264, AG057734 and AG050225 (L.S.).
References
- 1. López-Otín C, Blasco MA, Partridge L, Serrano M, Kroemer G. The hallmarks of aging. Cell. 2013; 153:1194–217. https://doi.org/10.1016/j.cell.2013.05.039 [PubMed]
- 2. Kenyon C, Chang J, Gensch E, Rudner A, Tabtiang R. A C. Elegans mutant that lives twice as long as wild type. Nature. 1993; 366:461–64. https://doi.org/10.1038/366461a0 [PubMed]
- 3. Flatt T, Min KJ, D’Alterio C, Villa-Cuesta E, Cumbers J, Lehmann R, Jones DL, Tatar M. Drosophila germ-line modulation of insulin signaling and lifespan. Proc Natl Acad Sci USA. 2008; 105:6368–73. https://doi.org/10.1073/pnas.0709128105 [PubMed]
- 4. Coschigano KT, Holland AN, Riders ME, List EO, Flyvbjerg A, Kopchick JJ. Deletion, but not antagonism, of the mouse growth hormone receptor results in severely decreased body weights, insulin, and insulin-like growth factor I levels and increased life span. Endocrinology. 2003; 144:3799–810. https://doi.org/10.1210/en.2003-0374 [PubMed]
- 5. Sun LY, Spong A, Swindell WR, Fang Y, Hill C, Huber JA, Boehm JD, Westbrook R, Salvatori R, Bartke A. Growth hormone-releasing hormone disruption extends lifespan and regulates response to caloric restriction in mice. Elife. 2013; 2:e01098. https://doi.org/10.7554/eLife.01098 [PubMed]
- 6. Flurkey K, Papaconstantinou J, Miller RA, Harrison DE. Lifespan extension and delayed immune and collagen aging in mutant mice with defects in growth hormone production. Proc Natl Acad Sci USA. 2001; 98:6736–41. https://doi.org/10.1073/pnas.111158898 [PubMed]
- 7. Brown-Borg HM, Borg KE, Meliska CJ, Bartke A. Dwarf mice and the ageing process. Nature. 1996; 384:33. https://doi.org/10.1038/384033a0 [PubMed]
- 8. Coschigano KT, Clemmons D, Bellush LL, Kopchick JJ. Assessment of growth parameters and life span of GHR/BP gene-disrupted mice. Endocrinology. 2000; 141:2608–13. https://doi.org/10.1210/endo.141.7.7586 [PubMed]
- 9. Bartke A, Sun LY, Longo V. Somatotropic signaling: trade-offs between growth, reproductive development, and longevity. Physiol Rev. 2013; 93:571–98. https://doi.org/10.1152/physrev.00006.2012 [PubMed]
- 10. van der Spoel E, Jansen SW, Akintola AA, Ballieux BE, Cobbaert CM, Slagboom PE, Blauw GJ, Westendorp RG, Pijl H, Roelfsema F, van Heemst D. Growth hormone secretion is diminished and tightly controlled in humans enriched for familial longevity. Aging Cell. 2016; 15:1126–31. https://doi.org/10.1111/acel.12519 [PubMed]
- 11. Sornson MW, Wu W, Dasen JS, Flynn SE, Norman DJ, O’Connell SM, Gukovsky I, Carrière C, Ryan AK, Miller AP, Zuo L, Gleiberman AS, Andersen B, et al. Pituitary lineage determination by the prophet of pit-1 homeodomain factor defective in ames dwarfism. Nature. 1996; 384:327–33. https://doi.org/10.1038/384327a0 [PubMed]
- 12. Li S, Crenshaw EB
3rd , Rawson EJ, Simmons DM, Swanson LW, Rosenfeld MG. Dwarf locus mutants lacking three pituitary cell types result from mutations in the POU-domain gene pit-1. Nature. 1990; 347:528–33. https://doi.org/10.1038/347528a0 [PubMed] - 13. Ikeno Y, Bronson RT, Hubbard GB, Lee S, Bartke A. Delayed occurrence of fatal neoplastic diseases in ames dwarf mice: correlation to extended longevity. J Gerontol A Biol Sci Med Sci. 2003; 58:291–96. https://doi.org/10.1093/gerona/58.4.b291 [PubMed]
- 14. Chandrashekar V, Bartke A, Coschigano KT, Kopchick JJ. Pituitary and testicular function in growth hormone receptor gene knockout mice. Endocrinology. 1999; 140:1082–88. https://doi.org/10.1210/endo.140.3.6557 [PubMed]
- 15. Hauck SJ, Hunter WS, Danilovich N, Kopchick JJ, Bartke A. Reduced levels of thyroid hormones, insulin, and glucose, and lower body core temperature in the growth hormone receptor/binding protein knockout mouse. Exp Biol Med (Maywood). 2001; 226:552–58. https://doi.org/10.1177/153537020122600607 [PubMed]
- 16. Zhou Y, Xu BC, Maheshwari HG, He L, Reed M, Lozykowski M, Okada S, Cataldo L, Coschigamo K, Wagner TE, Baumann G, Kopchick JJ. A mammalian model for laron syndrome produced by targeted disruption of the mouse growth hormone receptor/binding protein gene (The laron mouse). Proc Natl Acad Sci USA. 1997; 94:13215–20. https://doi.org/10.1073/pnas.94.24.13215 [PubMed]
- 17. Alba M, Salvatori R. A mouse with targeted ablation of the growth hormone-releasing hormone gene: A new model of isolated growth hormone deficiency. Endocrinology. 2004; 145:4134–43. https://doi.org/10.1210/en.2004-0119 [PubMed]
- 18. Müller EE, Locatelli V, Cocchi D. Neuroendocrine control of growth hormone secretion. Physiol Rev. 1999; 79:511–607. https://doi.org/10.1152/physrev.1999.79.2.511 [PubMed]
- 19. Smith SR, Gawronska-Kozak B, Janderová L, Nguyen T, Murrell A, Stephens JM, Mynatt RL. Agouti expression in human adipose tissue: functional consequences and increased expression in type 2 diabetes. Diabetes. 2003; 52:2914–22. https://doi.org/10.2337/diabetes.52.12.2914 [PubMed]
- 20. Klebig ML, Wilkinson JE, Geisler JG, Woychik RP. Ectopic expression of the agouti gene in transgenic mice causes obesity, features of type II diabetes, and yellow fur. Proc Natl Acad Sci USA. 1995; 92:4728–32. https://doi.org/10.1073/pnas.92.11.4728 [PubMed]
- 21. List EO, Sackmann-Sala L, Berryman DE, Funk K, Kelder B, Gosney ES, Okada S, Ding J, Cruz-Topete D, Kopchick JJ. Endocrine parameters and phenotypes of the growth hormone receptor gene disrupted (GHR-/-) mouse. Endocr Rev. 2011; 32:356–86. https://doi.org/10.1210/er.2010-0009 [PubMed]
- 22. Bonkowski MS, Pamenter RW, Rocha JS, Masternak MM, Panici JA, Bartke A. Long-lived growth hormone receptor knockout mice show a delay in age-related changes of body composition and bone characteristics. J Gerontol A Biol Sci Med Sci. 2006; 61:562–67. https://doi.org/10.1093/gerona/61.6.562 [PubMed]
- 23. Berryman DE, List EO, Palmer AJ, Chung MY, Wright-Piekarski J, Lubbers E, O’Connor P, Okada S, Kopchick JJ. Two-year body composition analyses of long-lived GHR null mice. J Gerontol A Biol Sci Med Sci. 2010; 65:31–40. https://doi.org/10.1093/gerona/glp175 [PubMed]
- 24. Lee JH, Park JH, Nam TW, Seo SM, Kim JY, Lee HK, Han JH, Park SY, Choi YK, Lee HW. Differences between immunodeficient mice generated by classical gene targeting and CRISPR/Cas9-mediated gene knockout. Transgenic Res. 2018; 27:241–51. https://doi.org/10.1007/s11248-018-0069-y [PubMed]
- 25. Szabo R, Samson AL, Lawrence DA, Medcalf RL, Bugge TH. Passenger mutations and aberrant gene expression in congenic tissue plasminogen activator-deficient mouse strains. J Thromb Haemost. 2016; 14:1618–28. https://doi.org/10.1111/jth.13338 [PubMed]
- 26. Doudna JA, Charpentier E. Genome editing. The new frontier of genome engineering with CRISPR-Cas9. Science. 2014; 346:1258096. https://doi.org/10.1126/science.1258096 [PubMed]
- 27. Noyes HA, Agaba M, Anderson S, Archibald AL, Brass A, Gibson J, Hall L, Hulme H, Oh SJ, Kemp S. Genotype and expression analysis of two inbred mouse strains and two derived congenic strains suggest that most gene expression is trans regulated and sensitive to genetic background. BMC Genomics. 2010; 11:361. https://doi.org/10.1186/1471-2164-11-361 [PubMed]
- 28. Doetschman T. Influence of genetic background on genetically engineered mouse phenotypes. Methods Mol Biol. 2009; 530:423–33. https://doi.org/10.1007/978-1-59745-471-1_23 [PubMed]
- 29. Speakman JR. Measuring energy metabolism in the mouse - theoretical, practical, and analytical considerations. Front Physiol. 2013; 4:34. https://doi.org/10.3389/fphys.2013.00034 [PubMed]
- 30. Westbrook R, Bonkowski MS, Strader AD, Bartke A. Alterations in oxygen consumption, respiratory quotient, and heat production in long-lived GHRKO and ames dwarf mice, and short-lived bGH transgenic mice. J Gerontol A Biol Sci Med Sci. 2009; 64:443–51. https://doi.org/10.1093/gerona/gln075 [PubMed]
- 31. Holzenberger M, Dupont J, Ducos B, Leneuve P, Géloën A, Even PC, Cervera P, Le Bouc Y. IGF-1 receptor regulates lifespan and resistance to oxidative stress in mice. Nature. 2003; 421:182–87. https://doi.org/10.1038/nature01298 [PubMed]
- 32. Even PC, Nadkarni NA. Indirect calorimetry in laboratory mice and rats: principles, practical considerations, interpretation and perspectives. Am J Physiol Regul Integr Comp Physiol. 2012; 303:R459–76. https://doi.org/10.1152/ajpregu.00137.2012 [PubMed]
- 33. Arch JR, Hislop D, Wang SJ, Speakman JR. Some mathematical and technical issues in the measurement and interpretation of open-circuit indirect calorimetry in small animals. Int J Obes (Lond). 2006; 30:1322–31. https://doi.org/10.1038/sj.ijo.0803280 [PubMed]
- 34. Butler AA, Kozak LP. A recurring problem with the analysis of energy expenditure in genetic models expressing lean and obese phenotypes. Diabetes. 2010; 59:323–29. https://doi.org/10.2337/db09-1471 [PubMed]
- 35. Kaiyala KJ, Schwartz MW. Toward a more complete (And less controversial) understanding of energy expenditure and its role in obesity pathogenesis. Diabetes. 2011; 60:17–23. https://doi.org/10.2337/db10-0909 [PubMed]
- 36. Kaiyala KJ, Morton GJ, Leroux BG, Ogimoto K, Wisse B, Schwartz MW. Identification of body fat mass as a major determinant of metabolic rate in mice. Diabetes. 2010; 59:1657–66. https://doi.org/10.2337/db09-1582 [PubMed]
- 37. Tschöp MH, Speakman JR, Arch JR, Auwerx J, Brüning JC, Chan L, Eckel RH, Farese RV
Jr , Galgani JE, Hambly C, Herman MA, Horvath TL, Kahn BB, et al. A guide to analysis of mouse energy metabolism. Nat Methods. 2011; 9:57–63. https://doi.org/10.1038/nmeth.1806 [PubMed] - 38. Mina AI, LeClair RA, LeClair KB, Cohen DE, Lantier L, Banks AS. CalR: a web-based analysis tool for indirect calorimetry experiments. Cell Metab. 2018; 28:656–666.e1. https://doi.org/10.1016/j.cmet.2018.06.019 [PubMed]
- 39. Miller RA, Harper JM, Galecki A, Burke DT. Big mice die young: early life body weight predicts longevity in genetically heterogeneous mice. Aging Cell. 2002; 1:22–29. https://doi.org/10.1046/j.1474-9728.2002.00006.x [PubMed]
- 40. Greer KA, Canterberry SC, Murphy KE. Statistical analysis regarding the effects of height and weight on life span of the domestic dog. Res Vet Sci. 2007; 82:208–14. https://doi.org/10.1016/j.rvsc.2006.06.005 [PubMed]
- 41. He Q, Morris BJ, Grove JS, Petrovitch H, Ross W, Masaki KH, Rodriguez B, Chen R, Donlon TA, Willcox DC, Willcox BJ. Shorter men live longer: association of height with longevity and FOXO3 genotype in american men of Japanese ancestry. PLoS One. 2014; 9:e94385. https://doi.org/10.1371/journal.pone.0094385 [PubMed]
- 42. Heiman ML, Tinsley FC, Mattison JA, Hauck S, Bartke A. Body composition of prolactin-, growth hormone, and thyrotropin-deficient ames dwarf mice. Endocrine. 2003; 20:149–54. https://doi.org/10.1385/ENDO:20:1-2:149 [PubMed]
- 43. Lusk G. The elements of the science of nutrition. WB Saunders Company. 1917.
- 44. Leone S, Shohreh R, Manippa F, Recinella L, Ferrante C, Orlando G, Salvatori R, Vacca M, Brunetti L. Behavioural phenotyping of male growth hormone-releasing hormone (GHRH) knockout mice. Growth Horm IGF Res. 2014; 24:192–97. https://doi.org/10.1016/j.ghir.2014.06.004 [PubMed]
- 45. Facchini FS, Hua N, Abbasi F, Reaven GM. Insulin resistance as a predictor of age-related diseases. J Clin Endocrinol Metab. 2001; 86:3574–78. https://doi.org/10.1210/jcem.86.8.7763 [PubMed]
- 46. Paolisso G, Gambardella A, Ammendola S, D’Amore A, Balbi V, Varricchio M, D’Onofrio F. Glucose tolerance and insulin action in healthy centenarians. Am J Physiol. 1996; 270:E890–4. https://doi.org/10.1152/ajpendo.1996.270.5.E890 [PubMed]
- 47. Dominici FP, Hauck S, Argentino DP, Bartke A, Turyn D. Increased insulin sensitivity and upregulation of insulin receptor, insulin receptor substrate (IRS)-1 and IRS-2 in liver of ames dwarf mice. J Endocrinol. 2002; 173:81–94. https://doi.org/10.1677/joe.0.1730081 [PubMed]
- 48. Dominici FP, Arostegui Diaz G, Bartke A, Kopchick JJ, Turyn D. Compensatory alterations of insulin signal transduction in liver of growth hormone receptor knockout mice. J Endocrinol. 2000; 166:579–90. https://doi.org/10.1677/joe.0.1660579 [PubMed]
- 49. Turner AN, Andersen RS, Bookout IE, Brashear LN, Davis JC, Gahan DM, Davis JC, Gotham JP, Hijaz BA, Kaushik AS, Mcgill JB, Miller VL, Moseley ZP, et al. Analysis of novel domain-specific mutations in the zebrafish ndr2/ cyclops gene generated using CRISPR-Cas9 RNPs. J Genet. 2018; 97:1315–25. [PubMed]