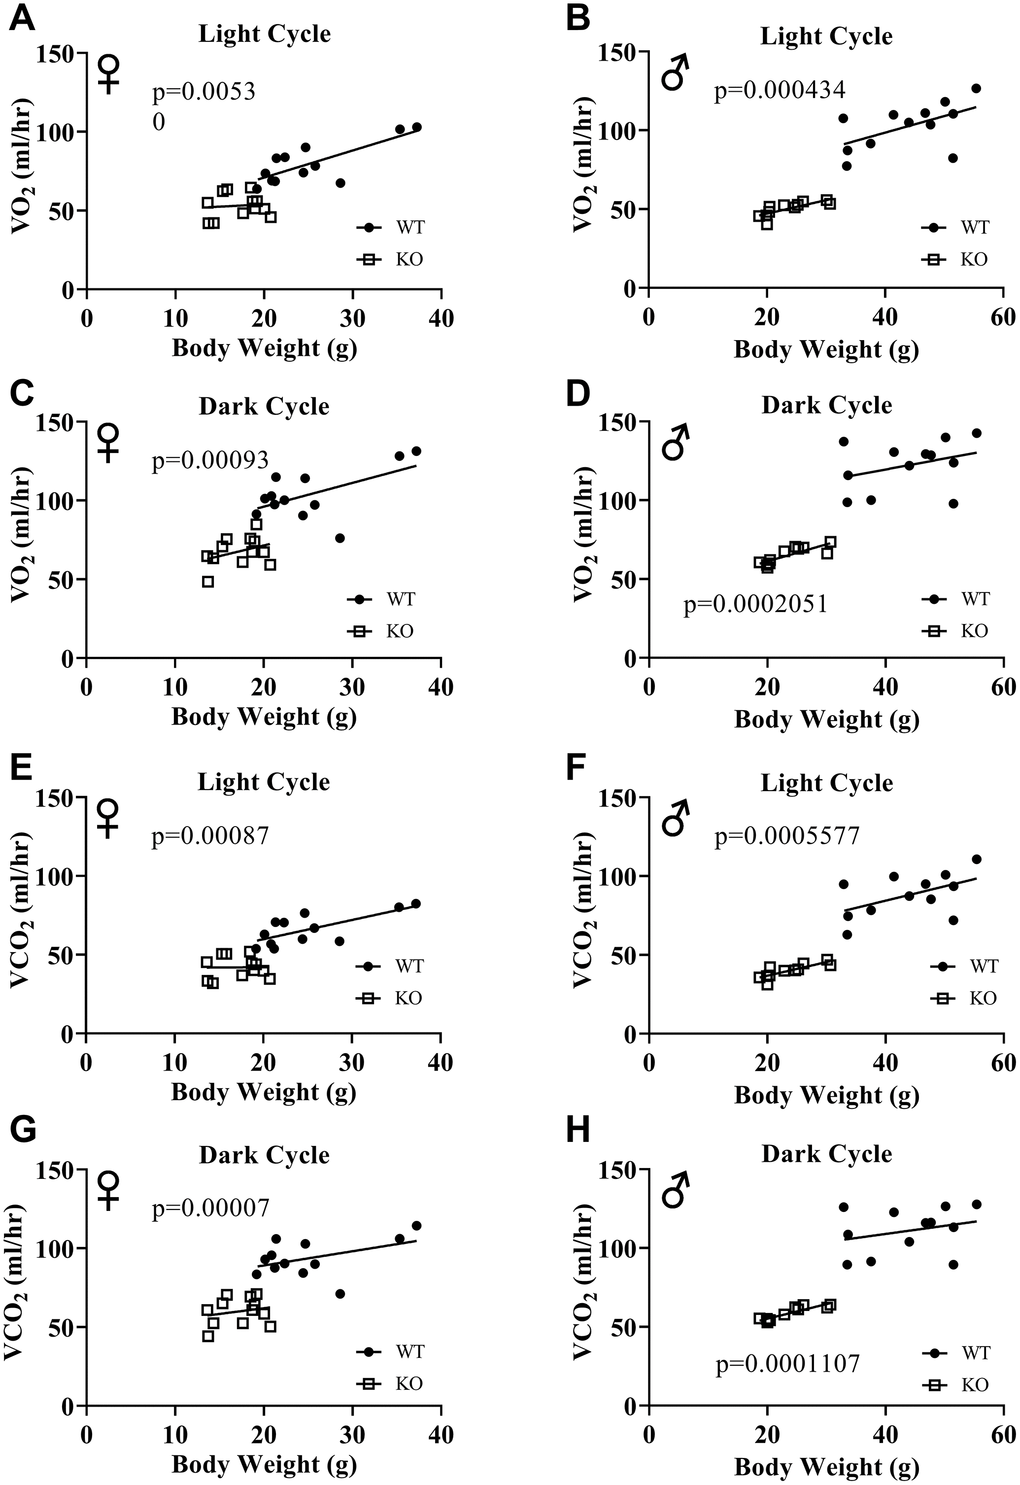
Figure 8.ANCOVA shows that GH-deficiency decreases VO2 and VCO2. Overall averaged VO2 (A–D) and VCO2 (E–H) values are plotted on the y-axis and body weights are plotted on the x-axis. Relationship between body weight and VO2 in female (A, C) and male (B, D) WT and GHRH-/- mice during light cycle (A, B) and dark cycle. (C, D) Relationship between body weight and VCO2 in female (E, G) and male (F, H) WT and GHRH-/- mice in light cycles (E, F) and dark cycles. (G, H) Female WT n=12, GHRH-/- n=12, male WT n=12, GHRH-/- n=11. The WT and GHRH-/- groups were statistically analyzed with ANCOVA method, which was used to calculate p values, shown on each panel.