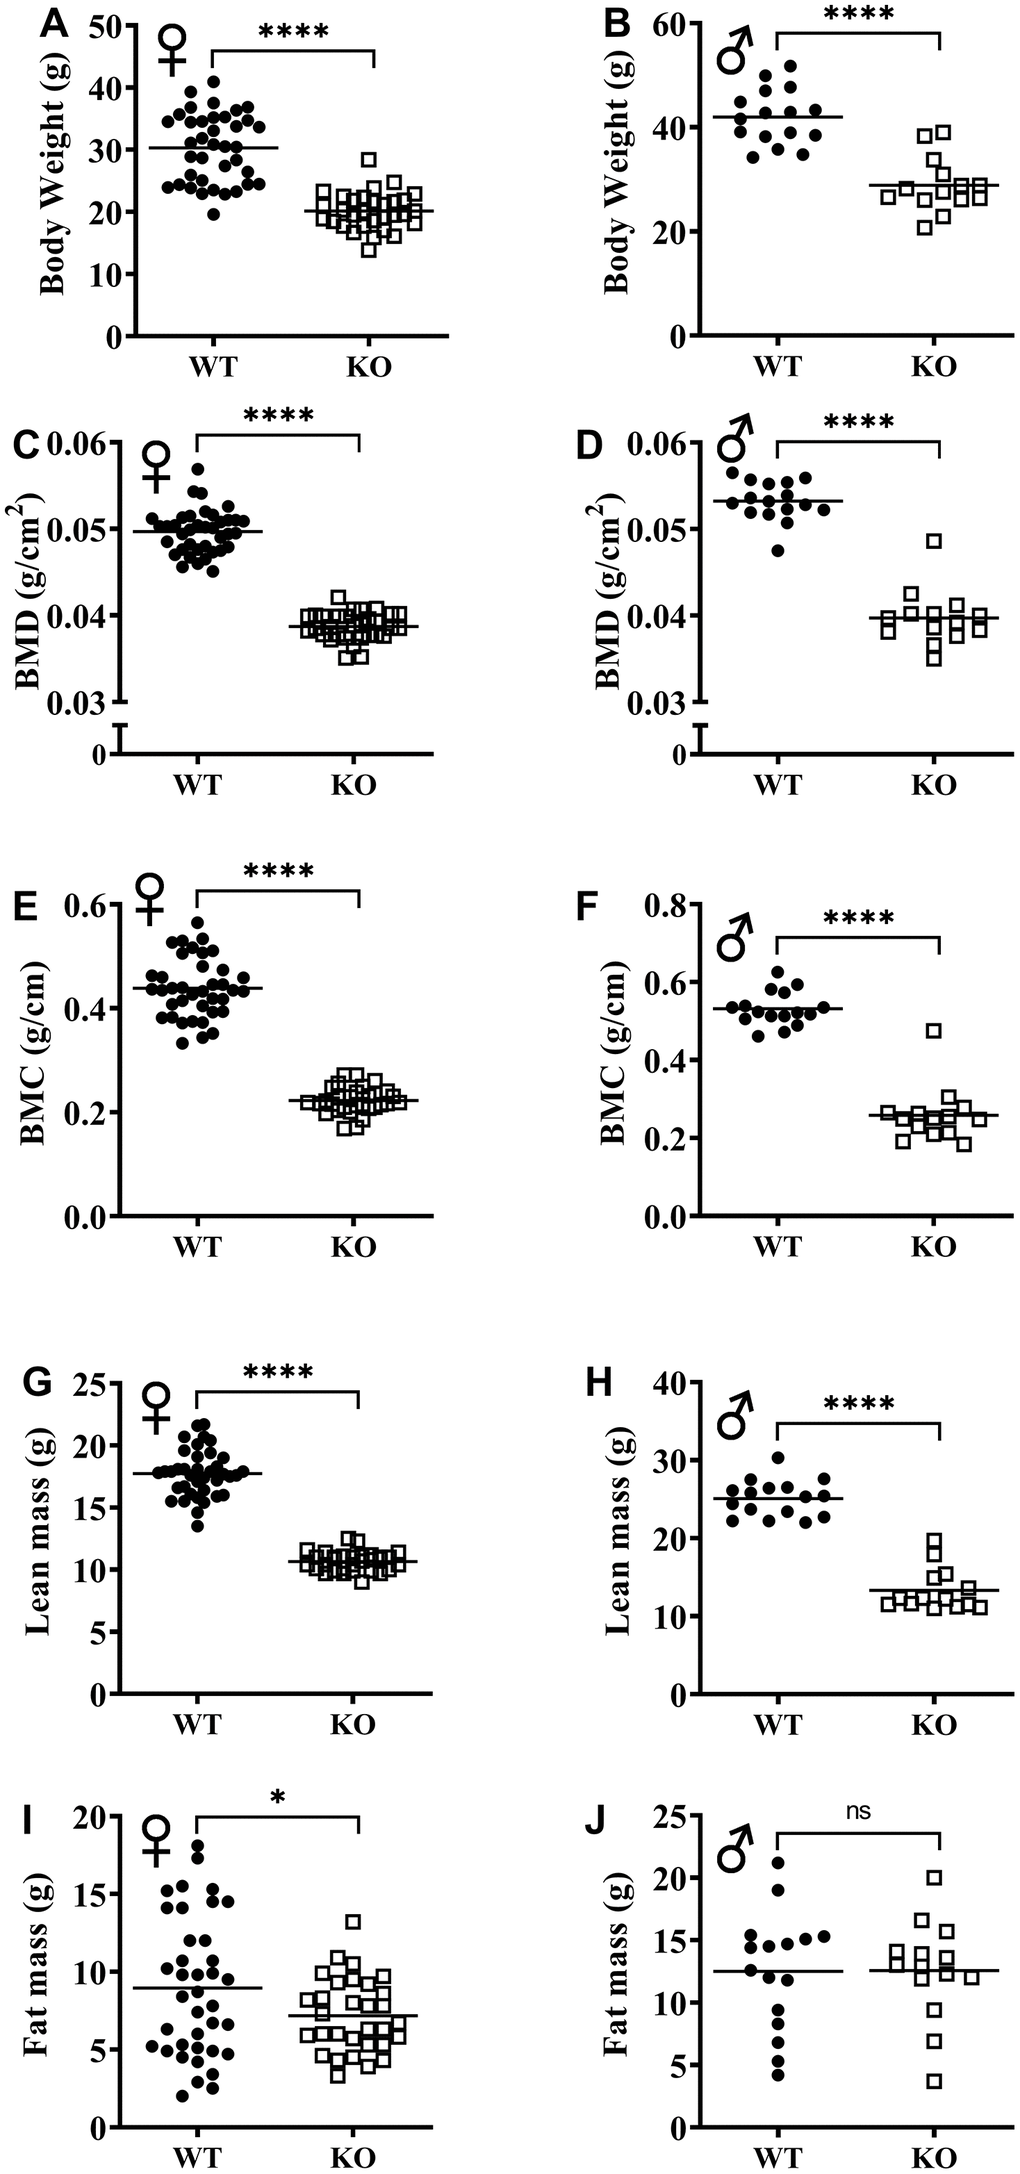
Figure 3.GH-deficiency alters absolute body composition parameters. Body composition parameters: BMD (C, D), BMC (E, F), lean mass (G, H) and fat mass (I, J) were measured by DXA. Female WT n=38, GHRH-/- n=31, male WT n=16, GHRH-/- n=14. Each bar represents mean. Statistical analysis was performed by unpaired Student’s t-test with Welch’s correction; ns= not significant, *p<0.05, ****p<0.0001.