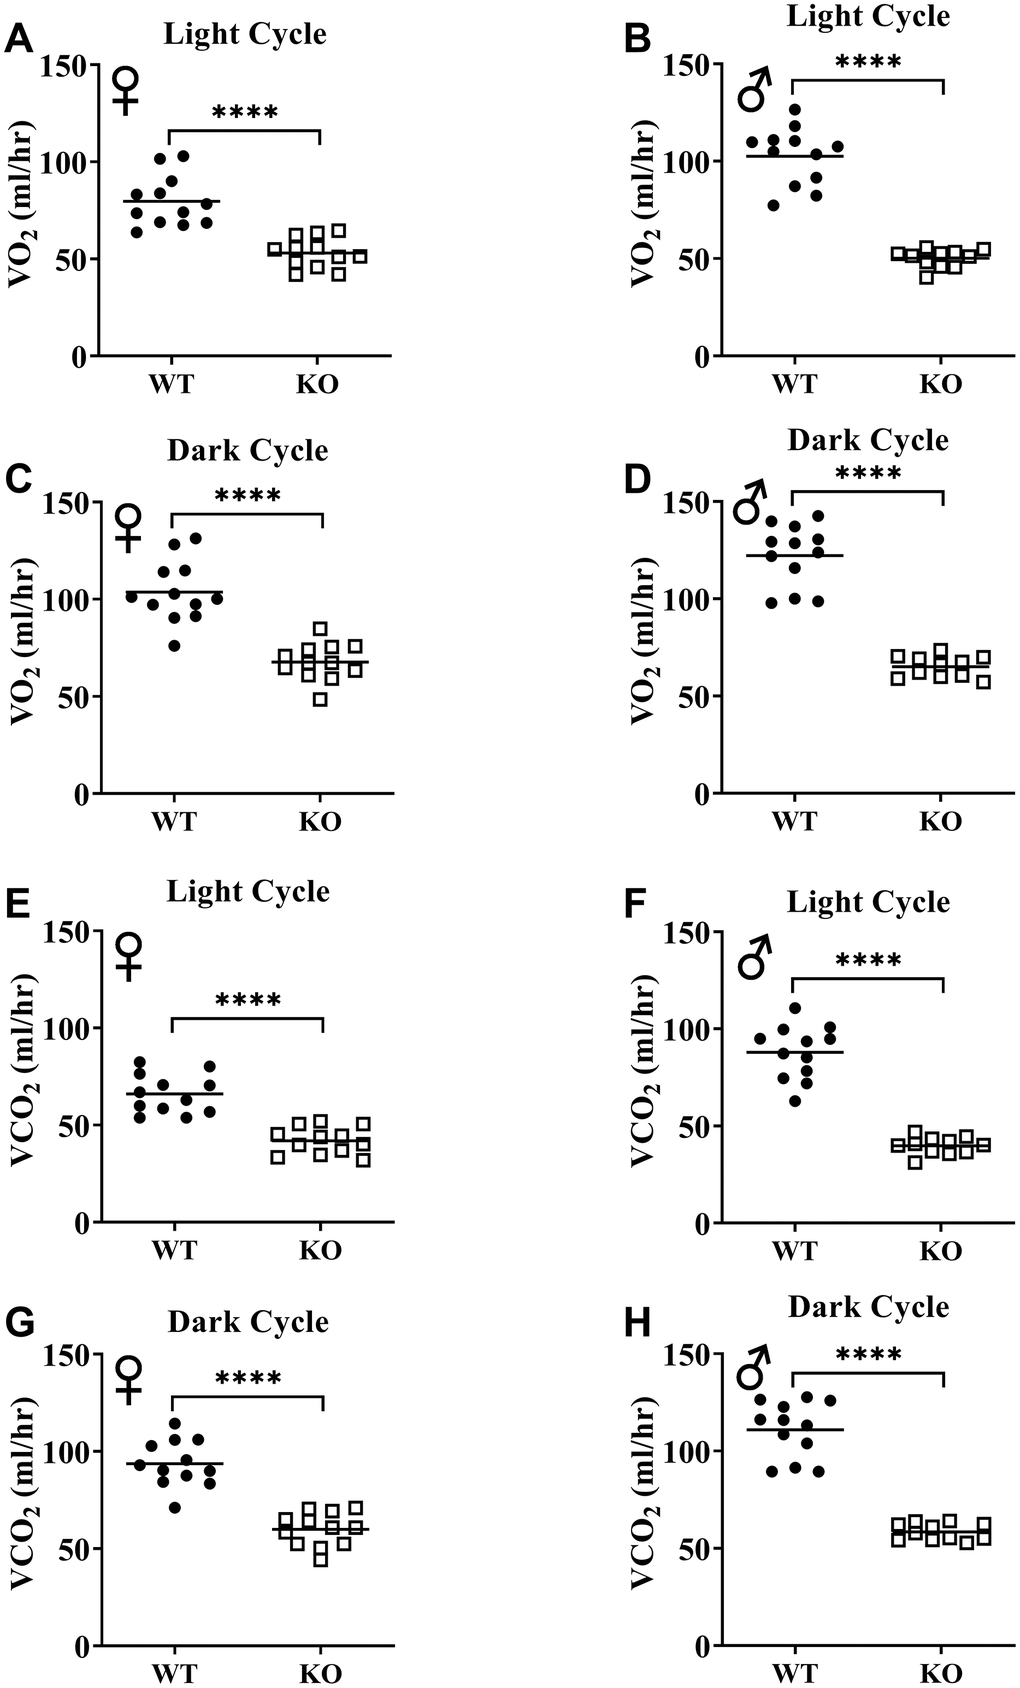
Figure 7.GH-deficiency decreases absolute VO2 and VCO2. VO2 (A–D) and VCO2 (E–H) values measured on light and dark cycles were averaged. WT female n=12, KO female n=12, WT male n=12, KO male n=11. Each bar represents mean. Statistical analysis was performed by unpaired Student’s t-test with Welch’s correction; ****p<0.0001.