


Introduction
Malignant tumor is considered as one of the leading causes of death worldwide, and it is estimated that more than 20 million new cases will be diagnosed each year by 2025 [1]. Despite the tremendous efforts made in the treatment of cancer, this disease still poses a serious threat to human health. Most of the malignancies result from 2 to 8 sequential changes, and single-base substitution is involved in 95% of these mutations [2–3]. Reactive oxygen species (ROS) have been indicated to cause DNA damage and induce genetic lesions, which play a crucial role in initiating mutagenic activity and carcinogenesis [4]. Superoxide dismutase 2 (SOD2) is one of the key endogenous antioxidants, shown to participate in the process of defense against mitochondrial ROS, a major source of cellular ROS [5]. Previous studies have indicated that genetic variation in ROS-related genes, encoding these enzymes, may reduce or impair the regulation of enzyme activity and alter the detoxification of ROS [6].
The SOD2 gene, located at sub band 6q25 of chromosome 6, is a homotetramer containing 2 identical subunits. This single-copy gene can encode superoxide dismutase-2, whose expression is significantly regulated at the transcription, translation, and posttranslational levels in the process of carcinogenesis [7–9]. Previously, it has been shown that the substitution of T-to-C in SOD2 gene can lead to the change of amino acids from valine (Val) to alanine (Ala) [10]. In addition, accumulating studies have indicated a correlation between the SOD2 V16A variant and risk of cancer. Recently, this variant has been demonstrated to be involved in a number of malignant tumors, such as breast cancer [11–12], colorectal cancer [13], prostate cancer [14], cervical cancer [15] and esophageal cancer [16]. The populations involved in the study of this genetic variant span over several ethnicities, such as Japanese [17], Americans [18], Brazilians [19], Egyptian [20], Turkish [21], and Italian [22].
Previous studies have investigated the correlation between SOD2 V16A variant and the risk of cancer, with some of these reports indicating the correlation of this polymorphism with higher cancer risk [11–14]. Nevertheless, some other researches did not indicate positive relationship between this variant and cancer risk [23–25]. Our current study is aimed at comprehensively estimating the possible association between SOD2 V16A variant and urological cancer risk [17–22, 26–45]. As the incidence of prostate cancer (PCa) is associated with aging phenomenon [46], we further used enzyme linked immunosorbent assay (ELISA) and immunohistochemical staining (IHS) to explore the expression of SOD2 among PCa participants enrolled in our centers.
Results
Characteristics of our study
As described in Supplementary Table 1, a total of 26 articles containing 28 case-control studies for investigating SOD2 V16A variant, were considered. Overall, 9,910 cancer cases and 11,239 controls were summarized. In subgroup analysis by ethnicity, 21 studies of these were based on Caucasian descendants, four studies were in African population, two were according to mixed population and only one was in Asian descendants. In stratified analysis by cancer type, 19 studies were investigating prostate cancer, 8 were based on bladder cancer, and one study was assessing renal cell carcinoma. 13 studies were performed utilizing hospital-based controls and 15 studies were population-based. Genotype distribution in control group was consistent with Hardy-Weinberg equilibrium (HWE) in 24 of the eligible studies. Moreover, we examined the minor allele frequency (MAF) of SOD2 V16A variant reported for the main populations around the world. For African descendants: A-allele (C) =0.424, V-allele (T) =0.576; for American population: A-allele = 0.580, V-allele = 0.420; for East Asian population: A-allele = 0.125, V-allele = 0.875; for South Asian: A-allele = 0.510, V-allele = 0.490; for European: A-allele = 0.466, V-allele = 0.534; for Global population: A-allele = 0.411, V-allele = 0.589 (Figure 1).
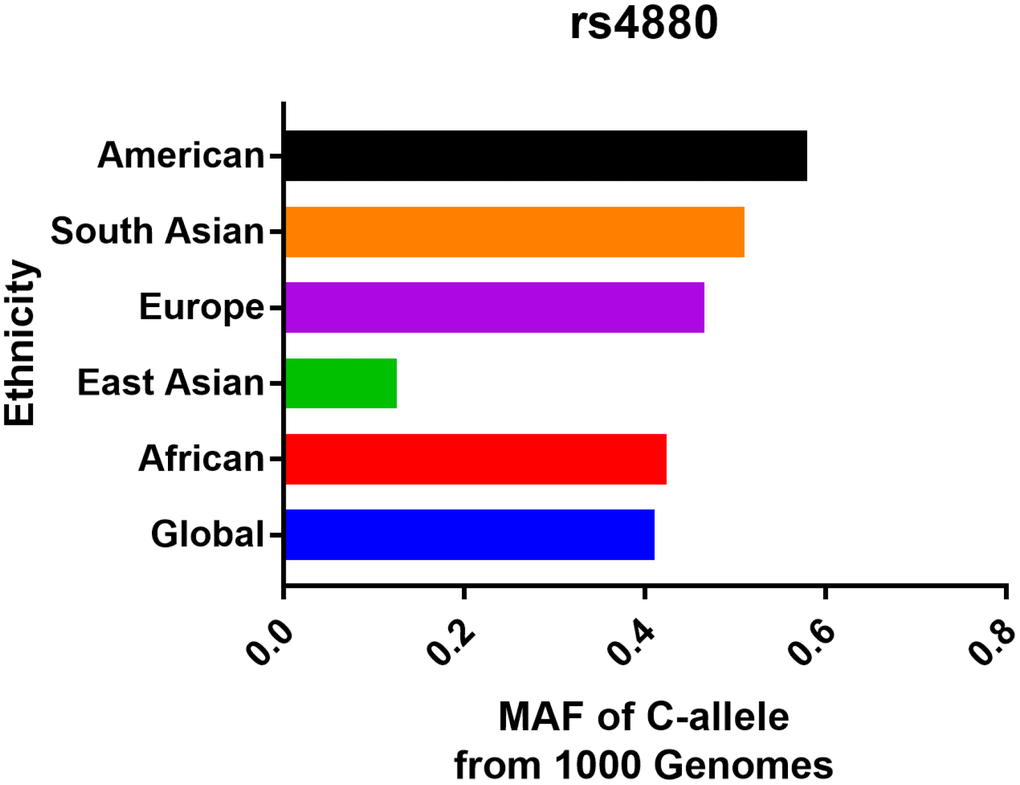
Figure 1. Minor allele frequency for SOD2 rs4880 V16A variant in the main populations around the world. Vertical line, ethnicity; Horizontal line, allele frequency.
Quantitative synthesis
In overall analysis, we identified a significant association between SOD2 V16A variant and urological cancer risk (A-allele vs. V-allele: OR = 1.06, 95% CI = 1.00 – 1.13, Pheterogeneity = 0.006, P = 0.047; AA+AV vs. VV: OR = 1.09, 95% CI = 1.02 – 1.16, P value for heterogeneity = 0.086, P = 0.008) (Table 2). In stratified analysis by cancer type, our results showed evidence that SOD2 V16A polymorphism is significantly associated with increased risk of prostate cancer (A-allele vs. V-allele: OR = 1.07, 95% CI = 1.00 – 1.15, Pheterogeneity = 0.047, P = 0.043, Figure 2; AA+AV vs. VV: OR = 1.12, 95% CI = 1.04 – 1.20, Pheterogeneity = 0.470, P = 0.003), but not for bladder cancer (A-allele vs. V-allele: OR = 1.01, 95% CI = 0.93 – 1.09, Pheterogeneity = 0.089, P = 0.892, Figure 2; AA+AV vs. VV: OR = 1.12, 95% CI = 1.04 – 1.20, Pheterogeneity = 0.470, P = 0.003). Moreover, in stratified analysis by race, we demonstrated positive correlation in Caucasian descendants (allele contrast: OR = 1.08, 95% CI = 1.00 – 1.16, Pheterogeneity = 0.003, P = 0.043, Figure 3; dominant comparison: OR = 1.11, 95% CI = 1.00 – 1.24, P value for heterogeneity = 0.034, P = 0.046). No obvious association was found in African (allele contrast: OR = 0.98, 95% CI = 0.88 – 1.09, Pheterogeneity = 0.958, P = 0.706; dominant comparison: OR = 1.01, 95% CI = 0.80 – 1.18, P value for heterogeneity = 0.908, P = 0.931) and Asian populations (allele contrast: OR = 0.80, 95% CI = 0.53 – 1.21, P = 0.295; dominant comparison: OR = 0.79, 95% CI = 0.50 – 1.24, P = 0.301). In stratified analysis by P value of HWE, we observed positive findings in studies that are consistent with HWE (allele contrast: OR = 1.05, 95% CI = 1.00 – 1.09, Pheterogeneity = 0.006, P = 0.031; dominant comparison: OR = 1.09, 95% CI = 1.02 – 1.17, P value for heterogeneity = 0.048, P = 0.010). Similarly, positive finding was indicated in studies with hospital-based controls (A-allele vs. V-allele: OR = 1.21, 95% CI = 1.02 – 1.43, Pheterogeneity = 0.001, P = 0.027; AV vs. VV: OR = 1.19, 95% CI = 1.01 – 1.39, P value for heterogeneity = 0.060, P = 0.038; AA vs. VV: OR = 1.40, 95% CI = 1.00 – 1.95, P value for heterogeneity = 0.002, P = 0.047; AA vs. AV+VV: OR = 1.32, 95% CI = 1.02 – 1.71, P value for heterogeneity = 0.009, P = 0.034).
Table 2. Stratified analyses of SOD rs4880 V16A polymorphism on urological cancer risk.
| Variables | N | Case/Control | OR(95%CI) PheterP A-allele vs. V-allele | OR(95%CI) PheterP AV vs. VV | OR(95%CI) PheterP AA vs. VV | OR(95%CI) PheterP AA+AV vs. VV | OR(95%CI) PheterP AA vs. AV+VV |
| Total | 28 | 9910/11239 | 1.06(1.00-1.13) 0.006 0.047 | 1.05(0.90-1.08) 0.031 0.359 | 1.13(1.00-1.28) 0.007 0.052 | 1.09(1.02-1.16) 0.086 0.008 | 1.08(0.97-1.20) 0.006 0.138 |
| Ethnicity | |||||||
| Caucasian | 21 | 8020/9025 | 1.08(1.00-1.16) 0.003 0.043 | 1.01(0.94-1.09) 0.084 0.729 | 1.15(0.99-1.33) 0.008 0.060 | 1.11(1.00-1.24) 0.034 0.046 | 1.08(0.97-1.21) 0.017 0.175 |
| African | 4 | 1439/1675 | 0.98(0.88-1.09) 0.958 0.706 | 0.93(0.77-1.12) 0.596 0.417 | 0.95(0.78-1.17) 0.902 0.648 | 1.01(0.80-1.18) 0.908 0.931 | 0.94(0.79-1.12) 0.718 0.467 |
| Mixed | 2 | 238/330 | 1.31(1.03-1.68) 0.485 0.030 | 1.96(1.25-3.07) 0.190 0.003 | 1.87(1.11-3.17) 0.088 0.019 | 1.18(0.78-1.78) 0.434 0.436 | 1.89(1.23-2.90) 0.126 0.003 |
| Asian | 1 | 213/209 | 0.80(0.53-1.21) - 0.295 | 0.88(0.19-4.05) - 0.870 | 0.70(0.15-3.16) - 0.640 | 0.79(0.50-1.24) - 0.301 | 0.73(0.16-3.31) - 0.686 |
| Cancer | |||||||
| PCa | 19 | 7478/8594 | 1.07(1.00-1.15) 0.047 0.043 | 1.06(0.92-1.23) 0.003 0.387 | 1.15(0.99-1.33) 0.022 0.064 | 1.12(1.04-1.20) 0.470 0.003 | 1.10(0.96-1.26) 0.002 0.177 |
| BCa | 8 | 2391/2595 | 1.01(0.93-1.09) 0.089 0.892 | 1.02(0.88-1.18) 0.922 0.782 | 1.03(0.87-1.21) 0.154 0.754 | 0.99(0.88-1.13) 0.059 0.930 | 1.02(0.89-1.17) 0.668 0.745 |
| RCC | 1 | 41/50 | 2.26(1.24-4.11) - 0.008 | 1.96(0.66-5.80) - 0.227 | 4.03(1.28-12.62) - 0.017 | 2.64(1.07-6.52) - 0.035 | 2.72(1.01-7.36) - 0.048 |
| PHWE | |||||||
| HWE | 24 | 8665/9669 | 1.05(1.00-1.09) 0.006 0.031 | 1.00(0.93-1.08) 0.401 0.991 | 1.09(0.96-1.24) 0.043 0.167 | 1.09(1.02-1.17) 0.048 0.010 | 1.04(0.95-1.14) 0.136 0.432 |
| non-HWE | 4 | 1245/1570 | 1.07(0.96-1.20) 0.136 0.200 | 1.72(0.95-3.11) 0.001 0.072 | 1.70(0.96-3.01) 0.007 0.071 | 1.06(0.90-1.26) 0.564 0.495 | 1.73(0.98-3.04) 0.001 0.058 |
| Source | |||||||
| HB | 13 | 1742/2450 | 1.21(1.02-1.43) 0.001 0.027 | 1.19(1.01-1.39) 0.060 0.038 | 1.40(1.00-1.95) 0.002 0.047 | 1.20(0.95-1.52) 0.005 0.129 | 1.32(1.02-1.71) 0.009 0.034 |
| PB | 15 | 8168/9152 | 1.04(0.99-1.08) 0.526 0.101 | 0.98(0.91-1.06) 0.222 0.637 | 1.08(0.99-1.18) 0.329 0.081 | 1.09(1.01-1.17) 0.838 0.022 | 1.01(0.94-1.09) 0.182 0.718 |
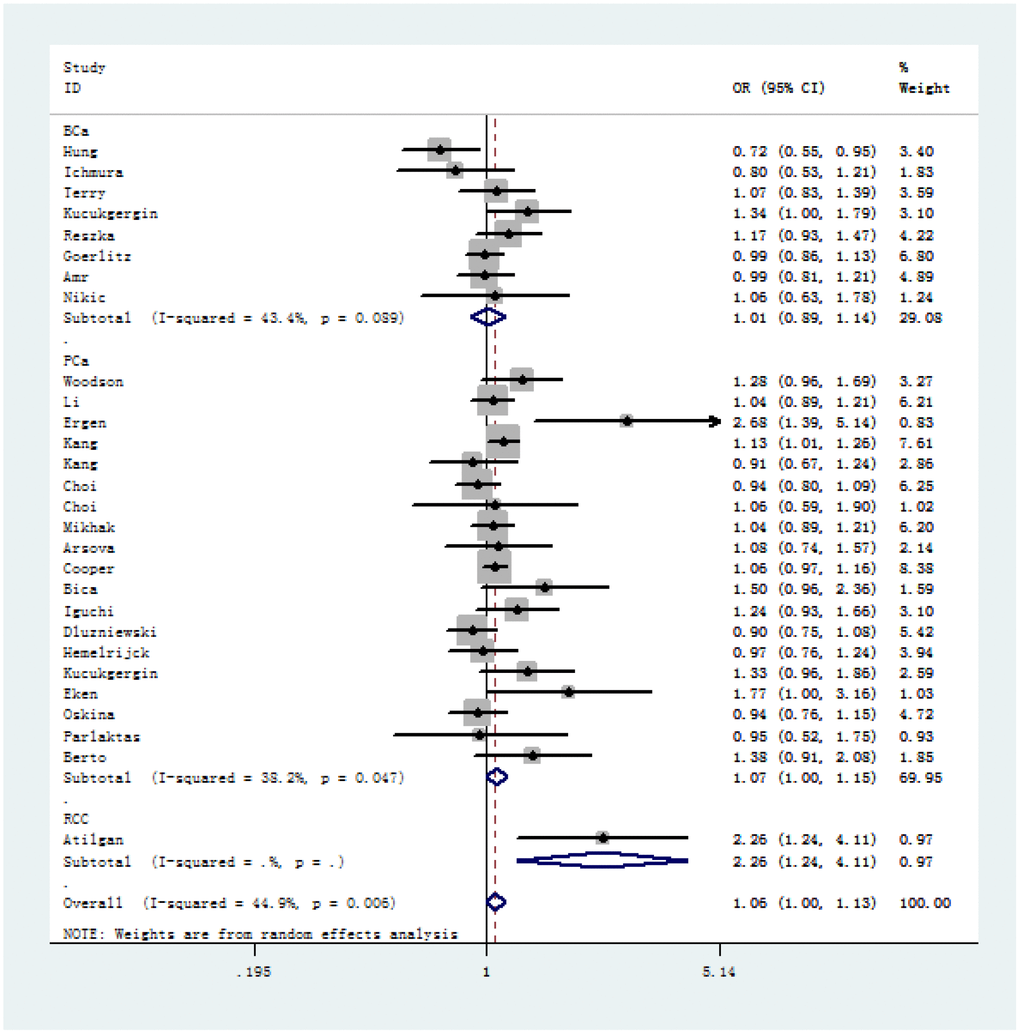
Figure 2. Forest plot of cancer susceptibility correlated with SOD2 rs4880 V16A polymorphism (allelic comparison of A-allele vs. V-allele, random-effects) in stratified analysis by the type of cancer.
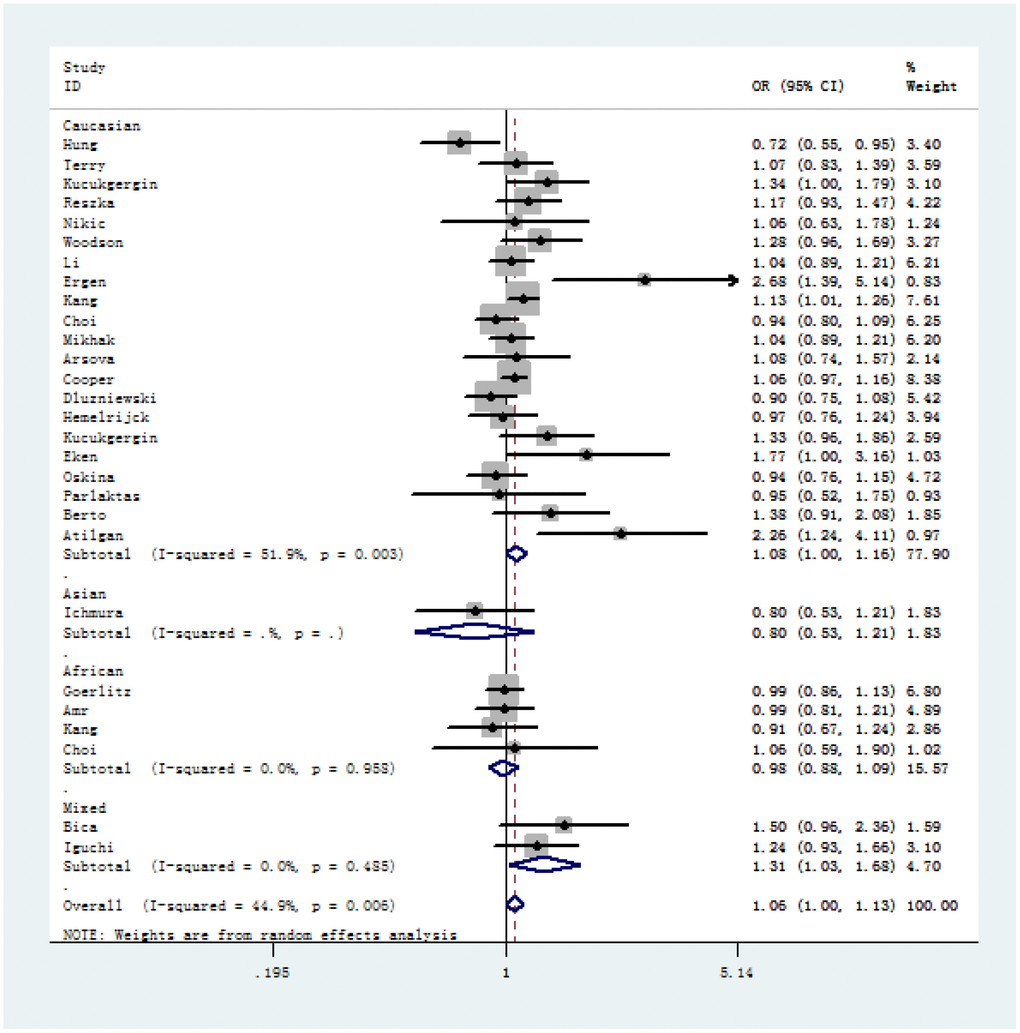
Figure 3. Forest plot of A-allele versus V-allele genetic model of SOD2 rs4880 V16A polymorphism in stratified analysis by ethnicity (random-effects).
Serum and tissue expression of SOD2
220 PCa patients’ serum samples were collected from various genotypes of SOD2 V16A polymorphism for our study. Moreover, the allele frequency of SOD2 V16A variant was also investigated. Allele distribution among the cancer patients enrolled in our centers was: AA, 67 (30.5%); AV, 40 (18.2%); VV 113(51.3%). Also, the MAF of SOD2 V16A variant was 0.270, slightly higher than that demonstrated in East Asian population (0.125), and lower than the MAF identified in South Asian population (0.510). Further, we utilized ELISA to evaluate the serum expression of SOD2 in our study population. Serum SOD2 level of PCa patients with VV+VA genotypes was relatively lower than in those with AA genotypes (Figure 4, P = 0.02). In order to corroborate with the expression of SOD2 in PCa tissues, we utilized IHS to test its expression among cancer subjects in our centers. As shown in Figure 5, the expression of SOD2 was downregulated in more advanced PCa, as compared to less advanced PCa subjects (T4 versus T1, P < 0.05; T4 versus T2, P < 0.05).
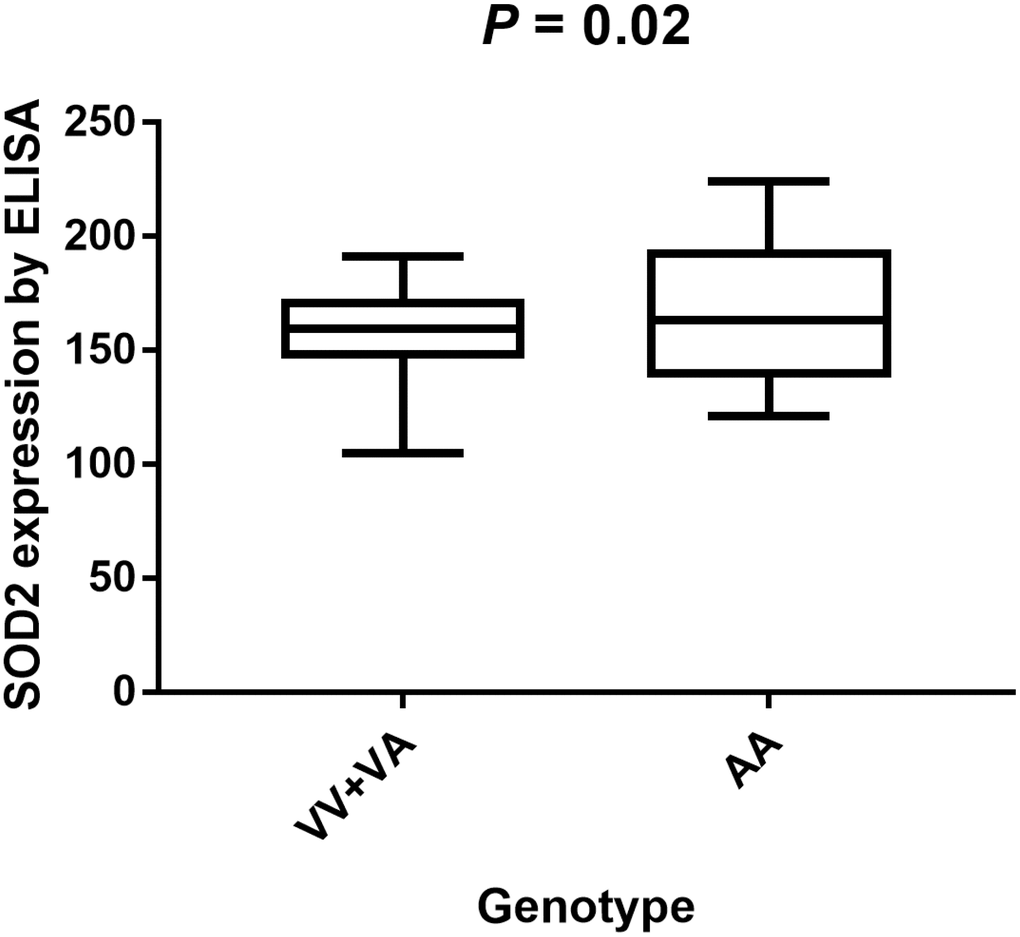
Figure 4. Analysis of serum SOD2 levels in V16A genotype of PCa volunteers with mean values. Serum SOD2 level of PCa patients with VV+VA genotypes was relatively lower than in those with AA genotypes (P = 0.02).
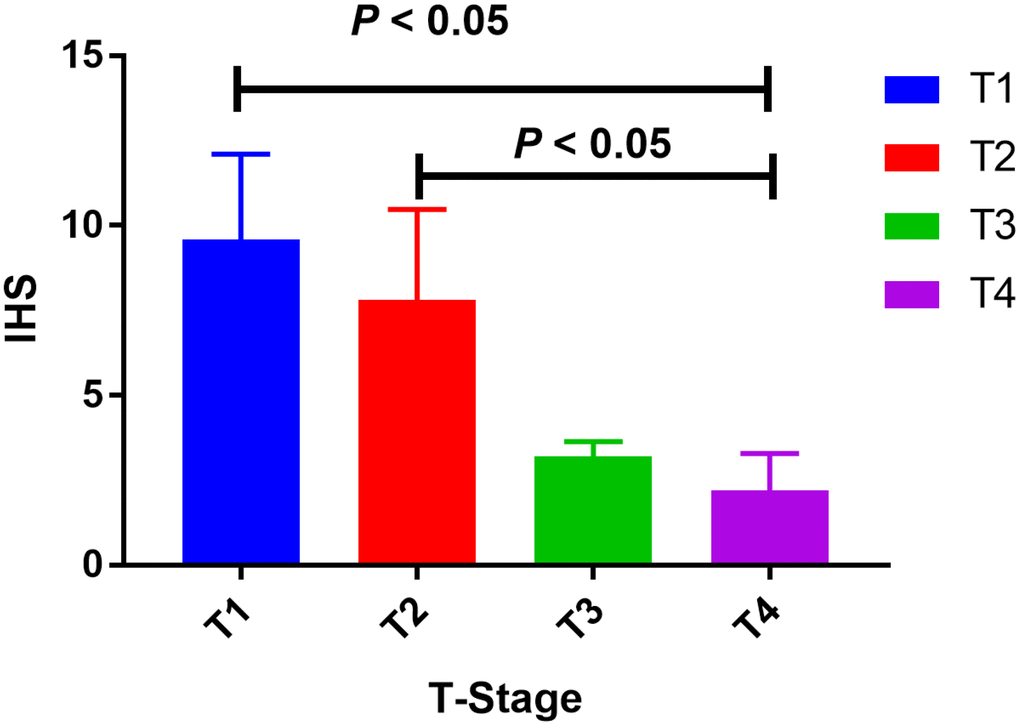
Figure 5. Tissue expression of SOD2 among PCa subjects. The expression of SOD2 was down-regulated in more advanced PCa, as compared to less advanced PCa subjects (T4 versus T1, P < 0.05; T4 versus T2, P < 0.05).
In silico analysis
Results from in silico tools showed that the expression of SOD2 is downregulated in both prostate (Figure 6A) and bladder cancer tissues (Figure 7A). Expression of SOD2 was especially decreased in Asian bladder cancer subjects (Figure 7C, P < 0.05). In addition, prostate cancer subjects with low SOD2 expression had a shorter DFS time than high-SOD2-expression counterparts (Figure 6B, P = 0.047). No positive finding was observed for bladder cancer (Figure 7D, P = 0.200). Moreover, the relationship between the expression of SOD2 and overall survival time of prostate and bladder cancer was also investigated by Kaplan-Meier estimate. Unfortunately, no positive association was indicated for either prostate (Figure 6C, P = 0.630) or bladder cancer (Figure 7B, P = 0.570). The Cancer Genome Atlas (TCGA) samples were utilized to investigate the level of promoter methylation for SOD2 gene in different urological cancers. The promoter methylation level of SOD2 was found to be decreased in both Caucasian and Asian prostate cancer participants (Figure 8A). Nevertheless, SOD2 promoter methylation level was upregulated in bladder cancer subjects (Figure 8B). Additionally, the methylation level was increased in Caucasian renal cell carcinoma patients and decreased in the Asian cases (Figure 8C). Furthermore, we used String online tool to evaluate the functional protein association of SOD2 (http://string-db.org/). As described in Figure 9, more than 10 proteins were predicted to be involved in the interaction of SOD2, including SOD1 (Superoxide dismutase-1), CAT (Catalase), SOD3 (Extracellular superoxide dismutase- 3), FOXO3 (Forkhead box protein O-3), GPX1 (Glutathione peroxidase 1), SIRT3 (NAD-dependent protein deacetylase sirtuin-3), GPX7 (Glutathione peroxidase-7), GPX3 (Glutathione peroxidase-3), AKT1 (RAC-alpha serine/threonine-protein kinase-1), GPX2 (Glutathione peroxidase-2). The gene-gene interaction of SOD2 among prostate cancer participants was also evaluated by TCGA samples. As described in Figure 10A, at least 24 genes were reported to participate in the correlation of SOD2. Among them, complement factor B gene (CFB) was predicted to be the most related gene in prostate cancer. There was a positive correlation between them in prostate cancer (Figure 10B). As was shown in Figure 11, at least 11 miRNA were predicted to be related to SOD2 by TargetScan database. The hsa-miR-330-3p was highly conserved miRNA (Figure11 A), and the rest ten were poorly conserved (Figure11B). To evaluate the correlation of DNA methylation and SOD2 expression, we adopted scatter plots to investigate the relationship between CpG sites and SOD2 expression based on three urological cancers (bladder cancer, prostate cancer, and renal cell carcinoma) in TCGA database. For bladder cancer, SOD2 expression was negatively associated with methylation levels at two CpG sites (cg06346099 and cg10698098, P < 0.05, Figure12A and 12B). The cg09364756 and cg27624424 methylation were correlated with SOD2 expression in prostate cancer (P < 0.05, Figure12C and 12D). For renal cell carcinoma, SOD2 expression was negatively associated with cg18897905 and cg06346099 methylation (P < 0.05, Figure 12E and 12F).
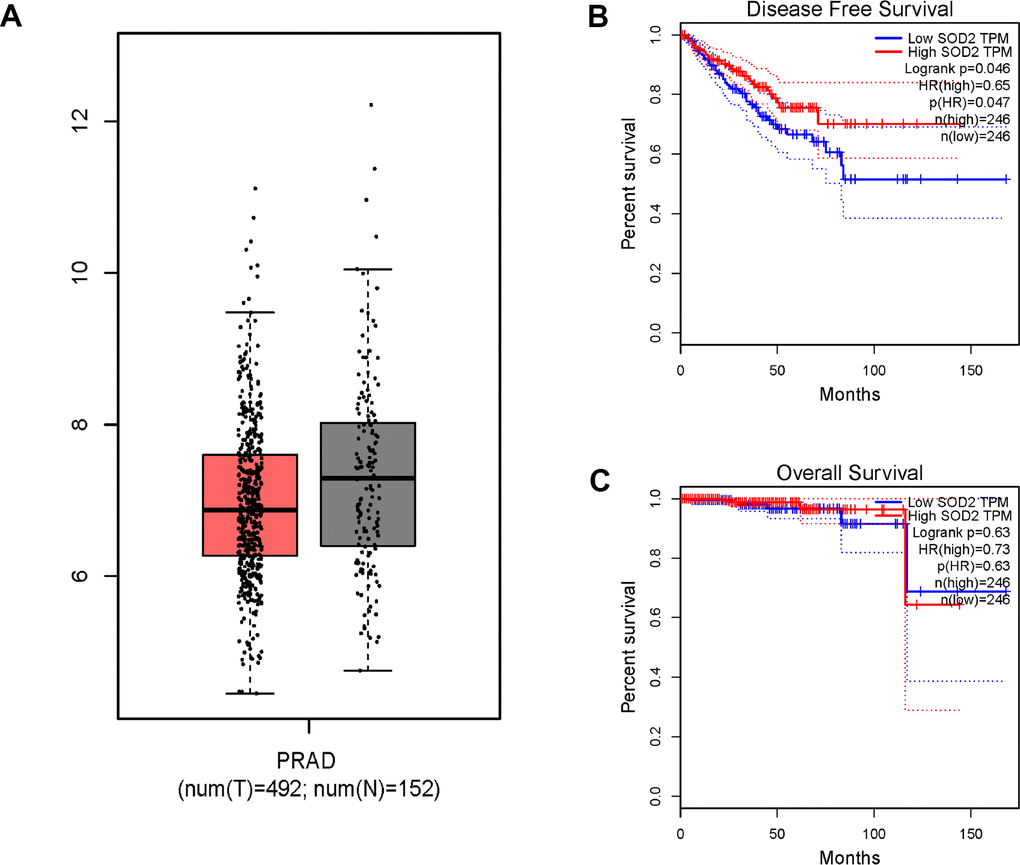
Figure 6. In silico analysis of SOD2 expression in prostate cancer patients (A), the investigation of disease-free survival (DFS) time (B) and overall survival (OS) time (C). Expression of SOD2 was down-regulated in prostate cancer tissues (Figure 6A, P < 0.05). Prostate cancer subjects with low SOD2 expression had a shorter DFS time than high SOD2 expression counterpart (Figure 6B, P = 0.047). No positive association was indicated for prostate cancer participants (Figure 6C, P = 0.630).
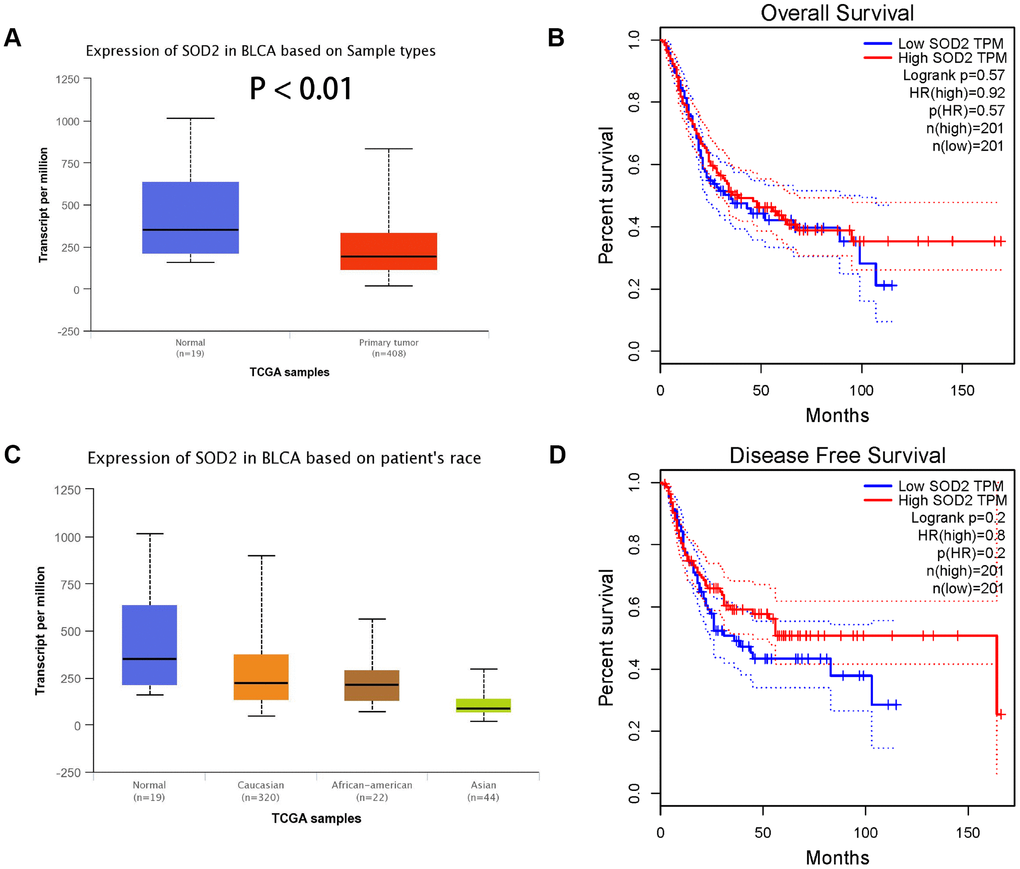
Figure 7. Association of SOD2 expression in bladder cancer subjects (A), based on patients’ race (C), the investigation of OS time (B) and DFS time (D). Expression of SOD2 was also down-regulated in bladder cancer tissues (Figure 7A), especially in Asian populations (Figure 7C, P < 0.05). No obvious difference was indicated in the effect of low SOD expression group and high expression group on OS time (Figure 7B, P = 0.570) and DFS time (Figure 7D, P = 0.200).
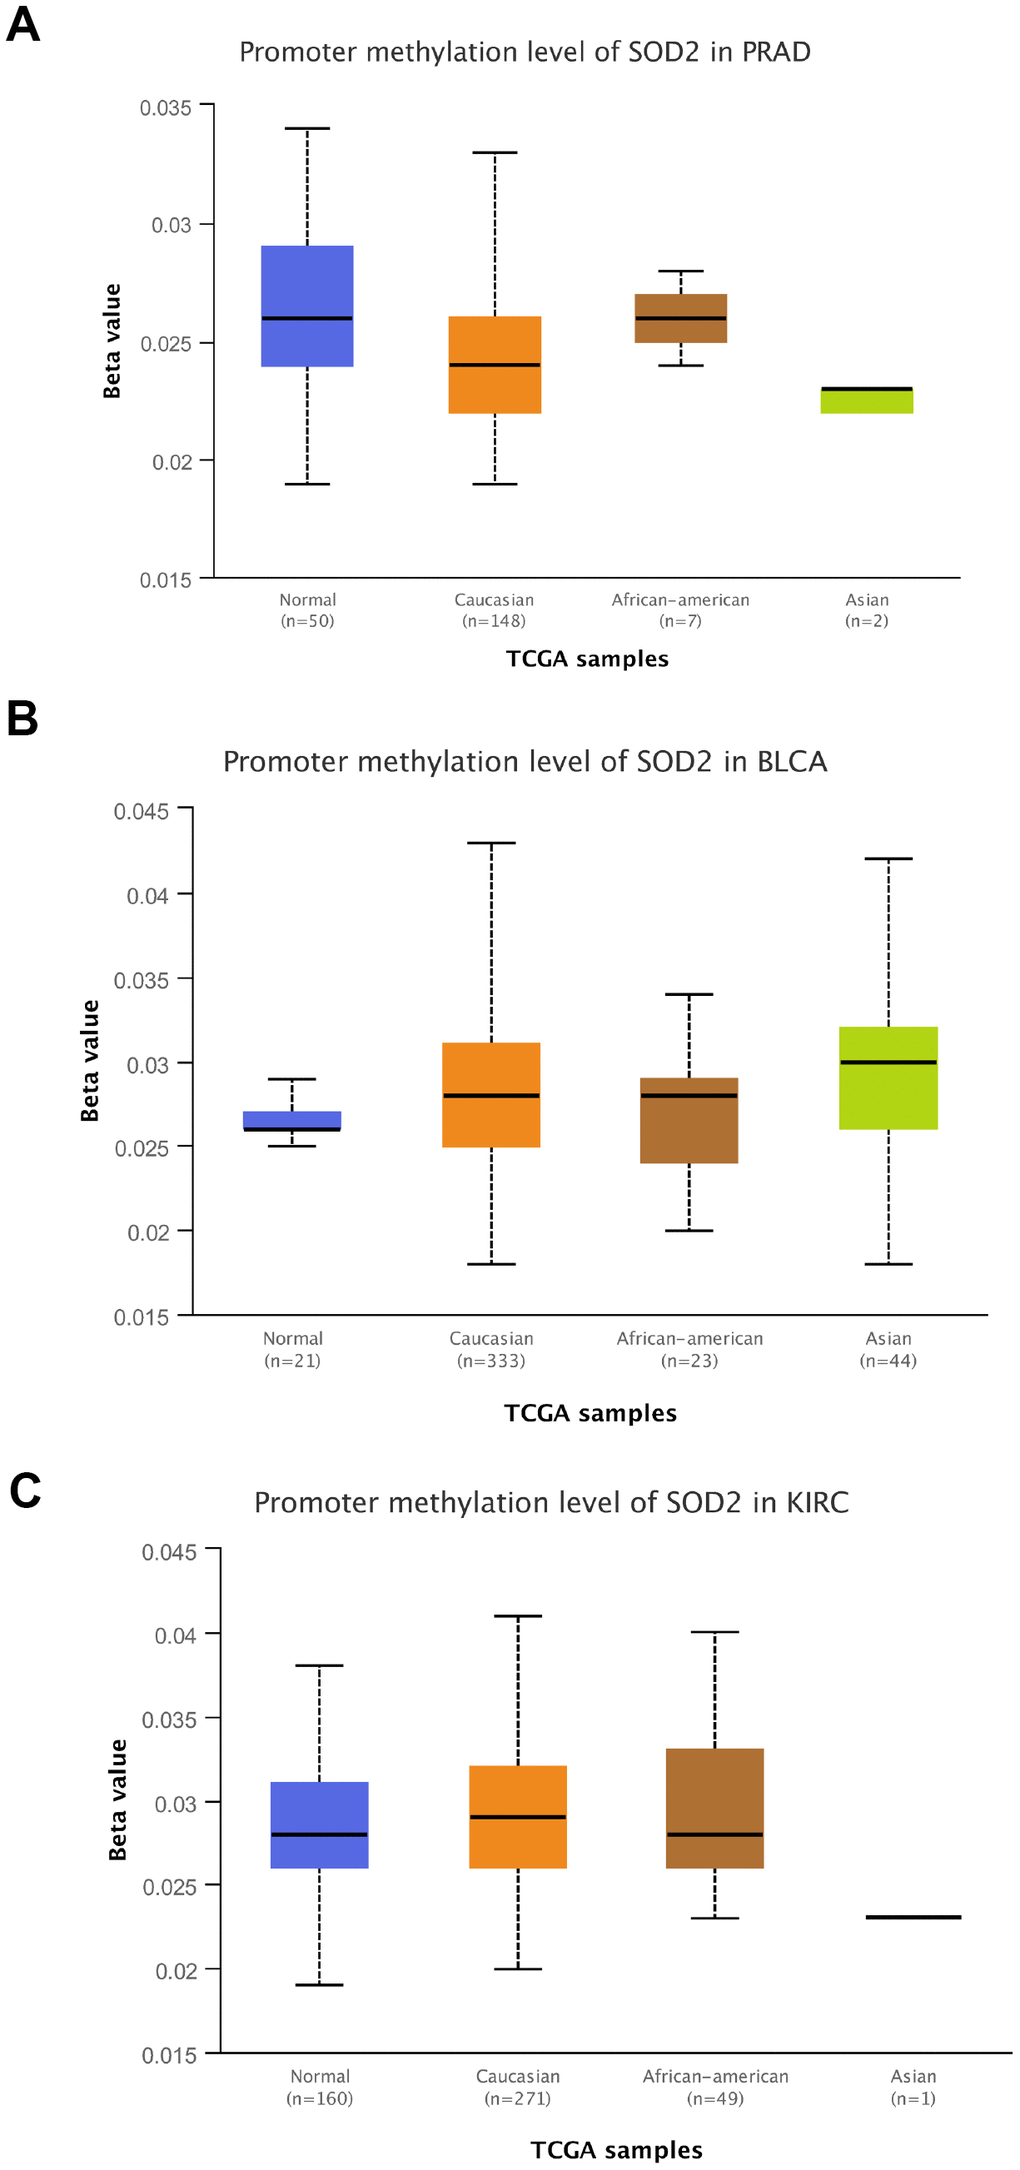
Figure 8. Promoter methylation level of SOD2. Promoter methylation level of SOD2 was decreased in both Caucasian and Asian prostate cancer participants (A). SOD2 promoter methylation level was both up-regulated in bladder cancer subjects (B). The methylation level was increased in Caucasian renal cell carcinoma patients and decreased in Asian cases (C).
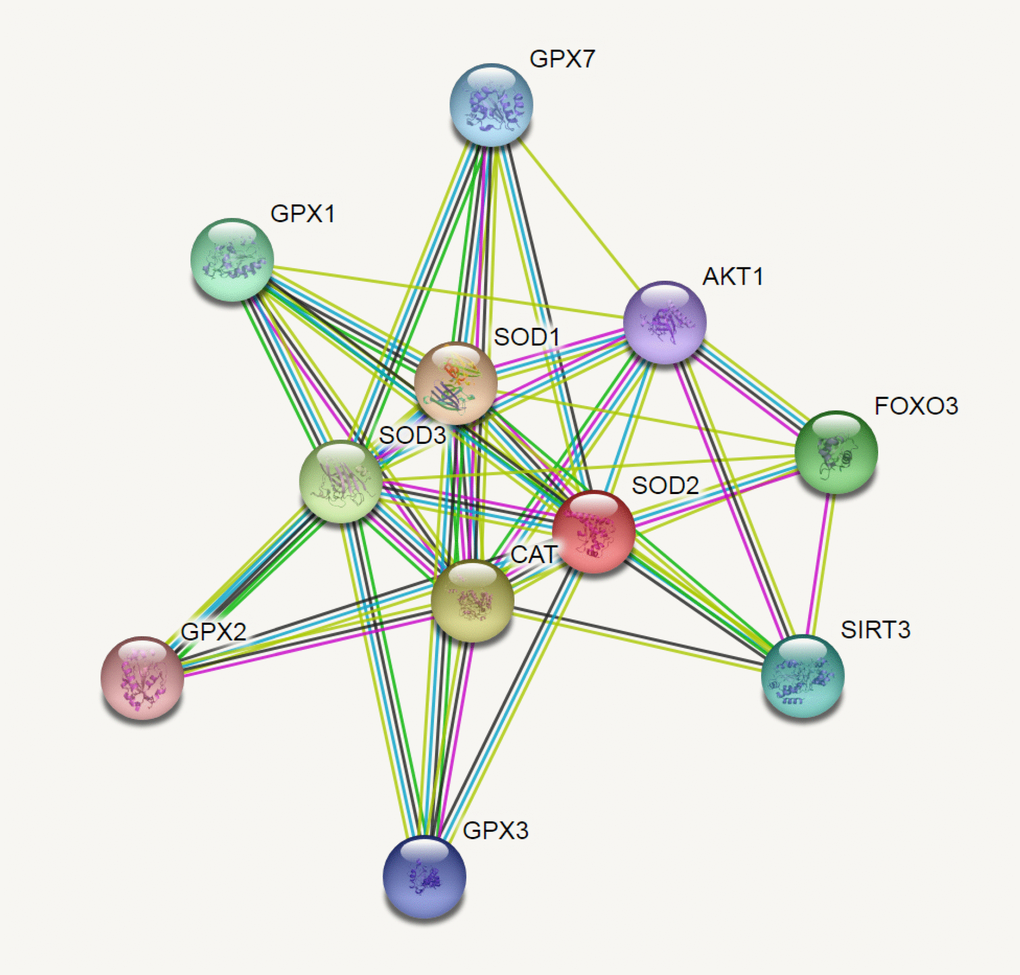
Figure 9. SOD2 correlations crosstalk investigation by String server functional protein association networks (Homo sapiens). At least 10 proteins were predicted to be involved in the interaction of SOD2, including SOD1 (Superoxide dismutase-1), CAT (Catalase), SOD3 (Extracellular superoxide dismutase-3), FOXO3 (Forkhead box protein O-3), GPX1 (Glutathione peroxidase 1), SIRT3 (NAD-dependent protein deacetylase sirtuin-3), GPX7 (Glutathione peroxidase-7), GPX3 (Glutathione peroxidase-3), AKT1 (RAC-alpha serine/threonine-protein kinase-1), GPX2 (Glutathione peroxidase-2).
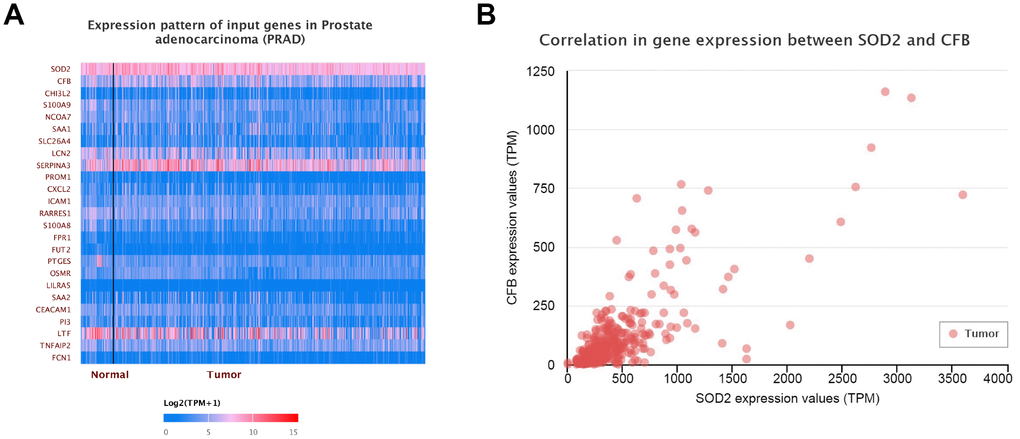
Figure 10. Gene-gene interaction of SOD2. At least 24 genes could participate in the correlation of SOD2 (A). Complement factor B gene (CFB) was predicted to be the most related gene. There was a positive correlation between CFB and SOD2 in PCa (B).
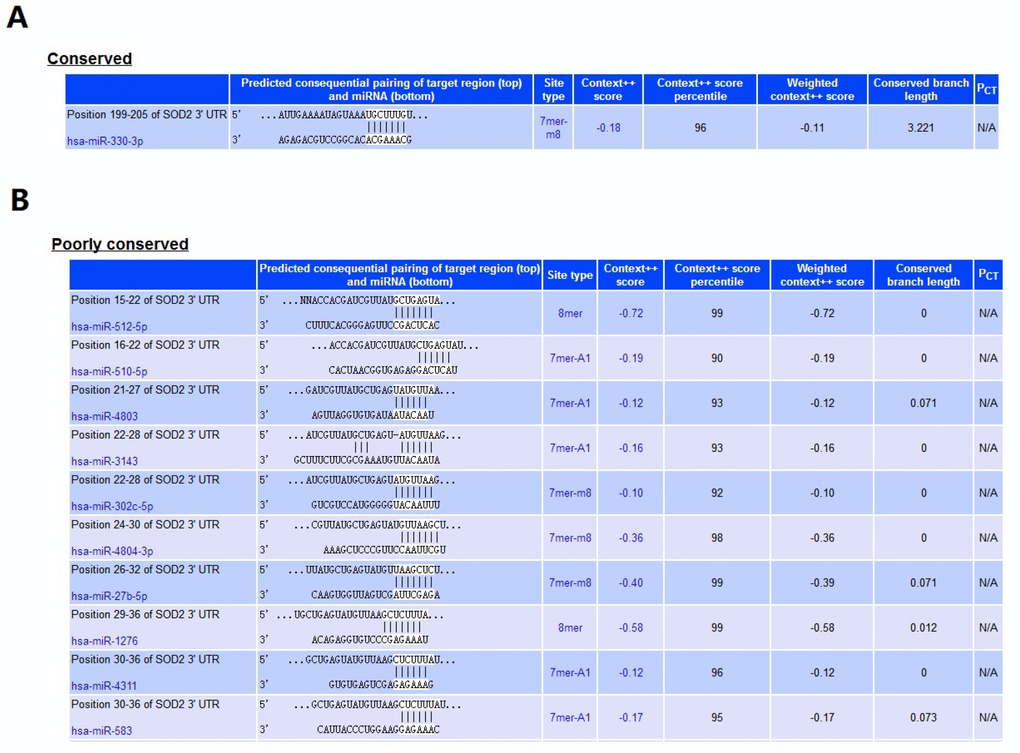
Figure 11. MiRNA that related to SOD2. At least 11 miRNA were predicted to be related to SOD2 by TargetScan database. The hsa-miR-330-3p (A) was highly conserved, and the rest ten were poorly conserved (B).
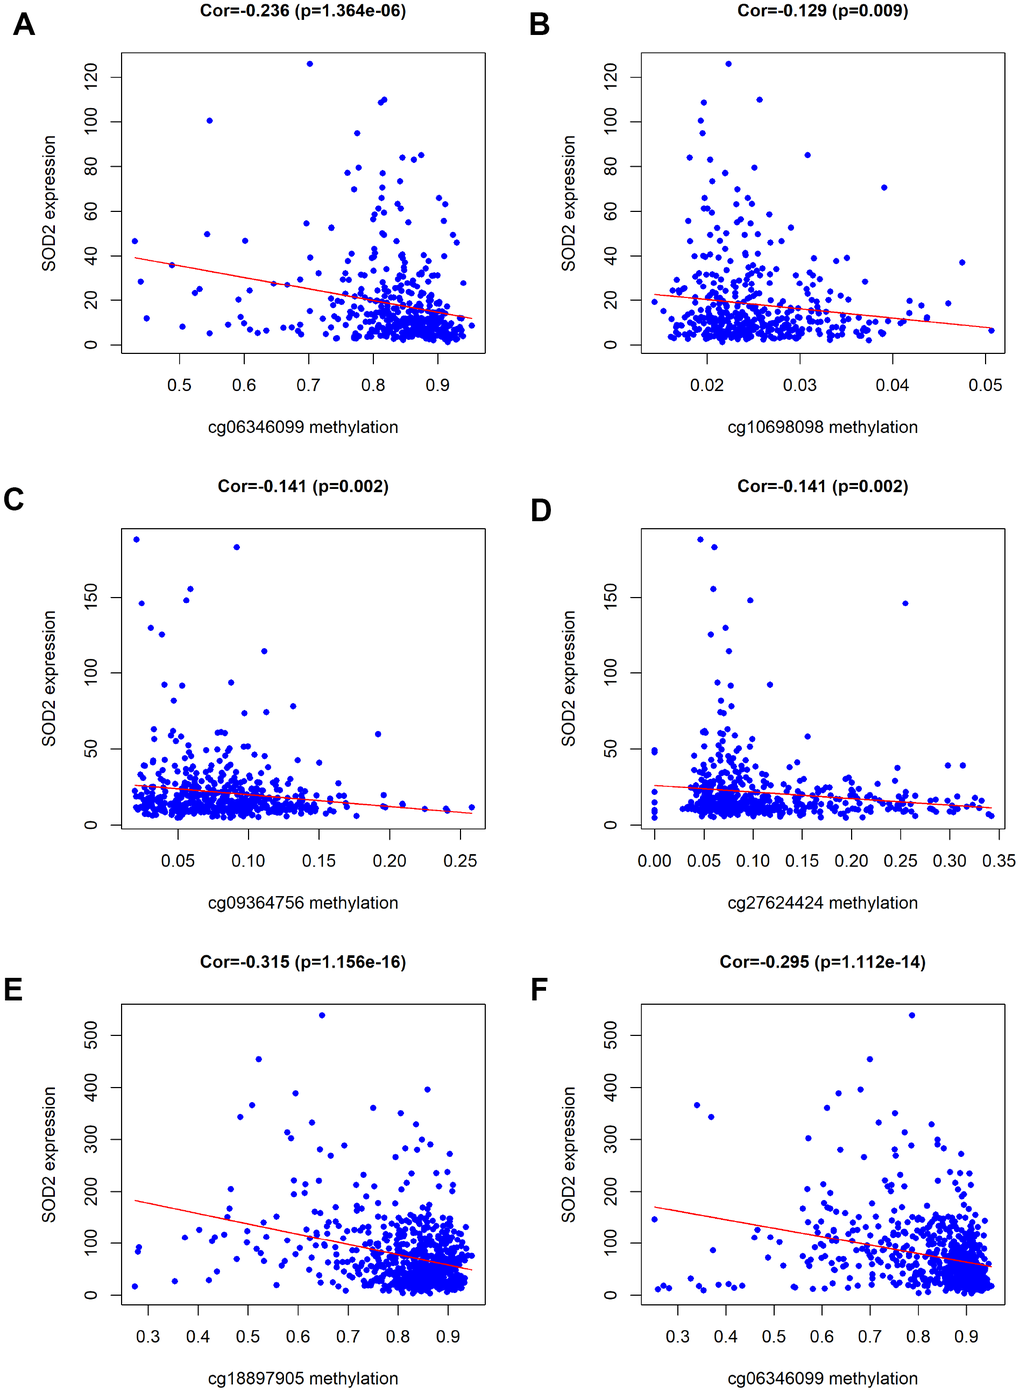
Figure 12. Association of DNA methylation and SOD2 expression. According to the analysis of TCGA data, SOD2 expression was negatively associated with the levels of methylation at six CpG sites (cg06346099 and cg10698098 for BCa, cg09364756 and cg27624424 for PCa, cg18897905 and cg06346099 for RCC).
Publication bias and sensitivity analyses
Egger’s test and Begg’s plot were utilized to investigate any publication bias in the enrolled studies. No evidence of publication bias was identified for SOD2 V16A variant (A-allele versus V-allele: t = 2.17, P = 0.119; AV versus VV: t = 2.03, P = 0.173; AA versus VV: t = 2.06, P = 0.213; AA+VA vs. VV: t = 2.16, P = 0.110; AA vs. VA + VV: t = 2.03, P = 0.149, Figure 13A). Sensitivity analysis was also carried out to check the effect of each study on pooled ORs by repeating the meta-analysis when each time an individual study was removed. The sensitivity analysis for the relationship of SOD2 V16A variant in the allelic contrast is described in Figure 13B, indicating that no single study could have an impact on the pooled OR. These results suggested that conclusions drawn from the present analyses are reliable.
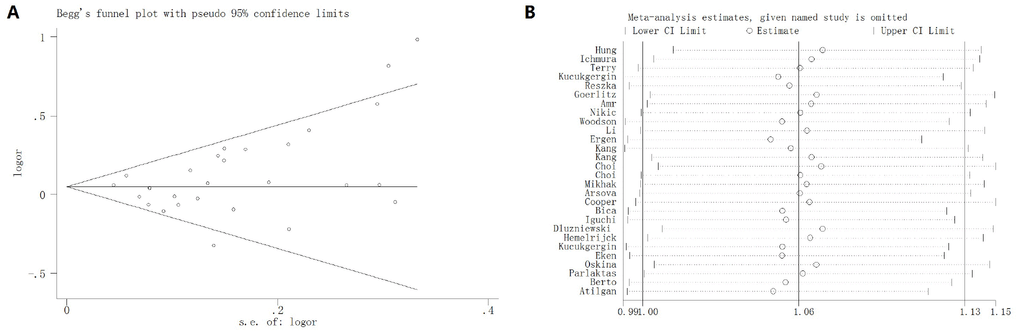
Figure 13. Begg’s funnel plot (A) and sensitivity analysis (B) for SOD2 rs4880 V16A polymorphism under allelic contrast model. No evidence of publication bias was identified for SOD2 V16A variant by Begg’s funnel plots test (t = 2.17, P = 0.119). No single study could have an impact on the pooled OR through sensitivity analysis.
Discussion
Previous studies have shown that SOD plays a central role in protecting organisms from the harmful effets of superoxide free radicals, by converting them into hydrogen peroxide [5, 47]. Further in vivo experiments utilizing SOD2-deficient mice showed perinatal death, myocardial injury and neurodegeneration caused by impaired SOD2 activity [48, 49]. SOD2, as one of the most crucial enzymes against mitochondrial ROS, has also been found to act as a potential tumor suppressor gene in carcinogenesis [50, 51]. Some studies have shown that the activity and expression of SOD2 in cancer cells are significantly down regulated as compared to that in control cells [52, 53].
Till date, several studies have assessed the relationship between SOD2 V16A variant and cancer susceptibility; however, their conclusions remain inconsistent [17–22]. A previous study in Macedonian population indicated that SOD2 V16A variant is associated with risk of prostate cancer [33]. This finding was also confirmed by Kucukgergin et al based on Turkish descendants [38]. Nevertheless, Choi and his group indicated a different result [32]. Li et al [14] performed a meta-analysis and found that SOD2 V16A variant was associated with increased prostate cancer risk. Conversely, another meta-analysis conducted by Bag et al [54] indicated that this polymorphism was not significantly associated with overall cancer risk. Therefore, the overall objective of this study was to assess all eligible data on the basis of inclusion criteria in order to improve statistical effectiveness and acquire more reliable conclusions.
In the present study, a total of 9,910 cancer subjects and 11,239 control participants were accounted into the analysis. Overall results indicated that SOD Val16Ala polymorphism is correlated with increased urological cancer susceptibility, especially for prostate cancer, which is consistent with previous findings. [14, 33, 55]. In stratified analysis by race, we observed similar findings in Caucasians and mixed populations, but not in Asians and Africans. Stratification analysis also revealed that this correlation was more obvious in hospital-based and high quality studies. In silico tools showed evidence that the expression of SOD2 is downregulated in both prostate and bladder cancer tissues as compared to that in control. To verify this finding, we utilized ELISA to evaluate the serum expression of SOD2 in our study population and revealed that the serum SOD2 level in PCa patients with VV+VA genotypes was relatively lower than in those with AA genotypes. Besides, we utilized IHS to further investigate the expression of SOD2 in different stages of PCa cases and found that SOD2 expression was downregulated in more advanced PCa as compared to less advanced PCa subjects. Results from in silico tools indicated that the expression of SOD2 was downregulated in both prostate and bladder cancer tissues as compared to the control samples. Furthermore, prostate cancer subjects with low SOD2 expression had a shorter DFS time than the high-SOD2-expression counterpart. According to the analysis of TCGA data, SOD2 expression was negatively associated with the levels of methylation at six CpG sites (cg06346099 and cg10698098 for BCa, cg09364756 and cg27624424 for PCa, cg18897905 and cg06346099 for RCC).
It is important to consider the limitations of the current analysis which might have an influence on the final conclusion. First, the number of registered articles in the present analysis is still insufficient for a more comprehensive analysis. Only four studies were based on African population and one was towards Asian descendants. Second, subjects from hospitals or populations may have potential diseases, which may affect the health of participants and the findings of this study. In addition, we did not evaluate the serum SOD2 level in healthy participants due to ethical factors. In stratification analysis by cancer type, only one study was for renal cell carcinoma. We tried to further assess the potential interactions between SOD2 V16A variant and different stages and grades of tumors; however, the original data remains insufficient. As described in Figure 9, according to String analysis, at least ten proteins might participate in the interaction with SOD2. However, TCGA samples showed more than 24 genes to be correlated with SOD2 in prostate cancer. Complement factor B gene (CFB) was predicted to be the most related gene. However, there are few studies on the specific mechanism of CFB gene in prostate cancer. The hsa-miR-330-3p was predicted to be highly conserved miRNA related to SOD2. As no further investigation on their correlation could be identified from the online database, future in vitro and functional experiment are required to verify these interactions in more detail. Importantly, future research is still warranted to ascertain whether the SOD2 V16A variant is responsible for the reduced SOD2 gene expression. Moreover, some advantages of the present analysis need to be mentioned. First, all eligible studies that assessed the relationship between SOD2 V16A variant and urological cancer risk were enrolled in the current analysis, which could acquire more reliable conclusions compared to a single study. Besides, the Begg’s plot and Egger’s test demonstrated no evidence of publication bias, which indicated that the conclusions drawn from the present analyses are reliable.
Conclusions
Taken together, the current analyses demonstrate that SOD2 V16A variant may be associated with increased susceptibility to urological cancer, especially for prostate cancer. Moreover, the expression of SOD2 was found to be downregulated in more advanced prostate cancer participants, as compared to the less advanced ones. Further high quality randomized controlled studies are necessary to ascertain the correlation between SOD2 V16A variant and urological cancer risk or survival in more detail.
Materials and Methods
Search strategy
All suitable studies on SOD2 variant and cancer risk were retrieved by systematically searching databases including Embase, PubMed, Google scholar, Chinese National Knowledge Infrastructure (CNKI), and Wanfang databases (the last search was conducted on August 22, 2019). The search keywords were as follows: “SOD2” or “Superoxide Dismutase 2”, “variant” or “polymorphism”, “cancer” or “tumor” or “carcinoma”. Additional suitable publications were hand-searched from original studies or references about this topic.
Inclusion and exclusion criteria
Two investigators selected case-control studies according to the following inclusion criteria: (a) studies compared cancer with control; (b) investigating the correlation between SOD2 V16A variant and urological cancer risk (including prostate cancer, bladder cancer and renal cell carcinoma); (c) providing sufficient genotype data and allele distribution for calculating odds ratio with 95% confidence interval. If any of the following aspects exist, the study was excluded: (a) without suitable genotype data; (b) studies without controls; (c) duplicate publications with previous data.
Data extraction
Two authors independently reviewed and identified the eligible studies based on the criteria mentioned above. Detailed information of the extracted studies was as follows: first author’s name, publication year, ethnicity of study population, control source (hospital-based or population-based), type of cancer, total number of case and control with V/V, V/A, A/A genotypes, P value of Hardy-Weinberg equilibrium (HWE) in control, age range, method of genotyping. Controversial content should be addressed by discussion of all investigators to reach a final consensus.
Statistical analysis
The strength of correlation between SOD2 V16A and urological cancer susceptibility was measured by odds ratios (ORs) combined with 95% confidence intervals (CIs). Pooled ORs of five comparison models were investigated: allelic comparison (A-allele versus V-allele), homozygous model (AA versus VV), heterozygous model (VA versus VV), dominant comparison (AA+VA vs. VV), and recessive comparison (AA vs. VA + VV). We employed Chi-square-based Q test to assess statistical heterogeneity among studies. If P value less than 0.05, heterogeneity was considered significant. Therefore, the fixed-effects model (Mantel-Haenszel method) was conducted. Otherwise, random-effects model (DerSimonian-Laird method) was adopted. Subgroup analyses were measured by ethnicity (Caucasian, Asian, African, or mixed population), type of cancer (prostate cancer, bladder cancer and renal cell carcinoma), source of control (hospital-based and population-based studies). Hardy-Weinberg equilibrium (HWE) in control group was also calculated. If P value of HWE less than 0.05, it should be defined as low quality study (Classified as non-HWE group). We applied Begg’s funnel plots and Egger’s test to check publication bias among studies. P value less than 0.05 can be defined as the existence of significant publication bias. Moreover, we applied sensitivity analysis to determine the stability of final result by omitting one study each time. STATA software (v11.0; Stata Corporation, TX) was employed in all of the above statistical analyses.
Study population
Overall, 220 pathologically confirmed prostate cancer subjects were recruited from the Affiliated Changzhou No.2 People’s Hospital of Nanjing Medical University and Affiliated Hospital of Jiangnan University. Distribution of PCa patients’ characteristics was summarized in Table 1. These patients were diagnosed with prostate cancer through needle biopsy (from February 2013 to July 2018). 2 milliliters of peripheral blood samples were collected from every enrolled prostate cancer participants. Before all blood samples were prepared, written informed consent should be acquired from every study subjects. The present study protocol was approved by the above hospitals.
Table 1. Distribution of characteristics from the PCa patients involved in our hospitals.
| Features | PCa patients |
| N | 220 |
| Age,n(%) | |
| <60 | 101(45.9) |
| ≥60 | 119(54.1) |
| Smoking, n (%) | |
| Ever | 99(45) |
| Never | 121(55) |
| Alcohol drinking, n (%) | |
| Ever | 131(59.5) |
| Never | 89(40.5) |
| PSA, n (%) | |
| 4-10 | 133(60.4) |
| 10-20 | 69(31.3) |
| >20 | 18(8.3) |
| Gleason score (%) | |
| <7 | 101(45.9) |
| =7 | 69(31.4) |
| >7 | 50(22.7) |
| TNM stage (%) | |
| ≤T2c | 151(68.6) |
| =T3a | 44(20) |
| ≥T3b | 25(11.4) |
| Recurrent (%) | |
| Yes | 19 (8.6) |
| No | 201(91.4) |
Genotyping methods
Genotyping of SOD2 V16A polymorphism was carried out using different techniques in various studies, such as real-time PCR, restriction fragment length polymorphism PCR (PCR-RFLP), MassArray (Sequenom, San Diego, CA), Mass spectrometry (matrix-assisted laser desorption/ionization time-of-flight) (Sequenom, San Diego, CA). In our experiment, SOD2 V16A polymorphism was determined using TaqMan assay by Li et al. [56]
Enzyme Linked immunosorbent Assay (ELISA) and immunohistochemical staining (IHS)
Blood of participants was gathered in standard cubes without anticoagulant. We applied serum separator tube (SST) and solidified the sample at room temperature for 2 hours, and then centrifuged at 1000 × g for 15 minutes. Take out the serum immediately and determine it, and divide it equally or store the sample at -80 °C. Serum SOD2 expression of participants recruited from our centers was tested by ELISA kit (CUSABIO Co. ltd.). Moreover, we utilized IHS to test the tissue expression of SOD2 among PCa subjects in our centers. Paraffin section of prostate cancer was incubated in hydrogen peroxide (1%) and then washed in PBS. We used goat serum to block the binding of non-specific proteins. Then the slice was incubated with anti-SOD2 antibody at 1: 200. The immunoreactive sites were shown brown with diaminobenzidine.
In silico analysis of SOD2 expression
We applied online gene expression database to evaluate SOD2 expression in prostate and bladder cancer based on different ethnic population (http://gemini.cancer-pku.cn/). We further adopted The Cancer Genome Atlas (TCGA) samples to evaluate high and low expression of SOD2 on overall survival time and BCa: bladder cancer; HWE: Hardy-Weinberg equilibrium; HB: hospital-based; PB: population-based; Pheter: P value of Q-test for heterogeneity test; PHWE: P value of HWE; PCa: prostate cancer; RCC: renal cell carcinoma.
disease free survival time. Promoter methylation levels of SOD2 in different urological cancers were also evaluated. String online server was employed to investigate functional protein association of SOD2 (http://string-db.org/). We further utilized TCGA samples to investigate gene-gene interaction of SOD2 among prostate cancer participants (http://ualcan.path.uab.edu/analysis.html). Promoter methylation level of SOD2 was also investigated by TCGA samples (http://ualcan.path.uab.edu/cgi-bin/TCGA-methyl-Result.pl?genenam=SOD2). Additionally, TargetScan database was utilized to predict the possible miRNA correlated to SOD2 (http://www.targetscan.org/vert_71/).
Supplementary Materials
Author Contributions
YYM, LZ and LFZ were involved in the design of this study, LJZ and CY contributed to the databases searching, WZ and WY extracted the data, LS and YYM wrote the manuscript, BWT, CY, LFZ and KX contributed to the experiment research. LZ, LFZ and LJZ interpreted the results and revised the manuscript.
Acknowledgments
We are grateful to all the families who are involved in this study, the whole ALSPAC team including interviewers, clerical workers, technicians, receptionists and nurses.
Conflicts of Interest
The authors declare that the research was conducted in the absence of any commercial or financial relationships that could be construed as a potential conflict of interest.
Funding
This study was supported by grant of National Natural Science Foundation (No. 81802576, 81902565), High-Level Medical Talents Training Project (Project No.: 2016CZBJ035), Young Scientists Foundation of Changzhou No.2 People’s Hospital (2019K008), Jiangsu Province Traditional Chinese Medicine Administration (No. YB201827), Wuxi Science and Technology Development Grant (No.:CSE31N1605, WX18IIAN024), Jiangsu ‘333 Project’ Scientific Research Grant (Project No.: BRA 2016118), Wuxi City Medical Young Talent (No.QNRC043), Changzhou Sci and Tech program (CJ20190100), Changzhou 23rd Science and Technology Project (No. CZ20160017), Wuxi Commission of Health and Family Planning (Project No.: J201803, Q201746, jzyx03, J201810, T201713, Z201712), Jiangsu Post-Doc Scientific Research Fund (No.1701184C). Wuxi Health and Family Planning Commission (No. ZM001); Jiangnan University Wuxi School of Medicine (No. 1286010242190070).
References
- 1. Ferlay J, Soerjomataram I, Dikshit R, Eser S, Mathers C, Rebelo M, Parkin DM, Forman D, Bray F. Cancer incidence and mortality worldwide: sources, methods and major patterns in GLOBOCAN 2012. Int J Cancer. 2015; 136:E359–86. https://doi.org/10.1002/ijc.29210 [PubMed]
- 2. Vogelstein B, Papadopoulos N, Velculescu VE, Zhou S, Diaz LA
Jr , Kinzler KW. Cancer genome landscapes. Science. 2013; 339:1546–58. https://doi.org/10.1126/science.1235122 [PubMed] - 3. Bozic I, Antal T, Ohtsuki H, Carter H, Kim D, Chen S, Karchin R, Kinzler KW, Vogelstein B, Nowak MA. Accumulation of driver and passenger mutations during tumor progression. Proc Natl Acad Sci USA. 2010; 107:18545–50. https://doi.org/10.1073/pnas.1010978107 [PubMed]
- 4. Storz P. Reactive oxygen species in tumor progression. Front Biosci. 2005; 10:1881–96. https://doi.org/10.2741/1667 [PubMed]
- 5. Crawford A, Fassett RG, Geraghty DP, Kunde DA, Ball MJ, Robertson IK, Coombes JS. Relationships between single nucleotide polymorphisms of antioxidant enzymes and disease. Gene. 2012; 501:89–103. https://doi.org/10.1016/j.gene.2012.04.011 [PubMed]
- 6. Forsberg L, de Faire U, Morgenstern R. Oxidative stress, human genetic variation, and disease. Arch Biochem Biophys. 2001; 389:84–93. https://doi.org/10.1006/abbi.2001.2295 [PubMed]
- 7. Church SL, Grant JW, Meese EU, Trent JM. Sublocalization of the gene encoding manganese superoxide dismutase (MnSOD/SOD2) to 6q25 by fluorescence in situ hybridization and somatic cell hybrid mapping. Genomics. 1992; 14:823–25. https://doi.org/10.1016/S0888-7543(05)80202-2 [PubMed]
- 8. Creagan R, Tischfield J, Ricciuti F, Ruddle FH. Chromosome assignments of genes in man using mouse-human somatic cell hybrids: mitochondrial superoxide dismutase (indophenol oxidase-B, tetrameric) to chromosome 6. Humangenetik. 1973; 20:203–09. https://doi.org/10.1007/BF00385731 [PubMed]
- 9. Dhar SK, St Clair DK. Manganese superoxide dismutase regulation and cancer. Free Radic Biol Med. 2012; 52:2209–22. https://doi.org/10.1016/j.freeradbiomed.2012.03.009 [PubMed]
- 10. Yuzhalin AE, Kutikhin AG. Inherited variations in the SOD and GPX gene families and cancer risk. Free Radic Res. 2012; 46:581–99. https://doi.org/10.3109/10715762.2012.658515 [PubMed]
- 11. Mitrunen K, Sillanpää P, Kataja V, Eskelinen M, Kosma VM, Benhamou S, Uusitupa M, Hirvonen A. Association between manganese superoxide dismutase (MnSOD) gene polymorphism and breast cancer risk. Carcinogenesis. 2001; 22:827–29. https://doi.org/10.1093/carcin/22.5.827 [PubMed]
- 12. Cai Q, Shu XO, Wen W, Cheng JR, Dai Q, Gao YT, Zheng W. Genetic polymorphism in the manganese superoxide dismutase gene, antioxidant intake, and breast cancer risk: results from the Shanghai Breast Cancer Study. Breast Cancer Res. 2004; 6:R647–55. https://doi.org/10.1186/bcr929 [PubMed]
- 13. Stoehlmacher J, Ingles SA, Park DJ, Zhang W, Lenz HJ. The -9Ala/-9Val polymorphism in the mitochondrial targeting sequence of the manganese superoxide dismutase gene (MnSOD) is associated with age among Hispanics with colorectal carcinoma. Oncol Rep. 2002; 9:235–38. https://doi.org/10.3892/or.9.2.235 [PubMed]
- 14. Li X, Shen M, Cai H, Liu K, Liu Y, Huang Z, Liang C, Deng X, Ye J, Zou Q, Li J. Association between manganese superoxide dismutase (MnSOD) polymorphism and prostate cancer susceptibility: a meta-analysis. Int J Biol Markers. 2016; 31:e422–30. https://doi.org/10.5301/jbm.5000188 [PubMed]
- 15. Tong SY, Lee JM, Song ES, Lee KB, Kim MK, Lee JK, Son SK, Lee JP, Kim JH, Kwon YI. Functional polymorphism in manganese superoxide dismutase and antioxidant status: their interactions on the risk of cervical intraepithelial neoplasia and cervical cancer. Gynecol Oncol. 2009; 115:272–76. https://doi.org/10.1016/j.ygyno.2009.07.032 [PubMed]
- 16. Murphy SJ, Hughes AE, Patterson CC, Anderson LA, Watson RG, Johnston BT, Comber H, McGuigan J, Reynolds JV, Murray LJ. A population-based association study of SNPs of GSTP1, MnSOD, GPX2 and Barrett’s esophagus and esophageal adenocarcinoma. Carcinogenesis. 2007; 28:1323–28. https://doi.org/10.1093/carcin/bgm007 [PubMed]
- 17. Ichimura Y, Habuchi T, Tsuchiya N, Wang L, Oyama C, Sato K, Nishiyama H, Ogawa O, Kato T. Increased risk of bladder cancer associated with a glutathione peroxidase 1 codon 198 variant. J Urol. 2004; 172:728–32. https://doi.org/10.1097/01.ju.0000130942.40597.9d [PubMed]
- 18. Dluzniewski PJ, Wang MH, Zheng SL, De Marzo AM, Drake CG, Fedor HL, Partin AW, Han M, Fallin MD, Xu J, Isaacs WB, Platz EA. Variation in IL10 and other genes involved in the immune response and in oxidation and prostate cancer recurrence. Cancer Epidemiol Biomarkers Prev. 2012; 21:1774–82. https://doi.org/10.1158/1055-9965.EPI-12-0458 [PubMed]
- 19. Bica CG, de Moura da Silva LL, Toscani NV, da Cruz IB, Sá G, Graudenz MS, Zettler CG. MnSOD gene polymorphism association with steroid-dependent cancer. Pathol Oncol Res. 2009; 15:19–24. https://doi.org/10.1007/s12253-008-9064-6 [PubMed]
- 20. Goerlitz D, Amr S, Dash C, Saleh DA, El Daly M, Abdel-Hamid M, El Kafrawy S, Hifnawy T, Ezzat S, Abdel-Aziz MA, Khaled H, Zheng YL, Mikhail N, Loffredo CA. Genetic polymorphisms in NQO1 and SOD2: interactions with smoking, schistosoma infection, and bladder cancer risk in Egypt. Urol Oncol. 2014; 32:47.e15–20. https://doi.org/10.1016/j.urolonc.2013.06.016 [PubMed]
- 21. Ergen HA, Narter F, Timirci O, Isbir T. Effects of manganase superoxide dismutase Ala-9Val polymorphism on prostate cancer: a case-control study. Anticancer Res. 2007; 27:1227–30. [PubMed]
- 22. Hung RJ, Boffetta P, Brennan P, Malaveille C, Gelatti U, Placidi D, Carta A, Hautefeuille A, Porru S. Genetic polymorphisms of MPO, COMT, MnSOD, NQO1, interactions with environmental exposures and bladder cancer risk. Carcinogenesis. 2004; 25:973–78. https://doi.org/10.1093/carcin/bgh080 [PubMed]
- 23. Cengiz M, Ozaydin A, Ozkilic AC, Dedekarginoglu G. The investigation of GSTT1, GSTM1 and SOD polymorphism in bladder cancer patients. Int Urol Nephrol. 2007; 39:1043–48. https://doi.org/10.1007/s11255-007-9179-9 [PubMed]
- 24. Egan KM, Thompson PA, Titus-Ernstoff L, Moore JH, Ambrosone CB. MnSOD polymorphism and breast cancer in a population-based case-control study. Cancer Lett. 2003; 199:27–33. https://doi.org/10.1016/S0304-3835(03)00349-5 [PubMed]
- 25. Lan Q, Mumford JL, Shen M, Demarini DM, Bonner MR, He X, Yeager M, Welch R, Chanock S, Tian L, Chapman RS, Zheng T, Keohavong P, et al. Oxidative damage-related genes AKR1C3 and OGG1 modulate risks for lung cancer due to exposure to PAH-rich coal combustion emissions. Carcinogenesis. 2004; 25:2177–81. https://doi.org/10.1093/carcin/bgh240 [PubMed]
- 26. Terry PD, Umbach DM, Taylor JA. No association between SOD2 or NQO1 genotypes and risk of bladder cancer. Cancer Epidemiol Biomarkers Prev. 2005; 14:753–54. https://doi.org/10.1158/1055-9965.EPI-04-0574 [PubMed]
- 27. Kucukgergin C, Sanli O, Amasyalı AS, Tefik T, Seckin S. Genetic variants of MnSOD and GPX1 and susceptibility to bladder cancer in a Turkish population. Med Oncol. 2012; 29:1928–34. https://doi.org/10.1007/s12032-011-0057-z [PubMed]
- 28. Reszka E, Jablonowski Z, Wieczorek E, Jablonska E, Krol MB, Gromadzinska J, Grzegorczyk A, Sosnowski M, Wasowicz W. Polymorphisms of NRF2 and NRF2 target genes in urinary bladder cancer patients. J Cancer Res Clin Oncol. 2014; 140:1723–31. https://doi.org/10.1007/s00432-014-1733-0 [PubMed]
- 29. Amr S, Dawson R, Saleh DA, Magder LS, St George DM, El-Daly M, Squibb K, Mikhail NN, Abdel-Hamid M, Khaled H, Loffredo CA. Pesticides, gene polymorphisms, and bladder cancer among Egyptian agricultural workers. Arch Environ Occup Health. 2015; 70:19–26. https://doi.org/10.1080/19338244.2013.853646 [PubMed]
- 30. Nikic P, Dragicevic D, Savic-Radojevic A, Pljesa-Ercegovac M, Coric V, Jovanovic D, Bumbasirevic U, Pekmezovic T, Simic T, Dzamic Z, Matic M. Association between GPX1 and SOD2 genetic polymorphisms and overall survival in patients with metastatic urothelial bladder cancer: a single-center study in Serbia. J BUON. 2018; 23:1130–35. [PubMed]
- 31. Woodson K, Tangrea JA, Lehman TA, Modali R, Taylor KM, Snyder K, Taylor PR, Virtamo J, Albanes D. Manganese superoxide dismutase (MnSOD) polymorphism, alpha-tocopherol supplementation and prostate cancer risk in the alpha-tocopherol, beta-carotene cancer prevention study (Finland). Cancer Causes Control. 2003; 14:513–18. https://doi.org/10.1023/A:1024840823328 [PubMed]
- 32. Choi JY, Neuhouser ML, Barnett M, Hudson M, Kristal AR, Thornquist M, King IB, Goodman GE, Ambrosone CB. Polymorphisms in oxidative stress-related genes are not associated with prostate cancer risk in heavy smokers. Cancer Epidemiol Biomarkers Prev. 2007; 16:1115–20. https://doi.org/10.1158/1055-9965.EPI-07-0040 [PubMed]
- 33. Arsova-Sarafinovska Z, Matevska N, Petrovski D, Banev S, Dzikova S, Georgiev V, Sikole A, Sayal A, Aydin A, Suturkova L, Dimovski AJ. Manganese superoxide dismutase (MnSOD) genetic polymorphism is associated with risk of early-onset prostate cancer. Cell Biochem Funct. 2008; 26:771–77. https://doi.org/10.1002/cbf.1504 [PubMed]
- 34. Cooper ML, Adami HO, Grönberg H, Wiklund F, Green FR, Rayman MP. Interaction between single nucleotide polymorphisms in selenoprotein P and mitochondrial superoxide dismutase determines prostate cancer risk. Cancer Res. 2008; 68:10171–77. https://doi.org/10.1158/0008-5472.CAN-08-1827 [PubMed]
- 35. Mikhak B, Hunter DJ, Spiegelman D, Platz EA, Wu K, Erdman JW
Jr , Giovannucci E. Manganese superoxide dismutase (MnSOD) gene polymorphism, interactions with carotenoid levels and prostate cancer risk. Carcinogenesis. 2008; 29:2335–40. https://doi.org/10.1093/carcin/bgn212 [PubMed] - 36. Iguchi T, Sugita S, Wang CY, Newman NB, Nakatani T, Haas GP. MnSOD genotype and prostate cancer risk as a function of NAT genotype and smoking status. In Vivo. 2009; 23:7–12. [PubMed]
- 37. Van Hemelrijck M, Rohrmann S, Steinbrecher A, Kaaks R, Teucher B, Linseisen J. Heterocyclic aromatic amine [HCA] intake and prostate cancer risk: effect modification by genetic variants. Nutr Cancer. 2012; 64:704–13. https://doi.org/10.1080/01635581.2012.678548 [PubMed]
- 38. Kucukgergin C, Sanli O, Tefik T, Aydın M, Ozcan F, Seckin S. Increased risk of advanced prostate cancer associated with MnSOD Ala-9-Val gene polymorphism. Mol Biol Rep. 2012; 39:193–98. https://doi.org/10.1007/s11033-011-0725-2 [PubMed]
- 39. Eken A, Erdem O, Arsova-Sarafinovska Z, Akay C, Sayal A, Matevska N, Suturkova L, Erten K, Ozgök Y, Dimovski A, Aydin A. Association between gene polymorphism of manganese superoxide dismutase and prostate cancer risk. J Biochem Mol Toxicol. 2013; 27:213–18. https://doi.org/10.1002/jbt.21472 [PubMed]
- 40. Oskina NA, Ermolenko NA, Boyarskih UA, Lazarev A, Petrova VD, Ganov DI, Tonacheva OG, Lifschitz GI, Filipenko ML. Associations between SNPs within antioxidant genes and the risk of prostate cancer in the Siberian region of Russia. Pathol Oncol Res. 2014; 20:635–40. https://doi.org/10.1007/s12253-014-9742-5 [PubMed]
- 41. Parlaktas BS, Atilgan D, Gencten Y, Benli I, Ozyurt H, Uluocak N, Erdemir F. A pilot study of the association of manganese superoxide dismutase and glutathione peroxidase 1 single gene polymorphisms with prostate cancer and serum prostate specific antigen levels. Arch Med Sci. 2015; 11:994–1000. [PubMed]
- 42. Kang D, Lee KM, Park SK, Berndt SI, Peters U, Reding D, Chatterjee N, Welch R, Chanock S, Huang WY, Hayes RB. Functional variant of manganese superoxide dismutase (SOD2 V16A) polymorphism is associated with prostate cancer risk in the prostate, lung, colorectal, and ovarian cancer study. Cancer Epidemiol Biomarkers Prev. 2007; 16:1581–86. https://doi.org/10.1158/1055-9965.EPI-07-0160 [PubMed]
- 43. Berto MD, Bica CG, de Sá GP, Barbisan F, Azzolin VF, Rogalski F, Duarte MM, da Cruz IB. The effect of superoxide anion and hydrogen peroxide imbalance on prostate cancer: an integrative in vivo and in vitro analysis. Med Oncol. 2015; 32:251. https://doi.org/10.1007/s12032-015-0700-1 [PubMed]
- 44. Atilgan D, Parlaktas BS, Uluocak N, Kolukcu E, Erdemir F, Ozyurt H, Erkorkmaz U. The Relationship between ALA16VAL Single Gene Polymorphism and Renal Cell Carcinoma. Adv Urol. 2014; 2014:932481. https://doi.org/10.1155/2014/932481 [PubMed]
- 45. Li H, Kantoff PW, Giovannucci E, Leitzmann MF, Gaziano JM, Stampfer MJ, Ma J. Manganese superoxide dismutase polymorphism, prediagnostic antioxidant status, and risk of clinical significant prostate cancer. Cancer Res. 2005; 65:2498–504. https://doi.org/10.1158/0008-5472.CAN-04-3535 [PubMed]
- 46. Lee HY, Kim DK, Doo SW, Yang WJ, Song YS, Lee B, Kim JH. Time Trends for Prostate Cancer Incidence from 2003 to 2013 in South Korea: An Age-Period-Cohort Analysis. Cancer Res Treat. 2020; 52:301–308. https://doi.org/10.4143/crt.2019.194 [PubMed]
- 47. Zelko IN, Mariani TJ, Folz RJ. Superoxide dismutase multigene family: a comparison of the CuZn-SOD (SOD1), Mn-SOD (SOD2), and EC-SOD (SOD3) gene structures, evolution, and expression. Free Radic Biol Med. 2002; 33:337–49. https://doi.org/10.1016/S0891-5849(02)00905-X [PubMed]
- 48. Lebovitz RM, Zhang H, Vogel H, Cartwright J
Jr , Dionne L, Lu N, Huang S, Matzuk MM. Neurodegeneration, myocardial injury, and perinatal death in mitochondrial superoxide dismutase-deficient mice. Proc Natl Acad Sci USA. 1996; 93:9782–87. https://doi.org/10.1073/pnas.93.18.9782 [PubMed] - 49. Flynn JM, Melov S. SOD2 in mitochondrial dysfunction and neurodegeneration. Free Radic Biol Med. 2013; 62:4–12. https://doi.org/10.1016/j.freeradbiomed.2013.05.027 [PubMed]
- 50. Zhang Y, Zhao W, Zhang HJ, Domann FE, Oberley LW. Overexpression of copper zinc superoxide dismutase suppresses human glioma cell growth. Cancer Res. 2002; 62:1205–12. [PubMed]
- 51. Zhong W, Oberley LW, Oberley TD, St Clair DK. Suppression of the malignant phenotype of human glioma cells by overexpression of manganese superoxide dismutase. Oncogene. 1997; 14:481–90. https://doi.org/10.1038/sj.onc.1200852 [PubMed]
- 52. Oberley LW, Buettner GR. Role of superoxide dismutase in cancer: a review. Cancer Res. 1979; 39:1141–49. [PubMed]
- 53. Ekoue DN, He C, Diamond AM, Bonini MG. Manganese superoxide dismutase and glutathione peroxidase-1 contribute to the rise and fall of mitochondrial reactive oxygen species which drive oncogenesis. Biochim Biophys Acta Bioenerg. 2017; 1858:628–32. https://doi.org/10.1016/j.bbabio.2017.01.006 [PubMed]
- 54. Bag A, Bag N. Target sequence polymorphism of human manganese superoxide dismutase gene and its association with cancer risk: a review. Cancer Epidemiol Biomarkers Prev. 2008; 17:3298–305. https://doi.org/10.1158/1055-9965.EPI-08-0235 [PubMed]
- 55. Wang P, Zhu Y, Xi S, Li S, Zhang Y. Association between MnSOD Val16Ala Polymorphism and Cancer Risk: Evidence from 33,098 Cases and 37,831 Controls. Dis Markers. 2018; 2018:3061974. https://doi.org/10.1155/2018/3061974 [PubMed]
- 56. Li M, Huang L, Qiu H, Fu Q, Li W, Yu Q, Sun L, Zhang L, Hu G, Hu J, Yuan X. Helicobacter pylori infection synergizes with three inflammation-related genetic variants in the GWASs to increase risk of gastric cancer in a Chinese population. PLoS One. 2013; 8:e74976. https://doi.org/10.1371/journal.pone.0074976 [PubMed]