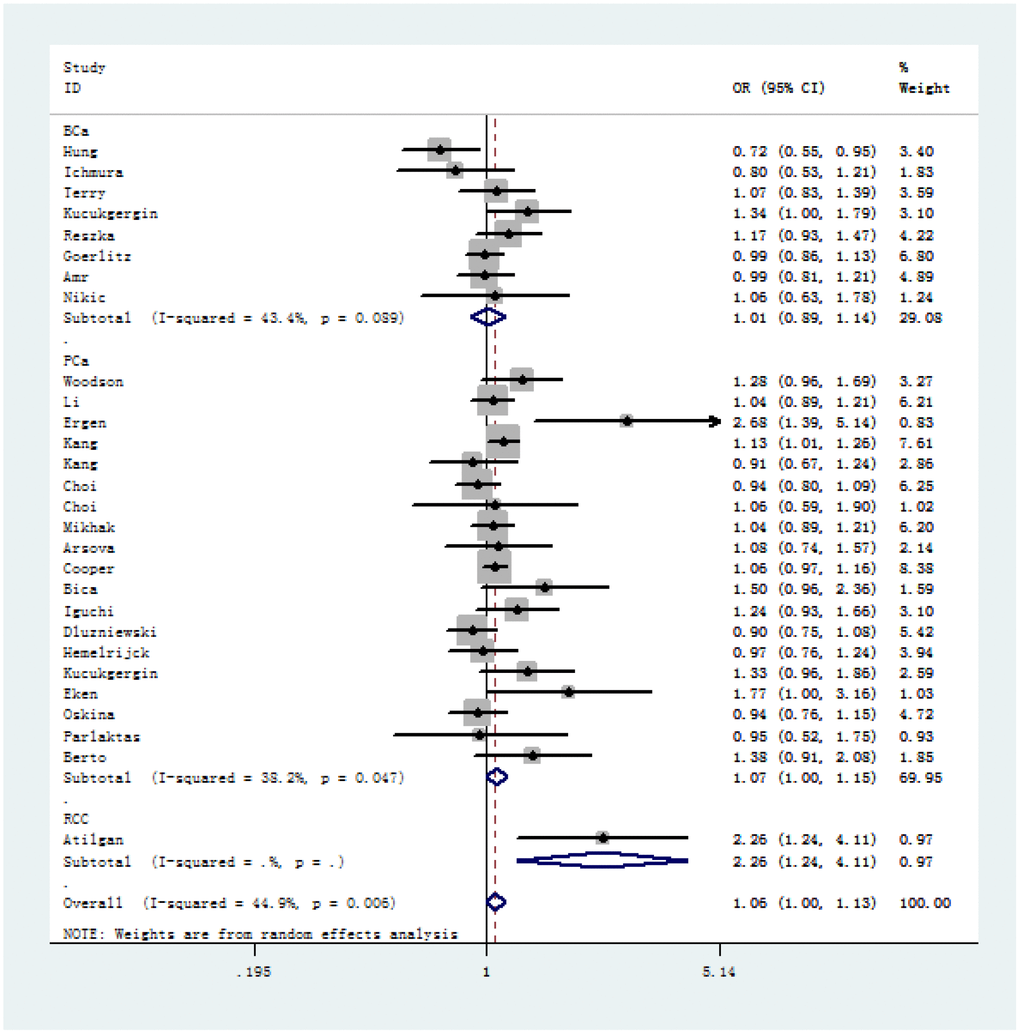
Figure 2.Forest plot of cancer susceptibility correlated with SOD2 rs4880 V16A polymorphism (allelic comparison of A-allele vs. V-allele, random-effects) in stratified analysis by the type of cancer.
Figure 2 — Association between SOD2 V16A variant and urological cancer risk | Aging