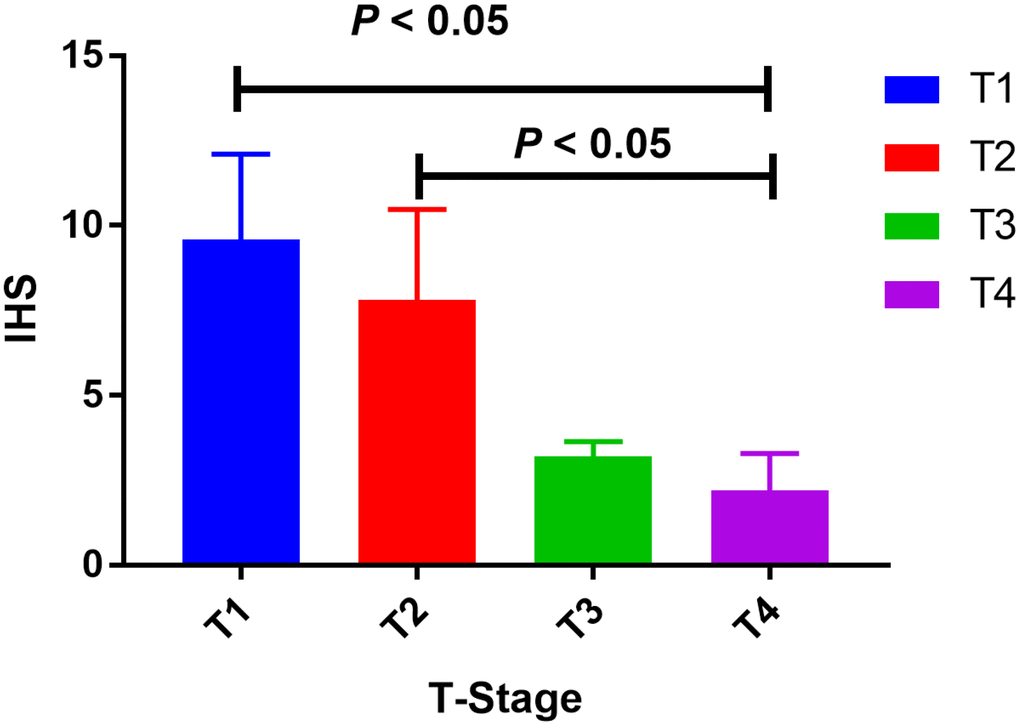
Figure 5.Tissue expression of SOD2 among PCa subjects. The expression of SOD2 was down-regulated in more advanced PCa, as compared to less advanced PCa subjects (T4 versus T1, P < 0.05; T4 versus T2, P < 0.05).
Figure 5 — Association between SOD2 V16A variant and urological cancer risk | Aging