Submit an Article
Navigate
Home
Editorial Board
Editorial Policies
Current Volume
Archive
Scientific Integrity
Publication Ethics Statements
Interviews with Outstanding Authors
Newsroom
Sponsored Conferences
Podcast
Contact
Special Collections
Submit an Article
Online ISSN: 1945-4589
Research Paper
|
Volume 12, Issue 1
|
pp. 825–843
Association between SOD2 V16A variant and urological cancer risk
Back to article
Figure 3
(3 of 13)
−
100%
+
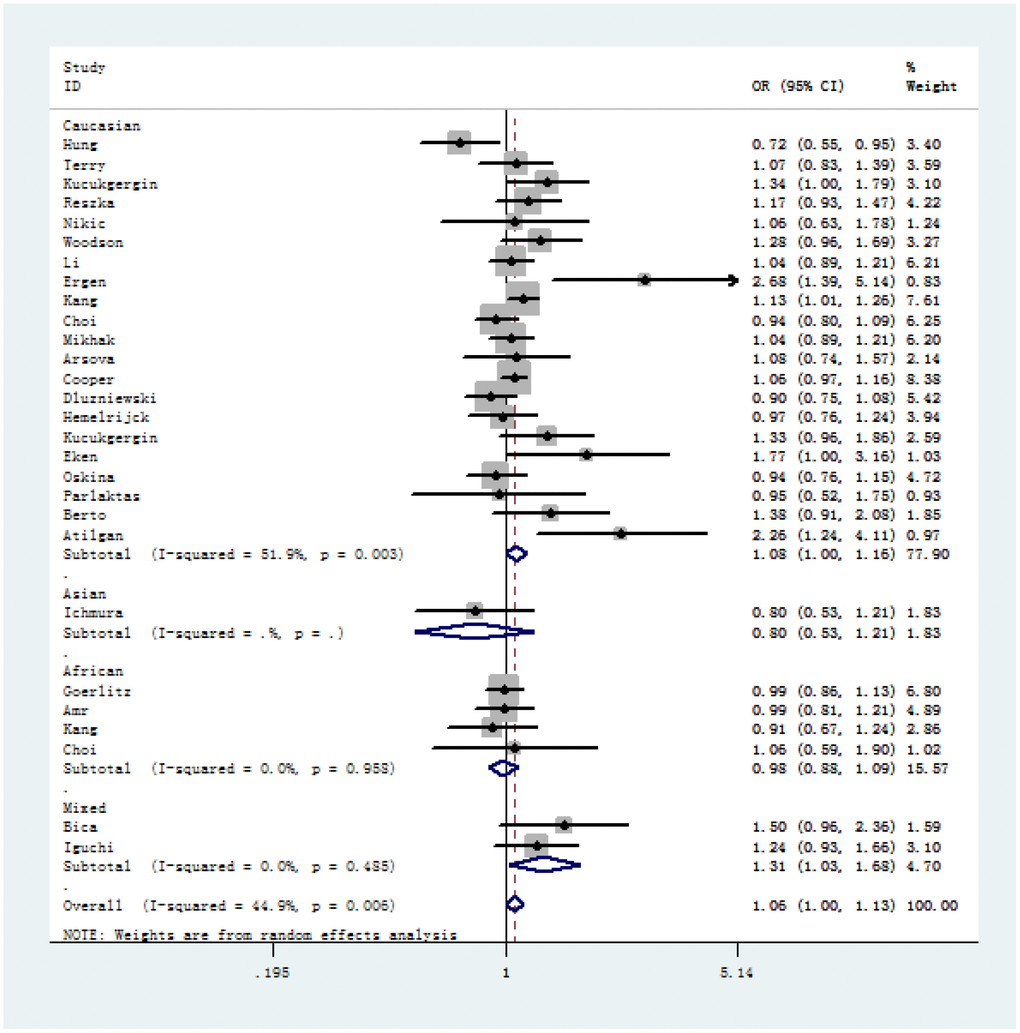
Figure 3.
Forest plot of A-allele versus V-allele genetic model of SOD2 rs4880 V16A polymorphism in stratified analysis by ethnicity (random-effects).
Figure 3 — Association between SOD2 V16A variant and urological cancer risk | Aging