


Introduction
Stroke, which kills more than 2 million people every year in China, is the second leading cause of death [1]. According to the different causes, stroke can be divided into several subtypes, including transient ischemic attack (TIA), cerebral infarction and hemorrhage [2]. Most strokes are caused by ischemic stroke (IS) and cerebral embolism, but not every patient has symptoms. Some patients have transient symptoms due to TIA [3]. Previous studies have shown that there are many major risk factors for cerebral ischemic infarction, including hypertension, diabetes, early family history, and other atherosclerosis-related diseases, such as hyperlipidemia [4]. According to the latest epidemiological studies, approximately 10 to 15% of strokes occur in young people aged 18 to 49 [5]. Therefore, a detailed understanding of the pathogenesis of ischemic stroke can provide a detailed theoretical basis for treatment.
In recent years, with the continuous improvement of research technology, there is a new understanding of the relationship between epigenetics and disease, and DNA methylation is a very important field in epigenetics research [6]. DNA methylation usually occurs on CpG islands, mostly in the proximal promoter region of the human genome [7]. DNA methylation alters an individual’s biological function by regulating gene expression or genome sequence stability [8]. It can keep transcription factors out of two gene promoters, inhibit transcription factor binding and change chromatin structures. Gene promoters might be available to vital cis-acting regulatory elements that initiate and control gene expression [9]. Methylation usually occurs rapidly and can usually be observed before the onset of disease. This important finding indicates that DNA methylation can also be used as an indicator of early screening for early or potential diseases [10].
At present, some studies have confirmed that abnormal methylation of gene promoters is associated with IS [11]. To classify new IS-related DNA methylation sites, we incorporated several microarray datasets from the Gene Expression Omnibus (GEO) repository and carried out analysis as well as validation to analyze the probable DNA methylation–mRNA expression–IS regulatory impact.
Results
Data preprocessing and identified DMPs
First, we determined DNA methylation levels at 485578 methylation sites in carotid plaques in GSE66500. After quality control and screening, 20019 methylation positions were subjected to differential analysis. In total, 1290 DMPs (|Δβ| > 0.05 and detection P < 0.05), including 608 hypermethylated and 682 hypomethylated DMPs, were recognized. As per the annotation, 870 DMPs were actually found within 693 unique genes (DMGs). The heatmap and volcano plot of the DMPs are presented in Figure 1. The details of these 870 DMPs can be found in Supplementary Table 1.
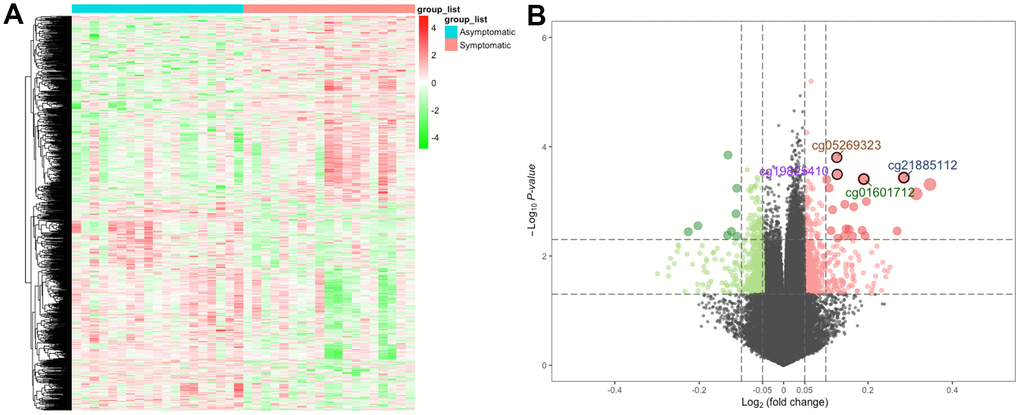
Figure 1. The heatmap and volcano plot for DMPs. (A) For the heatmap, the red strip represents symptomatic samples and the green strip represents asymptomatic samples. (B) For the volcano plot, the two vertical lines are the 0.05-fold change boundaries, and the horizontal line is the statistical significance boundary (P < 0.05). Items with statistical significance as well as hypermethylation are presented as red dots, and hypomethylation is presented as green dots in the volcano plot.
Subsequently, to recognize a set of CpGs that may differentiate symptomatic from asymptomatic patients, depending on the differentially methylated CpGs, we implemented shrunken centroid classifier analysis and found 4 hypermethylated CpGs in symptomatic patients (cg01601712, cg05269323, cg19825410 and cg21885112) that best discriminated between patients with and without symptoms (Figure 2A). These four differentially methylated loci correspond to three genes in the genome. The details can be found in Table 1. Then, we analyzed these four hypermethylated CpG sites and found that there were significant differences between them (P < 0.01–0.001) (Figure 2B). The methylation of these four differentially methylated CpG sites in the dataset is shown in Figure 2C. The proportion of differentially methylated CpG sites in the whole genome and the proportion of CpG island distribution of promoter differentially methylated CpG sites are displayed in Figure 2D.
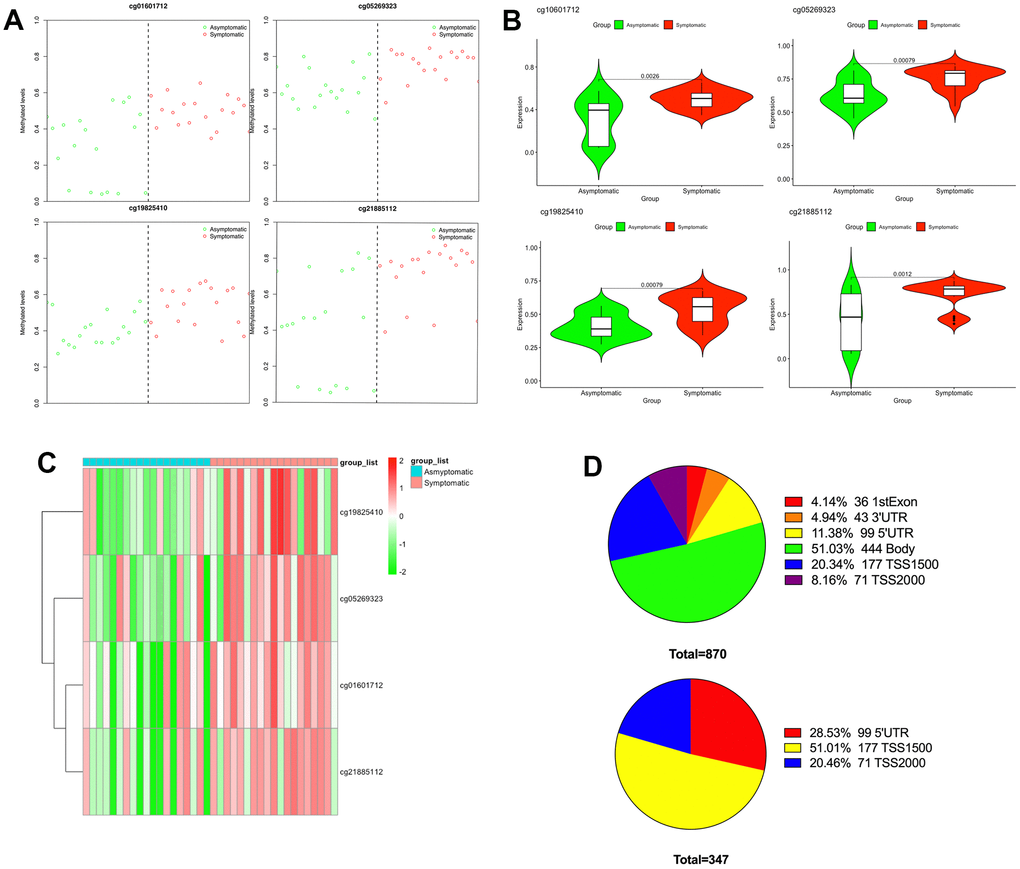
Figure 2. Differential methylation between symptomatic and asymptomatic samples. (A) Methylation levels of the 4 CpGs in asymptomatic (green circle) as well as symptomatic (red circle) samples from the GEO; (B) The differences in methylation levels of the 4 CpGs in asymptomatic and symptomatic patients; (C) Heat map indicating methylation of the 4 CpGs in asymptomatic and symptomatic patients; (D) Promoter region distribution of differentially methylated promoter CpG sites.
Table 1. The details for DMPs.
| SYMBOL | CpG site | MAPINFO | CHR | Δβ | P values | ||||||||||||||||||||||||||||||||||||||||||||||||||||||||||||||||||||||||||||||||||||||||||||||
| HLA-DQB1 | cg01601712 | 32635948 | 6 | 1.90E-01 | 3.91E-04 | ||||||||||||||||||||||||||||||||||||||||||||||||||||||||||||||||||||||||||||||||||||||||||||||
| REPIN1 | cg05269323 | 150067712 | 7 | 1.26E-01 | 1.57E-04 | ||||||||||||||||||||||||||||||||||||||||||||||||||||||||||||||||||||||||||||||||||||||||||||||
| - | cg19825410 | 106092151 | 14 | 1.27E-01 | 3.21E-04 | ||||||||||||||||||||||||||||||||||||||||||||||||||||||||||||||||||||||||||||||||||||||||||||||
| HLA-DRB1 | cg21885112 | 32557970 | 6 | 2.85E-01 | 3.68E-04 | ||||||||||||||||||||||||||||||||||||||||||||||||||||||||||||||||||||||||||||||||||||||||||||||
| CHR: chromosome; Δβ: difference of methylation between symptomatic patients and asymptomatic controls; DMP: differential methylation position; MAPINFO: position in Build 37. | |||||||||||||||||||||||||||||||||||||||||||||||||||||||||||||||||||||||||||||||||||||||||||||||||||
The chromosome distribution of differentially methylated intergenic CpGs is shown in Figure 3. Regions in red are hypermethylated regions, and regions in green are hypomethylated regions.
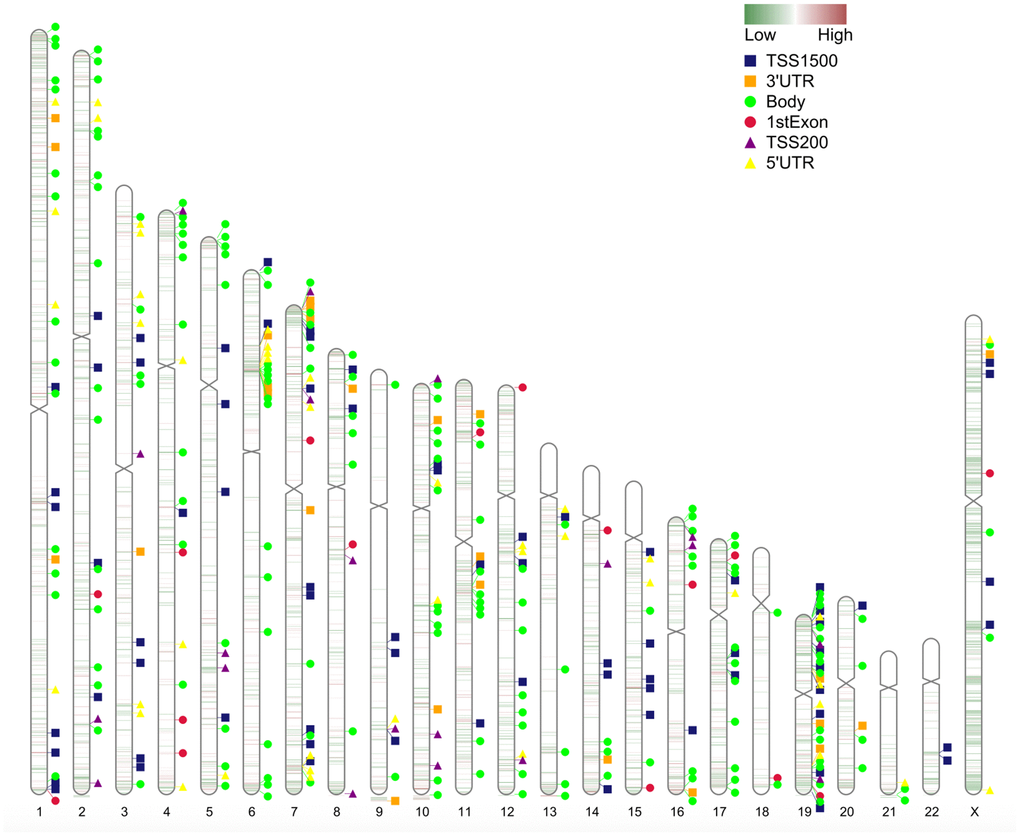
Figure 3. Chromosome distribution of differentially methylated intergenic CpGs. The plot presents the distribution of differential intergenic CpG sites at 22 autosomes and the X chromosome. Regions in red are hypermethylated regions, and regions in green are hypomethylated regions. The value is the logFC of the M value among asymptomatic and symptomatic patients.
Functional enrichment analysis for DMGs
As shown in Figure 4, the most important items in the development of IS and all of the detailed information can be found in Supplementary Table 2. In the analysis of GO functions, 50 biological processes, 58 cellular components as well as 46 molecular functions were recognized with adjusted-P < 0.05. Approximately 18 pathways were enriched in the KEGG pathway analysis, and none of the DO items were analyzed for the screened DMGs with adjusted-P < 0.05. However, if the threshold value was set at P < 0.05, we could include 39 DO items for further analysis.
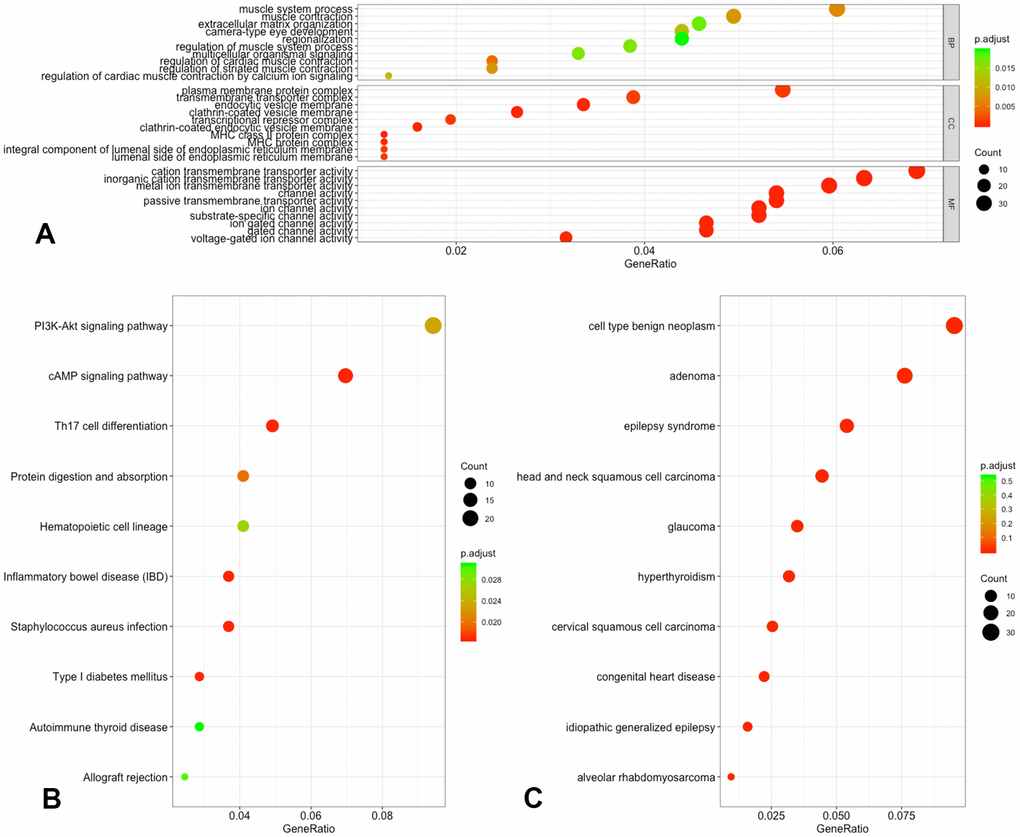
Figure 4. Functional annotation of DMGs. (A) GO analysis of DMGs; (B) KEGG analysis of DMGs; (C) DO analysis of DMGs.
Among these terms, GO:0035637 multicellular organismal signaling, GO:0007265 Ras protein signal transduction, hsa04659 Th17 cell differentiation, hsa05321 Inflammatory bowel disease (IBD), hsa04024 cAMP signaling cascade, hsa04151 PI3K-Akt signaling cascade and hsa05320 Autoimmune thyroid disease were confirmed in previous references to be associated with IS, and the genes associated with these terms were chosen for additional evaluation.
PPI network construction and submodule analysis
Data analysis was done on the STRING database, which revealed 1463 protein pairs and 552 nodes with a combined score > 0.9. Figure 5A shows the network analysis in Cytoscape software. When detected by the MCODE app, three modules with a score > 7 were identified and are represented in Figure 5B–5D. After synthesizing the data of GO, DO, and KEGG analyses, we selected 2 DMGs (HLA-DRB1 and HLA-DQB1) as hub genes correlated to the onset of IS with a high degree and included them in the submodule analysis at the same time.
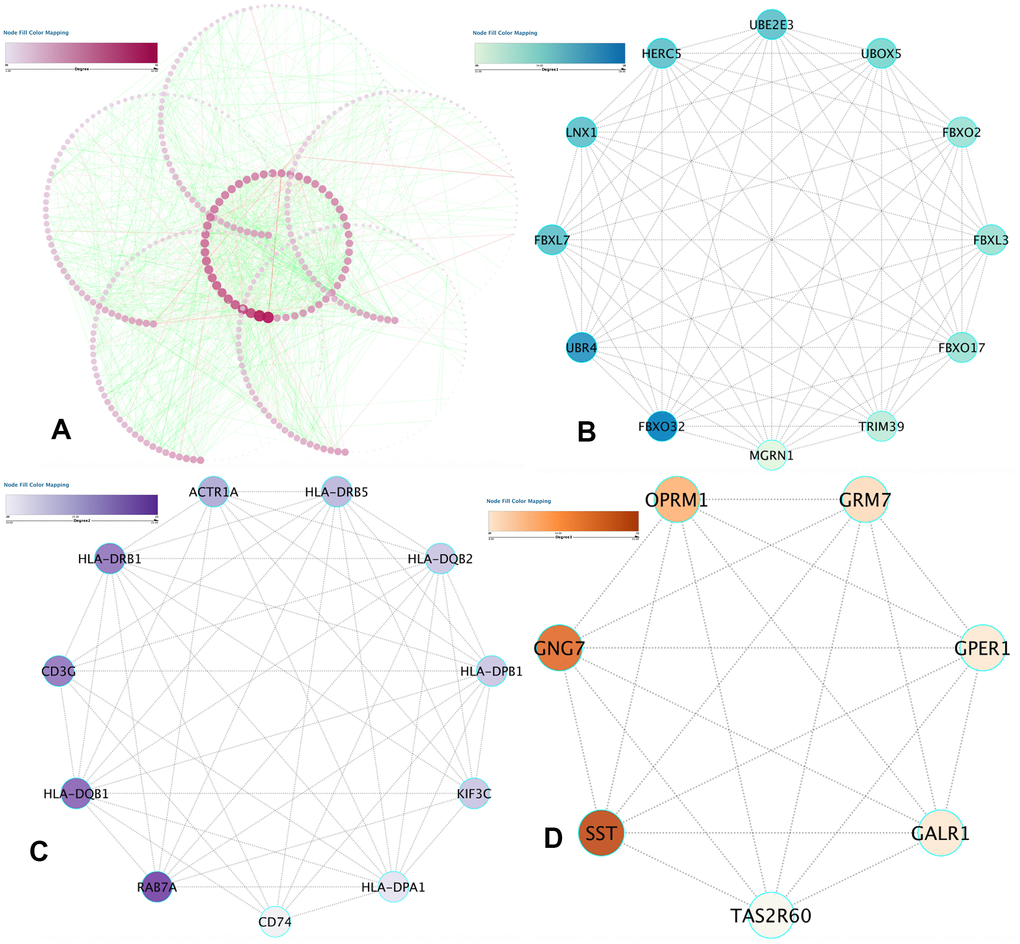
Figure 5. PPI network construction and hub item identification. (A) PPI network of the selected DMGs. Edges stand for the interaction between two genes. The significant modules recognized in the PPI network by the molecular complex detection technique with a score of > 7.0. (B) Molecular-1 with MCODE = 12; (C) Molecular-2 with MCODE = 9.8; (D) Molecular-3 with MCODE = 7.6. A degree was utilized to explain the prominence of protein nodes in the network; dark colors show a high degree, and light colors present a low degree.
Hub gene validation
First, we validated these two genes in different microarray datasets. As shown in Figure 6, differences between the two genes were found only in GSE16561 but not in other datasets. The expression of HLA-DRB1 and HLA-DQB1 was lesser in stroke patients than in normal controls (P < 0.05).
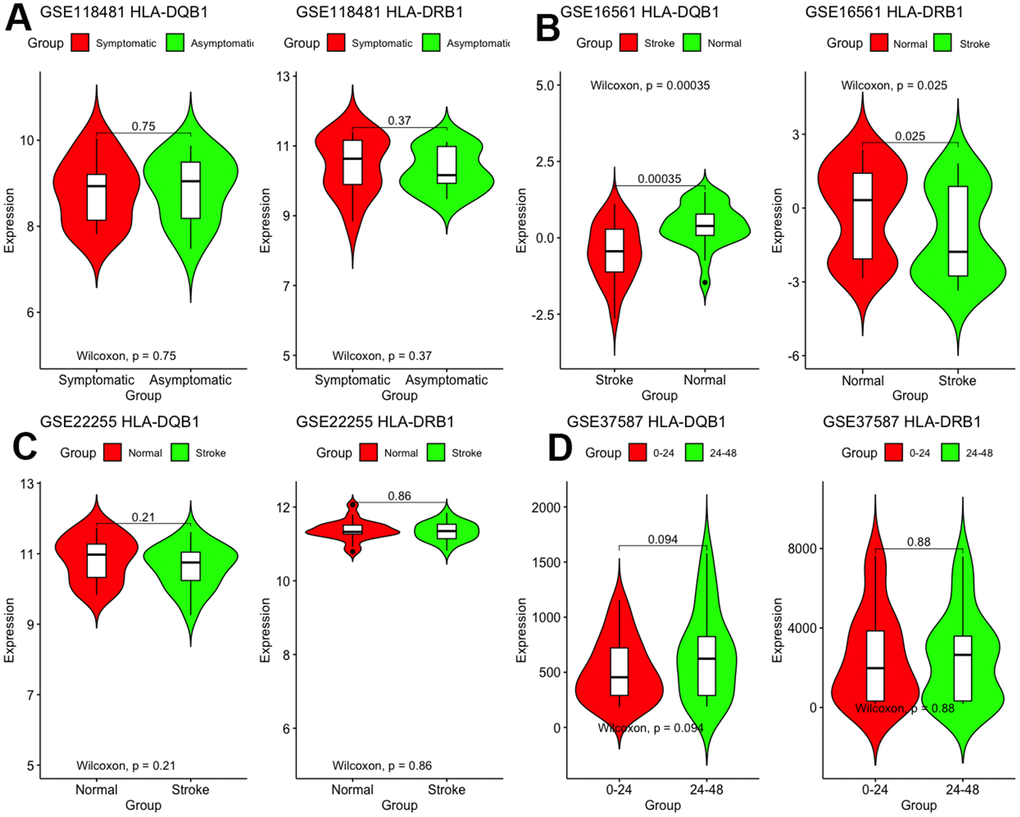
Figure 6. Validation of mRNA expression of interest in different datasets.
Then, we implemented a correlation analysis to distinguish if DNA methylation caused IS through regulation of gene expression. Generally, the increase in DNA methylation affects the binding of transcription factors, leading to abnormal gene transcription, usually inhibiting transcription and resulting in the downregulation of gene expression. However, it was not absolute. In any case, changes in methylation can cause changes in gene expression.
With these conditions, we selected these 2 significantly correlated methylation–mRNA pairs for testing a total of 322 samples (161 healthy control and 161 IS). The 322 validation samples were coordinated for age and sex. The weight, BMI, waist circumference, smoking status, serum TC and LDL-C levels were higher in IS patients compare to controls (Table 2). Initially, we examined the methylation of these 2 genes in two samples and established that all of them showed increased hypermethylation compared with that in the IS group (Figure 7C–7D). Next, we found that the relative expression of these two genes was lower in stroke samples (Figure 7A–7B). This result also coincided with GSE16561. Then, we implemented correlation analysis among DNA methylation and gene expression in the similar samples and established that HLA-DRB1 and HLA-DQB1 gene methylation levels were negatively associated with their expression (Figure 8). This result indirectly confirmed that modifications in the methylation of the promoter region of HLA-DRB1 and HLA-DQB1 caused atypical gene expression, causing the beginning of IS.
Table 2. Comparison of demographics, lifestyle characteristics and serum lipid levels between the normal and IS groups.
| Parameter | Control | IS | test-statistic | P | |||||||||||||||||||||||||||||||||||||||||||||||||||||||||||||||||||||||||||||||||||||||||||||||
| Number | 161 | 161 | |||||||||||||||||||||||||||||||||||||||||||||||||||||||||||||||||||||||||||||||||||||||||||||||||
| Male/female | 49/112 | 51/110 | 0.058 | 0.810 | |||||||||||||||||||||||||||||||||||||||||||||||||||||||||||||||||||||||||||||||||||||||||||||||
| Age (years)1 | 58.21±9.45 | 58.88±9.23 | 0.824 | 0.406 | |||||||||||||||||||||||||||||||||||||||||||||||||||||||||||||||||||||||||||||||||||||||||||||||
| Height (cm) | 156.13±6.92 | 155.58±7.12 | 1.594 | 0.222 | |||||||||||||||||||||||||||||||||||||||||||||||||||||||||||||||||||||||||||||||||||||||||||||||
| Weight (kg) | 51.94±7.22 | 60.73±11.44 | 18.439 | 1.23E-005 | |||||||||||||||||||||||||||||||||||||||||||||||||||||||||||||||||||||||||||||||||||||||||||||||
| Body mass index (kg/m2) | 28.21±3.08 | 31.43±6.17 | 28.204 | 2.52E-008 | |||||||||||||||||||||||||||||||||||||||||||||||||||||||||||||||||||||||||||||||||||||||||||||||
| Waist circumference (cm) | 71.41±6.53 | 88.01±9.96 | 22.122 | 6.17E-005 | |||||||||||||||||||||||||||||||||||||||||||||||||||||||||||||||||||||||||||||||||||||||||||||||
| Smoking status [n (%)] | 42(26.3) | 57(35.8) | 3.282 | 0.070 | |||||||||||||||||||||||||||||||||||||||||||||||||||||||||||||||||||||||||||||||||||||||||||||||
| Alcohol consumption [n (%)] | 39(24.3) | 41(25.8) | 0.067 | 0.796 | |||||||||||||||||||||||||||||||||||||||||||||||||||||||||||||||||||||||||||||||||||||||||||||||
| Systolic blood pressure (mmHg) | 127.43±15.13 | 129.47±22.18 | 4.533 | 0.023 | |||||||||||||||||||||||||||||||||||||||||||||||||||||||||||||||||||||||||||||||||||||||||||||||
| Diastolic blood pressure (mmHg) | 80.51±10.21 | 83.24±14.13 | 5.223 | 0.015 | |||||||||||||||||||||||||||||||||||||||||||||||||||||||||||||||||||||||||||||||||||||||||||||||
| Pulse pressure (mmHg) | 49.67±12.13 | 50.27±13.24 | 1.452 | 0.263 | |||||||||||||||||||||||||||||||||||||||||||||||||||||||||||||||||||||||||||||||||||||||||||||||
| Glucose (mmol/L) | 5.84±1.53 | 5.92±2.73 | 2.783 | 0.137 | |||||||||||||||||||||||||||||||||||||||||||||||||||||||||||||||||||||||||||||||||||||||||||||||
| Total cholesterol (mmol/L) | 4.94±1.13 | 5.38±1.26 | 7.333 | 0.010 | |||||||||||||||||||||||||||||||||||||||||||||||||||||||||||||||||||||||||||||||||||||||||||||||
| Triglyceride (mmol/L)2 | 1.49(0.51) | 1.53(1.22) | 2.137 | 0.187 | |||||||||||||||||||||||||||||||||||||||||||||||||||||||||||||||||||||||||||||||||||||||||||||||
| HDL-C (mmol/L) | 1.56±0.43 | 1.21±0.38 | 7.137 | 0.011 | |||||||||||||||||||||||||||||||||||||||||||||||||||||||||||||||||||||||||||||||||||||||||||||||
| LDL-C (mmol/L) | 2.96±0.81 | 3.73±1.92 | 11.228 | 3.53E-004 | |||||||||||||||||||||||||||||||||||||||||||||||||||||||||||||||||||||||||||||||||||||||||||||||
| ApoA1 (g/L) | 1.22±0.21 | 1.13±0.24 | 0.382 | 0.509 | |||||||||||||||||||||||||||||||||||||||||||||||||||||||||||||||||||||||||||||||||||||||||||||||
| ApoB (g/L) | 0.84±0.19 | 0.93±0.30 | 1.568 | 0.223 | |||||||||||||||||||||||||||||||||||||||||||||||||||||||||||||||||||||||||||||||||||||||||||||||
| ApoA1/ApoB | 1.68±0.51 | 1.65±0.53 | 0.088 | 0.722 | |||||||||||||||||||||||||||||||||||||||||||||||||||||||||||||||||||||||||||||||||||||||||||||||
| IS, ischemic stroke; HDL-C, high-density lipoprotein cholesterol; LDL-C, low-density lipoprotein cholesterol; Apo, Apolipoprotein. 1Mean ± SD determined by t-test. 2Because of nonnormally distribution, the triglyceride value was presented as median (interquartile range), and the difference between the two groups was determined by the Wilcoxon-Mann-Whitney test. | |||||||||||||||||||||||||||||||||||||||||||||||||||||||||||||||||||||||||||||||||||||||||||||||||||
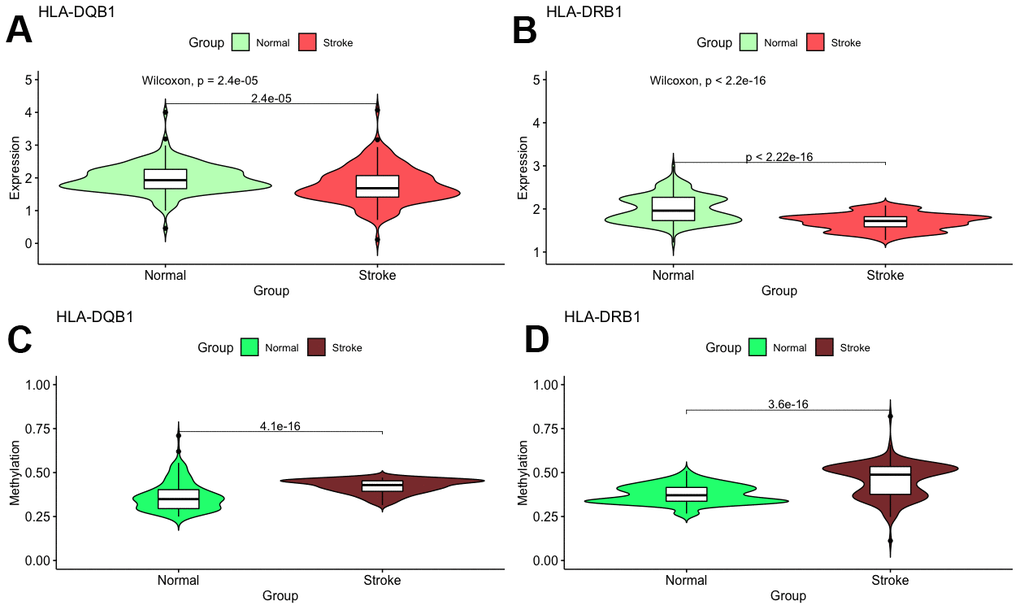
Figure 7. Validation of mRNA expression as well as DNA methylation of interest between IS and healthy samples.
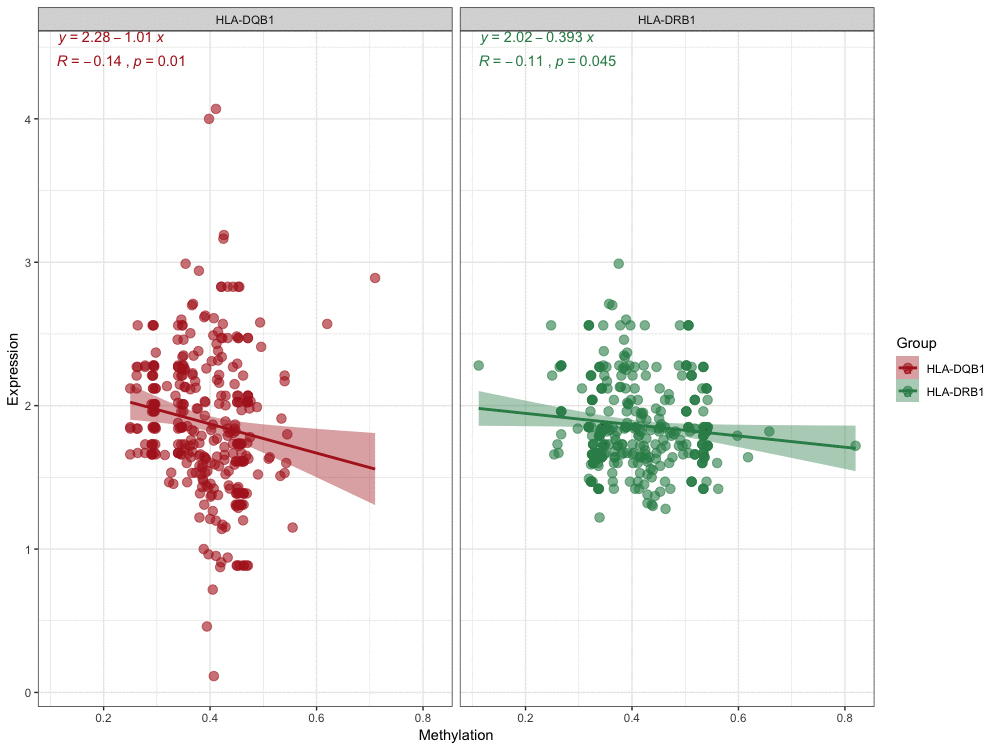
Figure 8. Correlation analyses for DNA methylation and mRNA expression.
Discussion
Ischemic stroke (IS) is a complicated disorder with great mortality as well as long-term disability outcomes. In spite of many concerns about stroke risk factors as well as prophylactic treatment, the number of stroke cases has been increasing recently, probably due to the increasing age of the population [12]. The pathogenesis of stroke involves many different disease processes and interactions between the central nervous system and environmental, systemic, genetic and vascular factors. Approximately 80% of strokes were ischemic, and the other 20% were hemorrhagic. At present, our studies focused on IS and its most usual subtypes: cardiac aortic embolism (CE), arteriolar disease (SAD) and arteriosclerosis (LAA) [13]. A large body of evidence from twin, family, and animal model studies [14] suggested that genetic risk components are connected with stroke; additionally, latest genome-wide association reports have found novel variants related to IS along with IS subtype-specific genetic variations [15]. These genetic factors can lead to traditional risk factors, for example homocysteine concentrations (with recognized genetic components) or diabetes, and hypertension might interrelate with environmental factors, such as smoking and drinking, or lead to intermediary phenotypes, such as atherosclerosis. Epidemiological data have offered several lines of proof for a genetic component of the disease, but with limited awareness of its incidence and characteristics. Hence, it was necessary to uncover novel biomarkers for stroke risk. Moreover, the participation of epigenetics was still mostly unidentified.
Epigenetics is receiving increasing attention as it might contribute to the research of complex diseases and might also produce valuable biomarkers. Epigenetic mechanisms, for example DNA methylation, control higher-order DNA structure as well as gene expression. In recent years, with the continuous development of technology, the correlation between genome-wide methylation and IS has gradually been confirmed [16]. Shen et al. found that methylation of MTRNR2L8 was a diagnostic biomarker for stroke and may also be a potential therapeutic target [17]. Fujii et al. found that eating a large amount of vegetables every day can reduce the methylation of the ABCA1 gene and promote the reverse flow of cholesterol, weakening the trend of atherosclerosis. Interestingly, the study was validated only in women [18].
HLA, which is defined as the human major histocompatibility complex, functions as an essential element of the immune system. The major HLA antigens are HLA-A, HLA-B, HLA-C, HLA-DR, HLA-DP, and HLA-DQ. HLA molecules have an imperative role in the transplantation reaction and immune response to various immunogens as well as infections [19]. In addition, there was evidence that HLA was associated with ischemic disease, atherosclerosis and cancer [20]. Murali et al had found that HLA-DRB1*/DQB1* alleles and haplotypes strongly predispose South Indian population to ischemic stroke. But large sample size or the meta-analysis are needed to explain the exact mechanism of associations of HLA gene(s) with IS [21]. Moreover, the HLA complex gene was a genetic risk factor for idiopathic ischemic stroke in children, suggesting that HLA molecules were involved in ischemic stroke [22]. HLA-DRB1 and HLA-DQB1 belong to the HLA class II beta chain paralogs. These class II molecules form a heterodimer comprising of an alpha and a beta chain, both attached in the membrane. It has a vital function in the immune system by presenting peptides resulting from extracellular proteins. Recently, more and more studies have supported that atherosclerosis as a chronic inflammatory disease, and its inflammatory response was related to immune system dysfunction. When inflammation occurred, vascular endothelium was damaged, and a large number of macrophages engulfed lipids and contributed to the formation of arterial plaques. HLA-DRB1 and HLA-DQB1 genes have been proved to play an important role in the process of immune inflammation. Changed in their expression levels may eventually resulted in inflammation of intracranial arteries, leading to IS. Previous studies have confirmed that these two genes are clearly associated with IS [23, 24].
We used other datasets for verification and found that these two genes were significantly expressed at low levels in the IS population. Interestingly, we validated this conclusion in only one dataset, and there was no difference in the relative expression of these two genes within 24 hours and 24–48 hours after symptom onset. The reason for this was related to the small sample size of the dataset. Therefore, we found IS patients and healthy people in order to extract peripheral blood and at the same time, to verify the methylation and relative expression of the promoter regions of these two genes. We found that when the methylation of the promoter region increased, the gene expression decreased significantly, and methylation and expression were clearly correlated. The above conclusions are consistent with previous research results.
We have to admit the limitations of this study. First, the validation sample is small, and patients in this study are from two hospitals; hence, there may be differences with patients from diverse areas and of different races. Second, the precise mechanism of the (DNA methylation)–mediator (mRNA)–outcome (IS) network for controlling the pathological processes of IS has not been abundantly confirmed in vivo or in vitro.
In brief, we acquired the GSE66500 dataset from GEO and identified DMPs and genes. We chose 2 DMGs for validation in additional datasets and acquired 322 samples (161 IS patients and 161 healthy controls). HLA-DRB1 and HLA-DQB1 were found to exhibit hypermethylation and downregulated gene expression in IS patients. In addition, correlation analysis revealed that DNA methylation instigated IS through the regulation of gene expression.
Materials and Methods
Gene expression omnibus database
GSE66500 [25] was retrieved from the GPL13534 Illumina Infinium HumanMethylation 450 BeadChip for Genome-wide DNA methylation analysis. This dataset consisted of 19 asymptomatic and 19 symptomatic patients, and the sample source was carotid plaque. All data processing and differential methylation positions (DMPs) were identified in GEO2R. Moreover, CpG sites on the sex chromosomes were eliminated to prevent sex-specific methylation bias. DMPs positioned in the gene region were allocated to the analogous genes that were defined as differentially methylated genes (DMGs). The threshold was set at |log2 fold-change| (Δβ) > 0.05 and P < 0.05. GSE118481, GSE16561 [26], GSE22255 [27] and GSE37587 [28] were also acquired from the GEO database and utilized as the validation sample. From these datasets, the functions of hub genes were verified from different dimensions. We employed the Affy package in R [29] to transform CEL files into an expression value matrix and RMA methods to normalize the matrix. Subsequently, we converted the probe data to gene with the Bioconductor package in R software [30]. If a gene corresponded to several probes, we chose the mean expression value for further analysis.
Functional enrichment analysis
We compared obese subjects with controls to explore the differentially expressed genes (DEGs) with the limma package in R [10]. The threshold values were set at |log2 fold-change| ≥ 2 and P < 0.05. Then, we used GEO2R to identify the differentially methylated positions (DMPs) by comparing the normal and obese subjects. DMPs positioned in the gene region were allocated to the analogous genes that were defined as differentially methylated genes (DMGs). The threshold was set at |log2 fold-change| (Δβ) > 0.05 and P < 0.05. Subsequently, we matched DEGs to DMGs, and simply the matched genes (DEMGs) were chosen for additional examination.
Functional enrichment analysis
Analyses on large-scale transcription data or genomic data were generally done depending on functional enrichment analyses. These include disease ontology (DO), Kyoto Encyclopedia of Genes and Genomes (KEGG) pathway as well as gene ontology (GO) analyses. In the current study, we used clusterProfiler [31] along with the DOSE [32] package in R to analyze DMGs. The threshold for the analysis was set at adjust-P < 0.05 along with false discovery rate (FDR) < 0.05. To further determine the location of hub sites in the dataset, shrunken centroid classifier analysis was performed with the “pamr” package in R [33].
Protein-protein interaction (PPI) network creation as well as module analysis
The protein prediction as well as experimental interactions was examined by the STRING database (version 11) [34]. Gene fusion, co-expression experimentations, databases, text mining, neighborhoods as well as co-occurrence are the usual prediction approaches for the database. Additionally, a combined fraction was utilized to demonstrate the interaction of proteins. In the current study, DMGs were mapped to PPIs, and a combined score > 0.9 was considered as the cutoff value [35] to evaluate main genes in the network. Degrees were used as a vital way to present the role of protein nodes. Network modules are one of the mainstays of protein networks and might have precise biological impacts. The Molecular Complex Detection (MCODE) of the Cytoscape software (version 3.71) [36] was utilized to recognize the main clustering modules as well as the most prominent clustering modules. After that, we selected EASE ≤ 0.05 and count ≥ 2 for the cutoff value and an MCODE score > 7 as the threshold for the additional succeeding evaluation.
Validation of DMGs of interest
First, we validated the hub genes in other expression datasets to explore the relationship between hub genes and IS in different dimensions. GSE118481 reflected the expression level of core genes in carotid plaques between cerebral ischemic symptoms and asymptomatic conditions. GSE16561 and GSE22255 indicated whether the comparative expression of hub genes was different among stroke patients and normal controls. GSE37587 further evaluated the relative expression level of hub genes in patients with cerebral infarction at different time points after symptom onset. Next, we sought out stroke and healthy control groups to extract peripheral blood for core gene validation.
Sample authentication and diagnostic standards
A total of 322 subjects with complaints related to the brain at the First People’s Hospital of Nanning City from Jan. 1, 2015, to Dec. 31, 2017, were recruited. The blood biochemistry levels were 3.10–5.17 (TC), 0.56–1.70 (TG), 0.91–1.81 (HDL-C), 2.70–3.20 (LDL-C) mmol/L, 1.00–1.78 (ApoA1), 0.63–1.14 g/L (ApoB), and 1.00–2.50 (ApoA1/B), which were stated as the standard values [37]. All of the selected IS patients received a thorough neurological checkup along with brain magnetic resonance imaging. IS was diagnosed as per the International Classification of Diseases (9th Revision). Subjects with an embolic brain infarction, stroke triggered due to inflammatory disease, cardioembolic stroke, autoimmune disease, or serious chronic conditions were omitted from the current study [38]. The controls were evaluated to be free of IS by questionnaires, medical history, along with medical investigation. All subjects were from the Han population in Guangxi, China. A standard questionnaire was utilized to determine overall information along with medical history from all patients. This study was approved by the Ethics Committee of the First People’s Hospital of Nanning City and Liuzhou People’s Hospital (No. Lunshen 2009-Guike018; Jan. 7, 2009). Informed consents were acquired from all participants [39].
Quantitative DNA methylation
Genomic DNAs from the 322 peripheral blood samples were obtained with a TaKaRa MiniBEST Universal Genomic DNA Extraction Kit Ver.5.0. DNA concentrations were determined by means of a NanoDrop2000 spectrophotometer (USA). The methylation levels of CpG sites were assessed through pyrosequencing. PyroMark Assay Design software (Qiagen) was utilized to design precise sets of primers for CpG PCR amplification as well as sequencing. The primers can be found in Supplementary Table 3. All protocols for bisulfite conversion, PCR and pyrosequencing were previously described [10]. DNA methylation of the hub gene promoter was computed by MassARRAY EpiTYPER assays (Sequenom, USA). Sequenom EpiDesigner software was used to design the primers. Procedures for methylation evaluations as well as quality controls have been published previously [40].
Real-time PCR analysis
Total RNA from the 322 peripheral blood samples was extracted by means of an Axygen RNA Isolation Kit (USA) as per the supplier’s protocol. RNA concentrations were determined by means of a NanoDrop2000 spectrophotometer (USA). cDNA was synthesized from 1 μg of total RNA using a PrimeScript 1st strand cDNA Synthesis Kit (TaKaRa, China) as per the supplier’s instructions. Real-time polymerase chain reactions were carried out to evaluate the mRNA expression levels of hub genes using SYBR Premix Ex Taq II (TaKaRa, China) by using a 7500 Real-Time PCR system (Applied Biosystems, USA). GAPDH served as an internal control. The primer sequences are mentioned in Supplementary Table 4.
Statistical analysis
Data analyses were done using SPSS 22.0 (SPSS Inc. USA) and Prism 8.0 (GraphPad Software). Chi-square analysis was implemented to evaluate differences in ratios amongst groups. Continuous data are presented as the means ± SD for those that were normally distributed; the median and interquartile ranges of TG were not normally distributed. The Mann-Whitney nonparametric test and Kruskal-Wallis test were utilized to compare continuous data sets. R software (version 3.6.0) was utilized for further bioinformatics analysis. To define if the methylation level was related to gene expression, we conducted a correlation test between methylation and expression using the ggplot2 package in R.
Author Contributions
G.-X.D. conceived the study, participated in the design, undertook genotyping, performed the statistical analyses, and drafted the manuscript. J.-R.W. conceived the study, participated in the design, carried out the epidemiological survey, collected the samples, and helped to draft the manuscript. N.X. collaborated to the genotyping. Q.-H., J.-Y.T., Z.Z. and X.-F.L. carried out the epidemiological survey and collected the samples. All authors read and approved the final manuscript.
Acknowledgments
We acknowledge and appreciate our colleagues for their valuable efforts and comments on this paper.
Conflicts of Interest
The authors have no potential conflicts of interest to report.
Funding
The authors acknowledge the essential role of the funding of the Science Research and Technology Development Plan of Nanning City (No: 20163142) and Nanning Qingxiu District Science and Technology Plan Project (No: 2018029) in this motif.
References
- 1. Roth GA, Forouzanfar MH, Moran AE, Barber R, Nguyen G, Feigin VL, Naghavi M, Mensah GA, Murray CJ. Demographic and epidemiologic drivers of global cardiovascular mortality. N Engl J Med. 2015; 372:1333–41. https://doi.org/10.1056/NEJMoa1406656 [PubMed]
- 2. Frizzell JP. Acute stroke: pathophysiology, diagnosis, and treatment. AACN Clin Issues. 2005; 16:421–40. https://doi.org/10.1097/00044067-200510000-00002 [PubMed]
- 3. Sun L, Clarke R, Bennett D, Guo Y, Walters RG, Hill M, Parish S, Millwood IY, Bian Z, Chen Y, Yu C, Lv J, Collins R, et al, and China Kadoorie Biobank Collaborative Group, and International Steering Committee, and International Co-ordinating Centre, Oxford, and National Co-ordinating Centre, Beijing, and Regional Co-ordinating Centres. Causal associations of blood lipids with risk of ischemic stroke and intracerebral hemorrhage in Chinese adults. Nat Med. 2019; 25:569–74. https://doi.org/10.1038/s41591-019-0366-x [PubMed]
- 4. Diener HC, Sacco RL, Easton JD, Granger CB, Bernstein RA, Uchiyama S, Kreuzer J, Cronin L, Cotton D, Grauer C, Brueckmann M, Chernyatina M, Donnan G, et al, and RE-SPECT ESUS Steering Committee and Investigators. Dabigatran for Prevention of Stroke after Embolic Stroke of Undetermined Source. N Engl J Med. 2019; 380:1906–17. https://doi.org/10.1056/NEJMoa1813959 [PubMed]
- 5. Ekker MS, Verhoeven JI, Vaartjes I, van Nieuwenhuizen KM, Klijn CJ, de Leeuw FE. Stroke incidence in young adults according to age, subtype, sex, and time trends. Neurology. 2019; 92:e2444–54. https://doi.org/10.1212/WNL.0000000000007533 [PubMed]
- 6. Smith ZD, Meissner A. DNA methylation: roles in mammalian development. Nat Rev Genet. 2013; 14:204–20. https://doi.org/10.1038/nrg3354 [PubMed]
- 7. Jones PA. Functions of DNA methylation: islands, start sites, gene bodies and beyond. Nat Rev Genet. 2012; 13:484–92. https://doi.org/10.1038/nrg3230 [PubMed]
- 8. Seisenberger S, Popp C, Reik W. Retrotransposons and germ cells: reproduction, death, and diversity. F1000 Biol Rep. 2010; 2:44. https://doi.org/10.3410/B2-44 [PubMed]
- 9. Wernig-Zorc S, Yadav MP, Kopparapu PK, Bemark M, Kristjansdottir HL, Andersson PO, Kanduri C, Kanduri M. Global distribution of DNA hydroxymethylation and DNA methylation in chronic lymphocytic leukemia. Epigenetics Chromatin. 2019; 12:4. https://doi.org/10.1186/s13072-018-0252-7 [PubMed]
- 10. Miao L, Yin RX, Zhang QH, Hu XJ, Huang F, Chen WX, Cao XL, Wu JZ. Integrated DNA methylation and gene expression analysis in the pathogenesis of coronary artery disease. Aging (Albany NY). 2019; 11:1486–500. https://doi.org/10.18632/aging.101847 [PubMed]
- 11. Zhou S, Zhang Y, Wang L, Zhang Z, Cai B, Liu K, Zhang H, Dai M, Sun L, Xu X, Cai H, Liu X, Lu G, Xu G. CDKN2B methylation is associated with carotid artery calcification in ischemic stroke patients. J Transl Med. 2016; 14:333. https://doi.org/10.1186/s12967-016-1093-4 [PubMed]
- 12. Abukaresh A, Al-Abadlah R, Böttcher B, El-Essi K. Ischaemic stroke management at Al-Shifa Hospital in the Gaza Strip: a clinical audit. Lancet. 2018 (Suppl 2); 391:S7. https://doi.org/10.1016/S0140-6736(18)30373-8 [PubMed]
- 13. Chen PH, Gao S, Wang YJ, Xu AD, Li YS, Wang D. Classifying Ischemic Stroke, from TOAST to CISS. CNS Neurosci Ther. 2012; 18:452–6. https://doi.org/10.1111/j.1755-5949.2011.00292.x [PubMed]
- 14. Giralt-Steinhauer E, Jiménez-Conde J, Soriano Tárraga C, Mola M, Rodríguez-Campello A, Cuadrado-Godia E, Ois A, Fernández-Cádenas I, Carrera C, Montaner J, Díaz Navarro RM, Vives-Bauzá C, Roquer J. Exploring the genetic basis of stroke. Spanish stroke genetics consortium. Neurologia. 2014; 29:560–66. https://doi.org/10.1016/j.nrl.2013.04.005 [PubMed]
- 15. Anderson CD, Biffi A, Nalls MA, Devan WJ, Schwab K, Ayres AM, Valant V, Ross OA, Rost NS, Saxena R, Viswanathan A, Worrall BB, Brott TG, et al, and International Stroke Genetics Consortium. Common variants within oxidative phosphorylation genes influence risk of ischemic stroke and intracerebral hemorrhage. Stroke. 2013; 44:612–19. https://doi.org/10.1161/STROKEAHA.112.672089 [PubMed]
- 16. Soriano-Tárraga C, Jiménez-Conde J, Giralt-Steinhauer E, Mola M, Ois A, Rodríguez-Campello A, Cuadrado-Godia E, Fernández-Cadenas I, Carrera C, Montaner J, Elosua R, Roquer J, and GeneStroke, and “The Spanish Stroke Genetics Consortium”. Global DNA methylation of ischemic stroke subtypes. PLoS One. 2014; 9:e96543. https://doi.org/10.1371/journal.pone.0096543 [PubMed]
- 17. Shen Y, Peng C, Bai Q, Ding Y, Yi X, Du H, He L, Zhou D, Chen X. Epigenome-Wide Association Study Indicates Hypomethylation of MTRNR2L8 in Large-Artery Atherosclerosis Stroke. Stroke. 2019; 50:1330–1338. https://doi.org/10.1161/STROKEAHA.118.023436 [PubMed]
- 18. Fujii R, Yamada H, Munetsuna E, Yamazaki M, Mizuno G, Tsuboi Y, Ohashi K, Ishikawa H, Ando Y, Hagiwara C, Maeda K, Hashimoto S, Hamajima N, Suzuki K. Dietary vegetable intake is inversely associated with ATP-binding cassette protein A1 (ABCA1) DNA methylation levels among Japanese women. Nutrition. 2019; 65:1–5. https://doi.org/10.1016/j.nut.2019.02.010 [PubMed]
- 19. Zou LP, Guo YH, Fang F, Jin H, Wu HS, Mix E. Evidence for human leukocyte antigen-related susceptibility in idiopathic childhood ischemic stroke. Eur Neurol. 2002; 48:153–57. https://doi.org/10.1159/000065519 [PubMed]
- 20. DeGraba TJ. Immunogenetic susceptibility of atherosclerotic stroke: implications on current and future treatment of vascular inflammation. Stroke. 2004 (Suppl 1); 35:2712–19. https://doi.org/10.1161/01.STR.0000143788.87054.85 [PubMed]
- 21. Murali V, Rathika C, Ramgopal S, Padma Malini R, Arun Kumar MJ, Neethi Arasu V, Jeyaram Illiayaraja K, Balakrishnan K. Susceptible and protective associations of HLA DRB1*/DQB1* alleles and haplotypes with ischaemic stroke. Int J Immunogenet. 2016; 43:159–65. https://doi.org/10.1111/iji.12266 [PubMed]
- 22. Stacey A, Toolis C, Ganesan V. Rates and Risk Factors for Arterial Ischemic Stroke Recurrence in Children. Stroke. 2018; 49:842–47. https://doi.org/10.1161/STROKEAHA.117.020159 [PubMed]
- 23. Sayad A, Akbari MT, Inoko H, Khazaei M, Mehdizadeh B, Taheri M, Ghafouri-Fard S. Association between human leucocyte antigen alleles and risk of stroke in Iranian population. Int J Immunogenet. 2019; 46:179–91. https://doi.org/10.1111/iji.12421 [PubMed]
- 24. Liu SY, Chang Y, Zhang SY, Wu W, Sun BJ, Han XM. Association of atherosclerotic cerebral infarction and human leukocyte antigen-DRB in a North Chinese Han population. Neurol India. 2011; 59:521–26. https://doi.org/10.4103/0028-3886.84330 [PubMed]
- 25. Zaina S, Gonçalves I, Carmona FJ, Gomez A, Heyn H, Mollet IG, Moran S, Varol N, Esteller M. DNA methylation dynamics in human carotid plaques after cerebrovascular events. Arterioscler Thromb Vasc Biol. 2015; 35:1835–42. https://doi.org/10.1161/ATVBAHA.115.305630 [PubMed]
- 26. Barr TL, Conley Y, Ding J, Dillman A, Warach S, Singleton A, Matarin M. Genomic biomarkers and cellular pathways of ischemic stroke by RNA gene expression profiling. Neurology. 2010; 75:1009–14. https://doi.org/10.1212/WNL.0b013e3181f2b37f [PubMed]
- 27. Krug T, Gabriel JP, Taipa R, Fonseca BV, Domingues-Montanari S, Fernandez-Cadenas I, Manso H, Gouveia LO, Sobral J, Albergaria I, Gaspar G, Jiménez-Conde J, Rabionet R, et al. TTC7B emerges as a novel risk factor for ischemic stroke through the convergence of several genome-wide approaches. J Cereb Blood Flow Metab. 2012; 32:1061–72. https://doi.org/10.1038/jcbfm.2012.24 [PubMed]
- 28. Barr TL, VanGilder R, Rellick S, Brooks SD, Doll DN, Lucke-Wold AN, Chen D, Denvir J, Warach S, Singleton A, Matarin M. A genomic profile of the immune response to stroke with implications for stroke recovery. Biol Res Nurs. 2015; 17:248–56. https://doi.org/10.1177/1099800414546492 [PubMed]
- 29. Gautier L, Cope L, Bolstad BM, Irizarry RA. affy—analysis of Affymetrix GeneChip data at the probe level. Bioinformatics. 2004; 20:307–15. https://doi.org/10.1093/bioinformatics/btg405 [PubMed]
- 30. Gentleman RC, Carey VJ, Bates DM, Bolstad B, Dettling M, Dudoit S, Ellis B, Gautier L, Ge Y, Gentry J, Hornik K, Hothorn T, Huber W, et al. Bioconductor: open software development for computational biology and bioinformatics. Genome Biol. 2004; 5:R80. https://doi.org/10.1186/gb-2004-5-10-r80 [PubMed]
- 31. Yu G, Wang LG, Han Y, He QY. clusterProfiler: an R package for comparing biological themes among gene clusters. OMICS. 2012; 16:284–87. https://doi.org/10.1089/omi.2011.0118 [PubMed]
- 32. Yu G, Wang LG, Yan GR, He QY. DOSE: an R/Bioconductor package for disease ontology semantic and enrichment analysis. Bioinformatics. 2015; 31:608–09. https://doi.org/10.1093/bioinformatics/btu684 [PubMed]
- 33. Tibshirani R, Hastie T, Narasimhan B, Chu G. Diagnosis of multiple cancer types by shrunken centroids of gene expression. Proc Natl Acad Sci USA. 2002; 99:6567–72. https://doi.org/10.1073/pnas.082099299 [PubMed]
- 34. Szklarczyk D, Gable AL, Lyon D, Junge A, Wyder S, Huerta-Cepas J, Simonovic M, Doncheva NT, Morris JH, Bork P, Jensen LJ, Mering CV. STRING v11: protein-protein association networks with increased coverage, supporting functional discovery in genome-wide experimental datasets. Nucleic Acids Res. 2019; 47:D607–13. https://doi.org/10.1093/nar/gky1131 [PubMed]
- 35. Miao L, Yin RX, Pan SL, Yang S, Yang DZ, Lin WX. Weighted Gene Co-Expression Network Analysis Identifies Specific Modules and Hub Genes Related to Hyperlipidemia. Cell Physiol Biochem. 2018; 48:1151–63. https://doi.org/10.1159/000491982 [PubMed]
- 36. Miao L, Yin RX, Huang F, Yang S, Chen WX, Wu JZ. Integrated analysis of gene expression changes associated with coronary artery disease. Lipids Health Dis. 2019; 18:92. https://doi.org/10.1186/s12944-019-1032-5 [PubMed]
- 37. Miao L, Yin RX, Pan SL, Yang S, Yang DZ, Lin WX. BCL3-PVRL2-TOMM40 SNPs, gene-gene and gene-environment interactions on dyslipidemia. Sci Rep. 2018; 8:6189. https://doi.org/10.1038/s41598-018-24432-w [PubMed]
- 38. Miao L, Yin RX, Yang S, Huang F, Chen WX, Cao XL. Association between single nucleotide polymorphism rs9534275 and the risk of coronary artery disease and ischemic stroke. Lipids Health Dis. 2017; 16:193. https://doi.org/10.1186/s12944-017-0584-5 [PubMed]
- 39. Miao L, Yin RX, Huang F, Chen WX, Cao XL, Wu JZ. The effect of MVK-MMAB variants, their haplotypes and G×E interactions on serum lipid levels and the risk of coronary heart disease and ischemic stroke. Oncotarget. 2017; 8:72801–17. https://doi.org/10.18632/oncotarget.20349 [PubMed]
- 40. Claus R, Lucas DM, Stilgenbauer S, Ruppert AS, Yu L, Zucknick M, Mertens D, Bühler A, Oakes CC, Larson RA, Kay NE, Jelinek DF, Kipps TJ, et al. Quantitative DNA methylation analysis identifies a single CpG dinucleotide important for ZAP-70 expression and predictive of prognosis in chronic lymphocytic leukemia. J Clin Oncol. 2012; 30:2483–91. https://doi.org/10.1200/JCO.2011.39.3090 [PubMed]