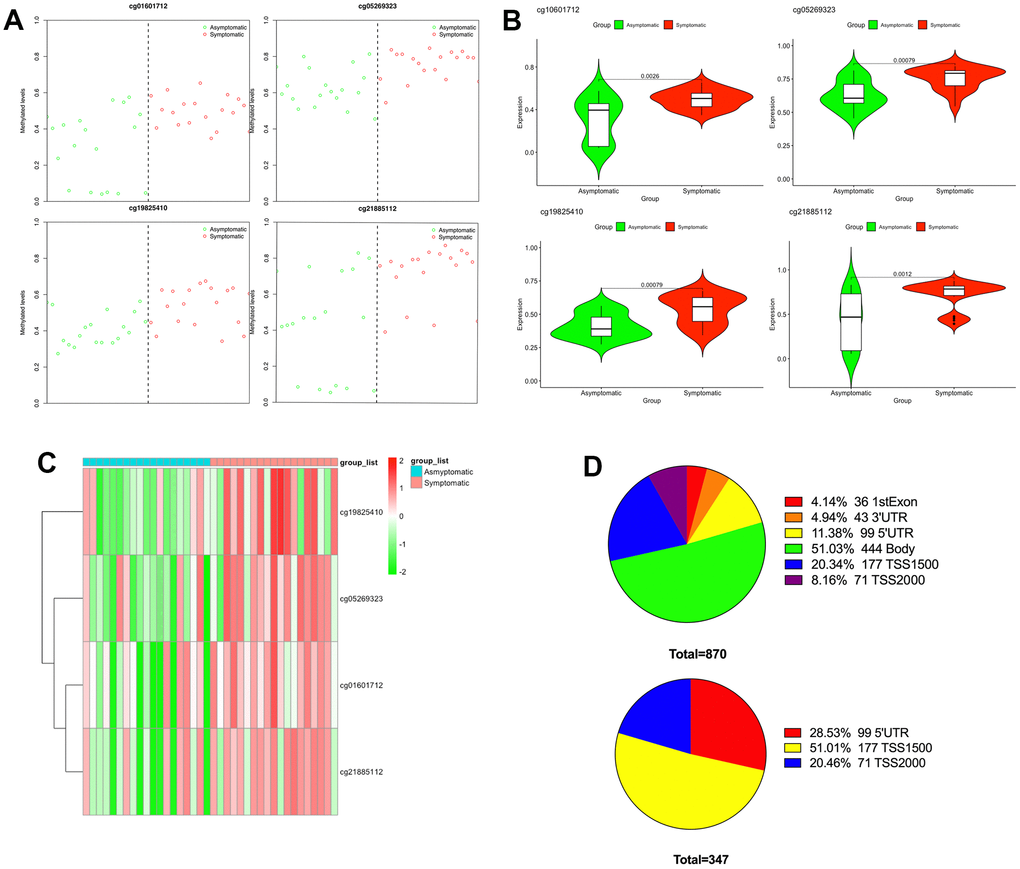
Figure 2.Differential methylation between symptomatic and asymptomatic samples. (A) Methylation levels of the 4 CpGs in asymptomatic (green circle) as well as symptomatic (red circle) samples from the GEO; (B) The differences in methylation levels of the 4 CpGs in asymptomatic and symptomatic patients; (C) Heat map indicating methylation of the 4 CpGs in asymptomatic and symptomatic patients; (D) Promoter region distribution of differentially methylated promoter CpG sites.