Submit an Article
Navigate
Home
Editorial Board
Editorial Policies
Current Volume
Archive
Scientific Integrity
Publication Ethics Statements
Interviews with Outstanding Authors
Newsroom
Sponsored Conferences
Podcast
Contact
Special Collections
Submit an Article
Online ISSN: 1945-4589
Research Paper
|
Volume 11, Issue 18
|
pp. 7663–7677
Association between promoter DNA methylation and gene expression in the pathogenesis of ischemic stroke
Back to article
Figure 4
(4 of 8)
−
100%
+
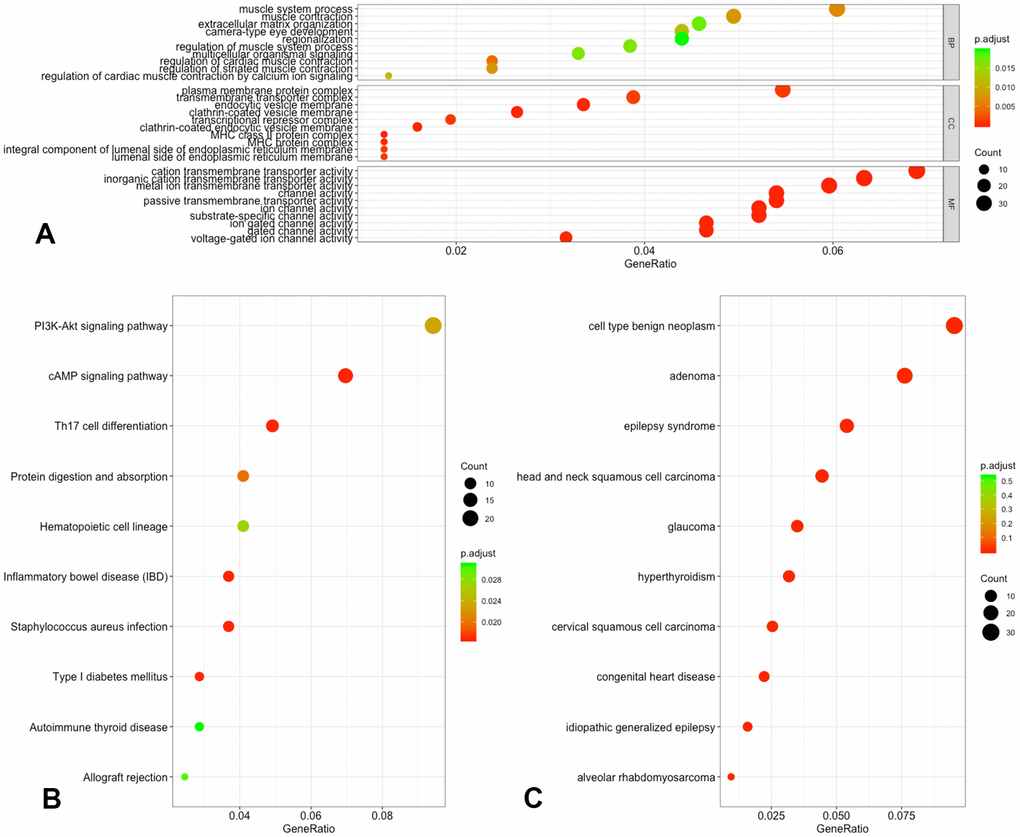
Figure 4.
Functional annotation of DMGs.
(
A
) GO analysis of DMGs; (
B
) KEGG analysis of DMGs; (
C
) DO analysis of DMGs.