


Introduction
In yeast, chronological senescence (CS) is defined as loss of viability of yeast cells grown in confluent state [1-10]. Viability is determined as the ability to resume replication in fresh medium. CS is genetically regulated and inactivation of numerous genes including TOR (Target of Rapamycin) extends lifespan [2, 11-23]. Furthermore, rapamycin, an inhibitor of TOR, decelerates CS in yeast [24]. Noteworthy, the TOR (target of rapamycin) pathway is involved in aging of variety of species from worm to mammals [25-28]. Some other genes identified in the yeast model turned out to be involved in organismal aging and age-related diseases in mammals [29-38]. CS is often compared to aging of postmitotic cells in the organism. However, as recently discussed, the link between CS and organismal aging is not immediately apparent but indirectly relies on common genetic pathways [39].
Since yeasts are unicellular organisms, CS should be compared with some form of cellular senescence in cell culture. There are two types of senescence of mammalian cells in culture: replicative and accelerated (also known as premature or stress-induced senescence). Yeast replicative senescence corresponds to replicative senescence in rodent cells. Then at first glance, yeast CS is analogous to accelerated cellular senescence. The analogy is seemingly strengthened by the involvement of mTOR in senescent phenotype of mammalian cells [40-46]. In proliferating cells, mTOR is active, thus driving cell growth in size, which is balanced by cell division. When cell cycle is blocked by p21 or p16, for instance, but mTOR is still active, then mTOR drives cellular senescence [40, 46, 47]. By deactivating mTOR, rapamycin prevents conversion of quiescence into senescence or, in other words, prevents gerogenic conversion (geroconversion) during cell cycle arrest [41, 46].
Yet accelerated senescence is not analogous to yeast CS. Accelerated cellular senescence is not caused by medium acidification. Senescent cells are large, flat, highly viable and apoptosis-resistant.Furthermore, gero- conversion occurs in low cell densities, whereas in high density mTOR is spontaneously deactivated thus suppressing geroconversion (manuscript in preparation). So there is no known mammalian analogy to yeast CS. Given that yeast aging research has been so fruitful in identification of pathways involved in organismal aging, [1, 3, 48-51] it is important to recognize relevant mammalian cell model for CS.
We realized that replica of CS is so trivial that it remains unnamed and ignored, although this phenomenon is known to any cancer researcher. If a flask with cancer cells is forgotten (neglected) in the incubator, cells become over-confluent, overgrow, and loose viability. And this is exactly what would be called chronological aging (in yeast). Here we investigated mechanisms of chronological senescence (CS) in human cells and its pharmacological suppression.
Results
TOR-dependent CS in HT-p21-9 cells
For initial experiments we chose HT-p21-9 cells, because these cells were extensively studied as a model of conventional cellular senescence [52, 41]. Importantly, these cells rapidly turn media yellow. Acidification of the medium is evident by transition of the color of phenol red (a pH indicator) from pink-red to yellow over the pH range 7.4 to 6.8. The color of phenol red is a convenient measure of pH. In dense cell culture, the medium becomes acidic (yellow) (Fig. 1A: top panel – control (C). Rapamycin renders the color pinkish. After recording the color by photography, media were collected for further analysis (lactate levels, cytotoxicity) and equal volumes of trypsinized cells were re-plated in larger plates in fresh medium (Fig. 1 A, bottom panel) and colonies were allowed to grow for 7 days. In control, cells lost the replicative capacity and did not form colonies in fresh medium (Fig. 1A, bottom panel). Rapamycin prevented loss of viability (Fig. 1A). Loss of viability, over time (Fig. 1B), is chronological senescence (CS). At initial cell densities of 40,000 and 80,000 cells per well (Fig. 1 B), the major drop in viability occurred at day 5 and day 4, respectively (Fig. 1B). The most dramatic effect of rapamycin was observed, when control cultures almost completely lost their viability. To quantify the viability, we counted cells after 7 days of re-growth in fresh culture (Fig. 1C). There was a dramatic decrease in viability after 4 and 5 days in control wells, which was prevented by rapamycin (Fig. 1 C).
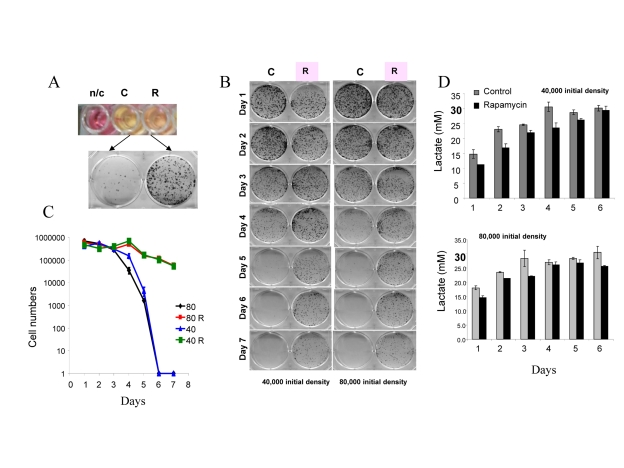
Figure 1. Defining mTOR-dependent CS (A) Measurement of CS. 80000 HT-p21-9 cells were plated in 0.2 ml medium per well in 96-well plate with 500 nM rapamycin (R) or without rapamycin – control (C). After 4 days, the plate was photographed to record color of media (i.e. pH). The color of medium without cells is shown for comparison n/c (no cells). Then cells from each well were split into larger wells of 6-well plates. Detailed description: medium (together with floating cells) was aspirated and adherent cells were trypsinized in 0.2 ml of trypsin. Equal volume (a 4 μl aliquot of cell culture) or 2% of total adherent (live) cells was plated in 4 ml of fresh medium in 6-well plates. After 7 days, colonies were stained and photographed. A number of colonies is a measure of viability of the stationary culture. (B) Time-dependent (chronological) loss of replicative viability. Cells were plated at initial density of 40000 and 80000 cells per well in 96-well plates without (C) or with rapamycin (R) as shown in panel A. After indicated time, cells were trypzinised and equal volume of adherent cells (2%) were re-plated in 6 well plates and allowed to form colonies for 7 days. (C) Cells from plates shown in panel B were trypsinized and counted to precisely quantify replicative viability. (D) Levels of lactate in conditioned medium. Cells were plated at initial density of 40000 and 80000 cells per well in 96-well plates without (C) or with rapamycin (R) as shown in panel A. After indicated time, concentration of lactate was measured in conditioned media.
Time course of lactate production
At both cell densities, lactic acid (LA) concentrations reached the maximal level of ~30 mM on day 3 and day 4, respectively (Fig. 1D). Noteworthy, these maximal levels of LA were achieved a day before the major loss of viability (Fig. 1 D versus C). Rapamycin decreased levels of LA, so that LA concentration approximated to the maximal level by day 6-7. A comparison of LA levels and CS time points suggests that levels of LA above 30 mM may make medium toxic: then cells loose viability and this prevents further accumulation of LA.
Protection by rapamycin is indirect
Next, we tested the effect of conditioned medium (CM) that was collected from the dense culture and applied to cells plated at low density. Such CM was deadly, causing loss of viability in low cell density. This allowed us to investigate the mechanism of action of rapamycin: direct versus indirect. One possibility is that rapamycin protects cells directly by increasing resistance to cell death caused by deadly CM. Another possibility is that CM produced in the presence of rapamycin would be less deadly. We tested CM produced in the presence of rapamycin (R-CM) versus CM with rapamycin being added after CM collection (CM+R). Both types of CM were added to low density HT-p21-9 and HCT116 cells for 3 days and then the cells were grown in fresh medium. CM+R was as toxic as CM, whereas R-CM was significantly less toxic (Fig. 2). We conclude that rapamycin does not protect cells directly, but instead changes the property of CM. As we have already shown, rapamycin decreased levels of LA (Fig. 1D).
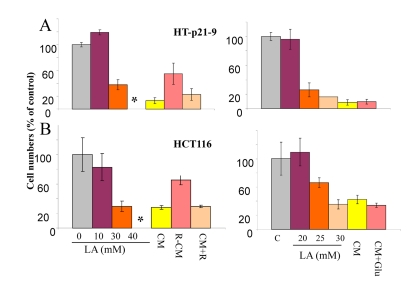
Figure 2. Cytotoxicity of conditioned medium (CM) and lactate HT-p21-9 cells (A) and HCT116 cells (B) were plated in 96-well plates at low density (2000 cells/well) and treated with a range of lactic acid (LA) concentrations or conditioned medium (CM), collected from overgrown HT-p21-9 cell culture. After 3 days, medium was changed to fresh medium and cells were allowed to proliferate for 5 days and then number of viable cells was determined using MTT assay. CM, R-CM, and CM+R were prepared as described in Methods.
Lactate poisoning
Next we tested whether LA is toxic. Addition of 40 mM lactate to fresh medium rendered it “absolutely deadly” (Fig. 2 A). Viability IC50 was around 20-30 mM LA, depending on cell line. Noteworthy, color of the medium containing 30 mM lactate was similar to yellow color of CM in the stationary culture, when cells undergo CS. This was confirmed by measurements of LA in such deadly CM (34.6 ± 1 mM). So LA levels slightly above 30 mM were maximally achievable, killing cells and thus preventing further accumulation of LA.
There are 2 possibilities that are not mutually exclusive: 1) LA is toxic by itself and is the only cause of CS. Rapamycin, which decreases levels of LA, simultaneously decreases toxicity of CM; 2) production of 30 mM lactate requires metabolism of 15 mM glucose. In principle, exhaustion of glucose may contribute to CM toxicity. However, addition of glucose to CM did not decrease its toxicity (Fig. 2 B).
Thus, LA was the main cause of toxicity. Next, we tested whether this toxicity was due to LA acidity. To neutralize pH, we added NaOH to cells plated in high density after one day of cultivation. At concentrations (0.5-1 mM) NaOH shifted the medium color from yellow to pink and decreased CS (Fig. S1). We conclude that it is acidity of LA that is deleterious for the cells.
Gerosuppressants decrease lactate levels and CS
Recently we have demonstrated that agents that deactivate the mTOR pathway decelerate premature (p21-induced) senescence in HT-p21-9 cells [41, 53, 54]. Given that these agents suppress the conversion from quiescence to senescence (geroconversion), we named them gero-suppressants [55]. Here we evaluated the effect of gero-suppressants on CS, using rapamycin as a positive control (Fig. 3). Inhibitors of PI-3K and MEK, LY294002 and U0126, respectively, decreased acidosis (Fig. 3 A), lactic acid production (Fig. 3 B) and dramatically decreased CS in HT-p21-9 and HCT116 cells (Fig. 3 C-D). Suppression of CS correlated with inhibition of LA production in both cell lines. The antioxidant N-acetyl-L-cysteine (NAC) decreased LA production preferentially in HT-p21-9 cells and also prevented CS in the same cell line. CGK733, in contrast, was preferentially effective in HCT116 cells (Fig. 3). Finally, metformin did not affect either LA levels or CS in any cell lines (Fig. 3).
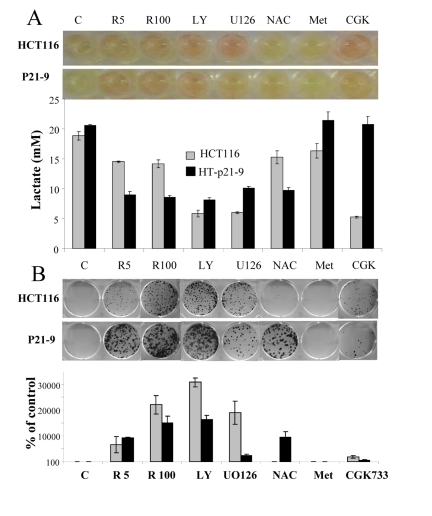
Figure 3. Testing potential gero-suppressants HCT116 cells and HT-p21-9 cells were plated at 80000 per well in 96 well plates with indicated agents: 5 nM and 100 nM rapamycin (R5 and R 100), 10 μM LY294002 (LY), UO126, and CGK733, 2 mM NAC. (A) After 4 days, the plates were photographed (upper panel) and lactate concentrations were measured in media (lower panel). (B) An equal volume of attached cells (an aliquot of 2%) was plated in 6 well plates. After 7 days, colonies were stained with Crystal Violet (upper panel) or total numbers of cells per well were determined by counting (low panel).
Noteworthy, free radicals and oxidative stress can activate Akt/mTOR and vice versa active TOR may promote ROS [9, 56]. Therefore, inhibition of ROS by NAC is expected to decrease not only ROS levels but also mTOR activity. In fact, NAC inhibited CS in a dose-dependent manner with maximal effect at 20 mM (higher concentrations were toxic) (Fig. 4 A). In high cell density, mTOR was spontaneously deactivated after first day in culture. NAC inhibited the Akt/mTOR pathway by 6 hrs (Fig. 4B, 6 hrs), before mTOR becomes spontaneously deactivated. Noteworthy, the ATM inhibitor CGK733 also inhibited mTOR (Fig. 4B).
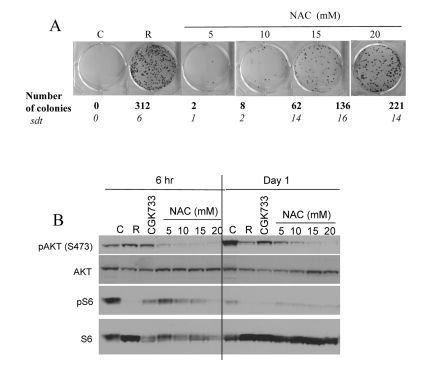
Figure 4. Effects of NAC and CGK733 on CS and mTOR (A) HT-p21-9 cells were plated at 40000 per well in 96 well plates with indicated agents: 500 nM rapamycin (R), 5-20 mM NAC and incubated for 6 days. On Day 6 replicative viability of cells was measured by colony formation (8 days) as described in legend for Figure 1. (B) HT-p21-9 cells were plated at high density with indicated agents or left untreated (C) and allowed to attach for 6 hrs. Then, one set was lysed (Day 0, 6 hr) and second set was lysed after 24 hrs treatment (Day 1). Immunoblot was performed using indicated antibodies.
At high cell density, mTOR is shut down after 1 day in culture (Fig. 4 and Fig. S3). Still, rapamycin and other mTOR inhibitors suppressed CS very effectively. This suggests that the activity of mTOR during the first day (before spontaneous deactivation of mTOR) determines cell fate.
Effects of pre-conditions
We have noticed that time course of CS was slightly variable in different experiments (compare HCT116 cells in Fig. 3 and Fig. 6), even if cells were plated at the same densities and conditions. We reasoned that this may be due to different pre-conditions, given that mTOR becomes spontaneously deactivated in culture over time. This suggests that cells from the fresh culture will lose viability faster compared with those from the old culture. We tested this prediction. 80,000 cells from either old or fresh culture were plated in 96-wells in fresh medium and cultivated for the same time before measuring their viability. In fact, cells derived from “old pre-culture” retained viability longer (Fig. S2). Whereas rapamycin prevented CS in cells derived from fresh pre-culture, its effect was minimal in old pre-culture cells (Fig. S2). This result is in agreement with the data that mTOR is already inhibited in old pre-culture.
Lactate production vs apoptosis-reluctance as determinant of CS
We next compared 3 cell lines: HT-p21-9, HCT116 and HCT116-Bax−/−, a clone of HCT116 cells lacking Bax (Fig. 5 and 6). HCT-Bax−/− cells are apoptosis-reluctant [57, 58]. Cells were plated in 2 cell densities (80,000 and 20,000 cells per well). At high cell density on day 4, HT-p21-9 cells lost viability, which was prevented by rapamycin (Fig. 5B). In contrast, HCT116 and HCT-Bax−/− cells retained viability at that time point (in this particular experiment).
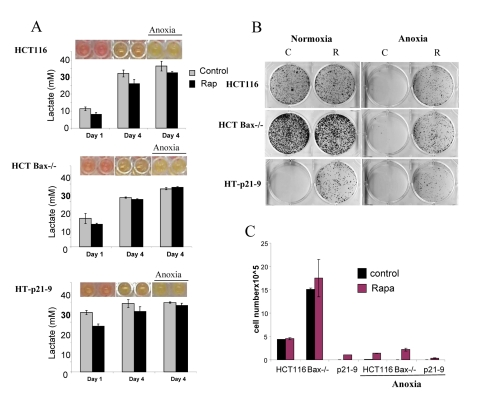
Figure 5. Effects of glycolytic phenotype, apoptosis resistance and anoxia on CS in very high initial cell density HCT116, HCT-Bax−/− cells and HT-p21-9 cells) were plated at 80000 per well in 96 well plates and next day 1 set of plates was placed under anoxia and 2 nd set was incubated in normoxia. If indicated, cells were treated with 100 nM rapamycin (R). (A) Wells were photographed (upper panels) and LA (lower panels) was measured after 1 day (D 1) or on the last 4th day (D 4) of culture. (B) Replicative viability. On day 4, equal aliquots of attached cells were plated in 6 well plates. After 7 days, colonies were stained with Crystal Violet (upper panel) or total numbers of cells per well were determined by counting (lower panel).
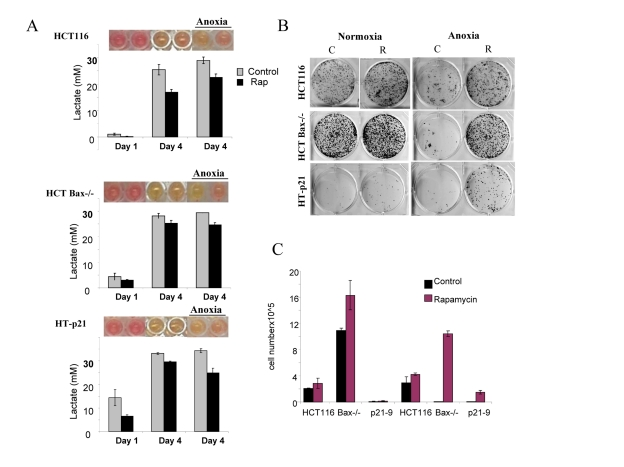
Figure 6. Effects of glycolytic phenotype, apoptosis resistance and anoxia on CS in medium initial cell density HCT116, HCT Bax−/− cells and HT-p21-9 cells were plated at 20000 per well in 96 well plates and after 1 day were placed in normoxia or anoxia. If indicated, cells were treated with 100 nM rapamycin (R). (A) Wells were photographed (upper panels) and LA (lower panels) was measured on 1 day (D 1) and on the last 4th day (D 4) of culture. (B) Replicative viability. On day 8, equal aliquots of attached cells were plated in 6 well plates. After 7 days, colonies were stained with Crystal Violet (upper panel) or total numbers of cells per well were determined by counting (lower panel).
In comparison with HCT116 cells, HT-p21-9 cells produced considerably more LA during the first day, which reached sub-lethal levels at that time (Fig. 5A). This demonstrated that levels of LA reached on the first day determine CS. However, HCT-Bax−/− cells, which were less prone to CS produced more lactate than HCT116 parental cells, indicating that resistance to apoptosis can also determine the viability. That was confirmed by direct testing of lactate on cell viability: HCT-Bax−/− cells appeared to be slightly more resistant to 30 mM LA than parental cells (Fig. 7). Still, the difference in resistance was relatively small. The major factor that determined CS was the rate of LA production during the first day in culture (Fig. 5, 6). At low cell density, the difference in LA production was the most prominent (Fig. 6A). HT-p21-9 cells were the most glycolytic, whereas HCT116 cells were the least glycolytic (Fig. 6A, day 1). By day 4, HT-p21-9 cells produced near-lethal levels of lactate (Fig. 6A). Accordingly, HT-p21-9 cells lost viability by day 8 (Fig. 6 B, C).
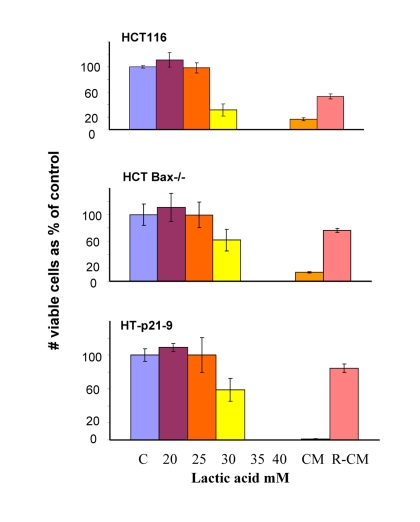
Figure 7. Lactate resistance of HT-p21-9, HCT116 and HCT116-Bax−/− cells HCT116 cells, HCT-Bax−/− and HT-p21-9 cells were plated in 96-well plates at low density (2000 cells/well) and treated with a range of lactic acid (LA) concentrations or conditioned medium (CM). After 3 days, medium was changed to fresh medium and cells were allowed to proliferate for 5 days and then numbers of live cells were determined using MTT assay. CM and R-CM were prepared as described in Methods.
A forced increase in lactate levels accelerated CS
If mTOR-dependent lactate production (rather than the activity of mTOR per se) is responsible for CS, then anoxia will accelerate CS. Anoxia and hypoxia induce (hypoxia-inducible factor) HIF-1 and this effect is not blocked by rapamycin (Fig. S3). Furthermore, hypoxia/anoxia decreases the activity of the mTOR pathway [59, 60]. So in anoxia LA production is forced by HIF-1. On the other hand, hypoxia/anoxia may diminish mTOR-dependent glycolysis by deactivating mTOR. Not surprisingly, relationship between aging and hypoxia are complex [61].
In anoxia experiments, cells were cultivated without oxygen for 3 days: from day 1 to day 4 (Fig. 5, 6). At high cell density on day 4, HT-p21-9 cells lost viability, which partially was prevented by rapamycin (Fig. 5 B, C). Furthermore, even HCT116 and HCT-Bax−/− cells lost viability in anoxia but not in normoxia (Fig. 5, 6). Yet, final levels of LA were almost identical in both normoxia and anoxia because CS prevented further accumulation of lactate (Fig. 5A, Fig 6A).
Rapamycin decelerated CS under both normoxia and anoxia. This might be due to a decrease in lactate production on the first day (especially in high density cultures, Fig. 5A) before cells were placed in anoxia. Alternatively, rapamycin may decrease cellular metabolism in anoxia, which would indicate that the effect of rapamycin was not due to its effects on respiration. Experiments here were not intended to determine whether the protective effect of rapamycin was independent of respiration. Further studies are under way to determine the effect of rapamycin on glycolysis under anoxia versus normoxia.
Suppression of CS by rapamycin was not due to its cytostatic effect
Rapamycin is moderately cytostatic in some cell lines including HT-p21-9 cells. However, the cytostatic effect in low cell density cannot account for deceleration of CS in high cell density. First, at high cell densities with a limited proliferation window, the cytostatic effect of rapamycin was undetectable. We plated HT-p21-9 cells in a wide range of initial cell densities (Fig. 8) from 35000 to 560000 cells per well with and without IPTG. In HT-p21-9 cells, IPTG induces ectopic p21 and causes cell cycle arrest [52], thus ensuring a constant number of cells.
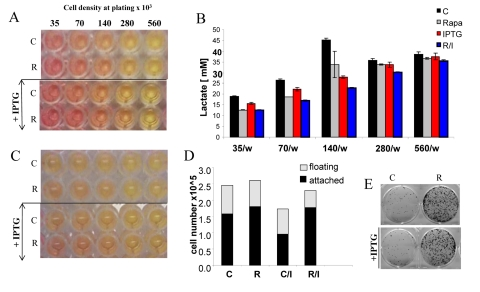
Figure 8. Effects of IPTG, rapamycin and initial cell densities on CS HT-p21-9 cells were plated at indicated densities (x103) in 96-well plates in the presence of IPTG and/or 500 nM rapamycin (R) or left untreated (C). (A) On day 1, plates were photographed. (B) On Day 1 lactate concentrations were measured in media. (C) On day 4 plates were photographed. (D) On Day 4 alive (attached) and dead (floating) cells were counted in wells with initial plating density of 140,000 cells/well. (E) Replicative viability of attached cells was measured as described in Materials and Methods and legend for Figure 1.
The acidity (yellow color) of the medium was proportional to initial cell numbers up to 140000 (Fig. 8 A) and corresponded to deadly levels of LA (Fig. 8 B). Rapamycin decreased levels of lactate. Noteworthy, highest levels of lactate were achieved at initial density 140000 (Fig. 8 B), but not at higher densities. At initial density of 280000 and 560000, all cells died within several days (Fig. 9, upper panel). These cells were floating and did not produce any colonies (Fig. 9, lower panel). On day 4, numbers of adherent (alive) cells were approximately identical at initial plating densities between 35000 and 140000 (Fig. 9, upper panel). This means that cells underwent 2, 1, and 0 divisions when plated at initial densities of 35000, 70000 and 140000, respectively. Most importantly, rapamycin did not affect the number of live cells (Fig. 9, upper panel); even though it decreased LA levels (Fig. 8 B). Despite rapamycin did not have an effect on the number of live cells, it dramatically increased the number of cells with replicative potential (Fig. 9, lower panel).
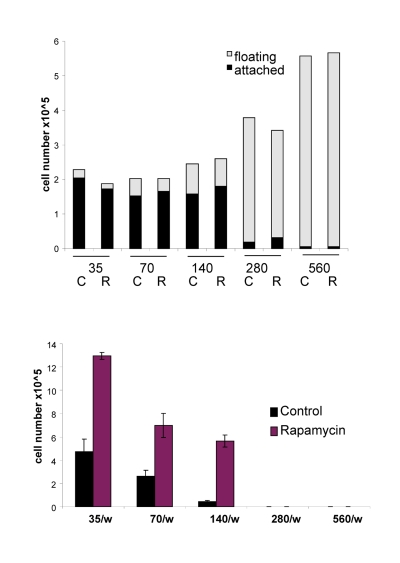
Figure 9. Effects of initial density and rapamycin on cell proliferation, survival and replicative viability Experiment was performed as described in the legend for Figure 8 (Upper panel). Cell survival. Alive (attached) and dead (floating) cells were counted in all wells on Day 4. (Lower panel). Replicative viability. In all samples, attached cells were replated in the fresh medium in low density and viability was measured by trypsinizing colonies and counting cells.
At initial density of 140000 cells, cells did not proliferate and did not die (Fig. 9). At this density, the level of lactate was maximal as well as the effect of rapamycin on CS (Fig. 8). Furthermore, we excluded the cytostatic effect of rapamycin by mixing IPTG- arrested HT-p21-9 (GFP-positive) cells with a few HCT116 cells, termed here as indicator cells. Since HT-p21-9 cells were already arrested by IPTG, rapamycin could not possibly arrest them further. The indicator HCT116 cells are not sensitive to cytostatic effects of rapamycin. Even if rapamycin could decrease proliferation of the indicator HCT116 cells, the small number of indicator cells could not significantly contribute to lactate production. We treated the cell mixture (80000 HT-p21-9 cells mixed with 2000 indicator cells) with IPTG (Fig. 10). After 4 days of incubation, small aliquots of cells were re-plated in fresh medium with IPTG to preclude proliferation of HT-p21-9 cells. As shown in Figure 10A, rapamycin dramatically increased a number of colonies. It was confirmed by microscopy that only HCT116 cells formed colonies, whereas IPTG-arrested HT-p21-9 (green) cells became senescent (large morphology of green cells) (Fig. 10B).
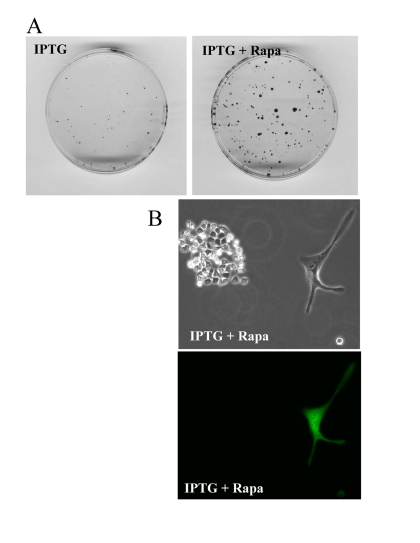
Figure 10. Rapamycin prevents CS of a few indicator cells by indirect effects on abundant cells A mixture of 2000 HCT116 cells (indicator, non-green cells) and 80000 HT-p21-9 (GFP-expressing, green cells) were plated in 96-well plate with 50 μg/ml IPTG with or without 500 nM rapamycin. After 4 days, equal aliquots of attached cells were re-plated in 60 mm dishes in fresh medium with IPTG to prevent proliferation of HT-p21-9 cells and to allow only viable indicator cells to form colonies. (A) After 7 days, colonies were stained. (B) Microphotograph of live cells before staining. A colony of HCT116 cells with a solitary large HT-p21-9 cell (labeled with GFP) is shown.
Discussion
Here we described a mammalian model of yeast-like chronological senescence (CS). Regardless of how trivial this phenomenon is, it is the replica of yeast CS.
For both yeast and cancer cells, CS can be defined as loss of replicative viability in a stationary culture.
Cancer cells with high glycolysis resemble yeast cells [62-65]. The most predictive sign of CS is yellow color of the medium, which indicates pH. Lactate and conditioned medium (CM) by were deadly in cells plated in low density. Furthermore, levels of lactate that caused CS coincided with maximally reachable lactate levels in the culture. Neutralization of the acidity prevented CS. Similarly, in some studies in yeast, loss of replicative ability was attributed to acidosis [39, 66-68]. The only difference is that mammalian cells produce lactic acid instead of acetic acid. Rapamycin decelerated CS. Rapamycin decreased lactate accumulation, keeping lactate levels below deadly levels. In other words, CS is a metabolic self-destruction or hypermetabolism-induced loss of replicative ability. By producing lactate, cells poison themselves and cannot resume replication in the fresh medium.
Still mechanisms of yeast CS are widely disputed and may depend on culture conditions [9, 18, 19, 22, 66-68]. Perhaps, mechanisms of mammalian CS may vary depending on initial cell densities, cell line, the propensity to apoptosis, levels of nutrients in the medium, initial mTOR activity, levels of oxygen and culture conditions prior to experiment. Also, we emphasize that our study was not intended to address the mechanisms of yeast CS. It neither resolves nor complicates the current debate in yeast aging research. The main goal of this study was to characterize “yeast-like” senescence in human cells and its pharmacological manipulation and also to address the question whether CS mimics cellular aging in the organism. CS mimics tumor necrosis rather than aging of post-mitotic cells. So, literally, CS is not a physiological model of organismal aging. But the same signaling pathways (such as TOR) are involved in CS and aging (Fig. 11), making the model useful for drug and gene discovery.
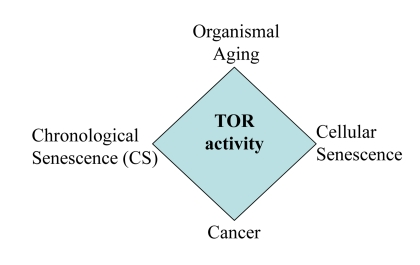
Figure 11. The relationship between CS and other TOR-dependent phenomena Common signaling pathways such as TOR are involved in cancer, aging, cellular senescence and CS.
We have shown that agents that decrease lactate production decelerate CS. Specifically, agents that directly or indirectly inhibit mTOR such as rapamycin, LY294002, U106 and to a lesser extend NAC, all suppressed CS. What all these agents have in common is that they inhibit the mTOR pathway. Thus, the same agents that suppress CS also were shown to suppress the senescent phenotype or conversion from quiescence to senescence during cell cycle arrest in traditional models of cellular senescence [46, 53].
Activation of growth factor receptors, Ras, Raf, PI3K, Akt, which all activate mTOR, are most common alterations in cancer [69-83]. These growth-promoting pathways also drive senescent phenotype, when the cell cycle is blocked [40, 53, 55]. The same pathways confirm highly glycolytic phenotype [84, 85], rendering cells prone to lactate-induced CS. And the same oncogenic pathways are involved in aging from yeast to mammals [11, 86-88]. And tumor suppressors (including p53) that inhibit the mTOR pathway are aging-suppressors [44, 89-93].
In line with previous proposals [11, 39], our work suggests that the same signaling pathways that are known to drive aging are also involved in glycolytic phenotype, which determines CS. Therefore, genetic and pharmacological manipulations that decelerate CS may also affect physiological aging. The same pathways (Ras, MEK and PI-3 K/Akt/mTOR) that render cells malignant and glycolytic are involved in aging. So the same agents that inhibit CS can also suppress malignant metabolism and organismal aging. In addition such agents may be beneficial during acute ischemia (as well as re-oxygenation) to prevent necrosis. Lactic acidosis is one of the complications of diabetes. Also, overproduction of lactate by tumors can lead to fatal lactic acidosis in cancer patients [94-96]. We suggest that rapamycin may be used to treat lactic acidosis both in diabetes and in cancer patients. Interestingly, stromal cells also overproduced lactate, thereby feeding the tumor [97-99]. We suggest that systemic rapamycin may decrease lactate production in the stroma.
Pro-aging pathways are conserved in evolution. This may explain why screening for agents that decelerate yeast CS could be useful against age-related diseases, aging and cancer. In comparison with yeast, human cells are more relevant to human aging and drug discovery.
In conclusion, CS is relevant to aging not because CS happens during physiological aging in the organism, but because the common genes and signaling pathways determine both CS and aging (Fig. 11). Here we discussed CS from the point of view of the aging research, as an analogy to yeast CS. From the cancer research point of view, we will discuss the implication of CS for tumor progression, aggressiveness and cancer therapy (Leontieva et al, Oncotarget, in press).
Materials and Methods
Cell lines and reagents
HT-p21-9 cells, derived from HT1080 human fibrosarcoma cells (ATCC, Manassas, VA), provided by Igor Roninson, were previously described [52, 41]. HT1080-p21-9 cells were cultured in high-glucose DMEM without pyruvate supplemented with FC2 serum (HyClone FetalClone II from Thermo Scientific, Logan, Utah). In HT-p21-9 cells, p21 expression can be turned on or off using isopropyl-thio-galactosidase (IPTG) [52, 41]. MCF-7 and HCT116 cell lines were obtained from ATCC (Manassas, VA). MCF-7, breast cancer cell line was cultured in high-glucose DMEM (plus pyruvate) with 10% FBS. HCT-Bax/- cells were derived from HCT116, colorectal adenocarcinoma cell line, and were provided by Bert Vogelstein. Rapamycin was obtained from LC Laboratories (MA, USA) and dissolved in DMSO as 5 mM solution. IPTG (Invitrogen) was dissolved in water as 50 mg/ml stock solution and used in cell culture at final concentration of 1.25-50 μg/ml. LY294002, CGK733, metformin, NAC, UO126 were obtained from Sigma-Aldrich.
Immunoblot analysis
Whole cell lysates were prepared using boiling lysis buffer (1%SDS, 10 mM Tris.HCl, pH 74.). Equal amounts of proteins were separated on 10% or gradient polyacrylamide gels and transferred to nitrocellulose membranes. The following antibodies were used: rabbit anti-phospho-S6 (Ser235/236) and mouse anti-S6, rabbit anti-phospho AKT and anti-Akt from Cell Signaling Biotechnology; anti-actin antibody from Sigma-Aldrich and mouse anti-HIF-1a from BD Biosciences. Secondary anti-rabbit and anti-mouse HRP conjugated antibodies were from Cell Signaling Biotechnology.
Preparation of conditioned medium
Conditioned medium (CM) from HT-p21-9 cells plated at high density (106 cells per 60 mm dish) and cultured for 4 days. R-CM, cells were cultured in the presence of 500 nM rapamycin. CM+R: 500 nM rapamycin was added to CM after collection of CM.
Lactate assay
was performed using L-Lactate assay kit from Eton Bioscience Inc (San Diego, CA) according to manufacture's instructions.
Replicative viability as measure of CS
Cells were plated at high initial density (see Fig. 1A) and cultured for 4-8 days. Then media with floating (dead cells) were removed, cells trypsinized and a small aliquot of attached cells was replated at low cell density in 6 well plates in fresh medium. After 6-8 days, colonies were stained with 1.0 % crystal violet and in replicate wells cells were trypzinised and counted.
Supplementary Materials
Effect of NaOH on CS HT-p21-9 cells were plated at 80,000/well in 96 well plates. On day 1, 0.5 mM or 1 mM NaOH was added. 100 nM rapamycin (Rapa) was used as positive control. Cells were split on day 5 (4 μl out of 200 μl culture per well into 6 well plates) as shown in Fig. 1A. Colonies were grown for 9 days and stained with Crystal Violet.
HT1080 p21-9 cells passaged the day before (fresh culture) or cultured for 2 weeks without change of the medium (old culture) plated at 80000 cells/well in 96-well plates with or without 500 nM rapamycin. On day 4, cells were trypsinized and equal volumes of adherent cells (2%) were re-plated in 6 well plates. After 7 days, colonies were stained with Crystal violet.
HT-p21-9, HCT116 and HCT Bax−/− cells were plated at high density (upper panel) and regular density (lower panel) and on Day 1 was placed in either normoxia (Nor) or hypoxia (Hyp) with or without 100 nM rapamycin (R) or left untreated (C). Cells were lysed on day 1 (D1) and on day 3 (D3). Immunoblot was performed using indicated antibodies.
Conflicts of Interest
The authors of this manuscript have no conflict of interest to declare.
References
- 1. Kaeberlein M, McVey M, Guarente L. Using yeast to discover the fountain of youth. Sci Aging Knowledge Environ. 2001; 2001: pe1 [PubMed] .
- 2. Fabrizio P, Pozza F, Pletcher SD, Gendron CM, Longo VD. Regulation of longevity and stress resistance by Sch9 in yeast. Science. 2001; 292: 288 -290. [PubMed] .
- 3. Sinclair DA. Paradigms and pitfalls of yeast longevity research. Mech Ageing Dev. 2002; 123: 857 -867. [PubMed] .
- 4. Fabrizio P and Longo VD. The chronological life span of Saccharomyces cerevisiae. Aging Cell. 2003; 2: 73 -81. [PubMed] .
- 5. Fabrizio P and Longo VD. The chronological life span of Saccharomyces cerevisiae. Methods Mol Biol. 2007; 371: 89 -95. [PubMed] .
- 6. Kaeberlein M and Kennedy BK. Large-scale identification in yeast of conserved ageing genes. Mech Ageing Dev. 2005; 126: 17 -21. [PubMed] .
- 7. Murakami CJ, Burtner CR, Kennedy BK, Kaeberlein M. A method for high-throughput quantitative analysis of yeast chronological life span. J Gerontol A Biol Sci Med Sci. 2008; 63: 113 -121. [PubMed] .
- 8. Kaeberlein M. Lessons on longevity from budding yeast. Nature. 2010; 464: 513 -519. [PubMed] .
- 9. Weinberger M, Mesquita A, Caroll T, Marks L, Yang H, Zhang Z, Ludovico P, Burhans WC. Growth signaling promotes chronological aging in budding yeast by inducing superoxide anions that inhibit quiescence. Aging. 2010; 2: 709 -726. [PubMed] .
- 10. Ruckenstuhl C, Carmona-Gutierrez D, Madeo F. The sweet taste of death: glucose triggers apoptosis during yeast chronological aging. Aging. 2010; 2: 643 -649. [PubMed] .
- 11. Longo VD. Ras: the other pro-aging pathway. Sci Aging Knowledge Environ. 2004; 2004: pe36 [PubMed] .
- 12. Bonawitz ND, Chatenay-Lapointe M, Pan Y, Shadel GS. Reduced TOR signaling extends chronological life span via increased respiration and upregulation of mitochondrial gene expression. Cell Metab. 2007; 5: 265 -277. [PubMed] .
- 13. Boer VM, Amini S, Botstein D. Influence of genotype and nutrition on survival and metabolism of starving yeast. Proc Natl Acad Sci U S A. 2008; 105: 6930 -6935. [PubMed] .
- 14. Wei M, Fabrizio P, Hu J, Ge H, Cheng C, Li L, Longo VD. Life span extension by calorie restriction depends on Rim15 and transcription factors downstream of Ras/PKA, Tor, and Sch9. PLoS Genet. 2008; 4: e13 [PubMed] .
- 15. Wei M, Fabrizio P, Madia F, Hu J, Ge H, Li LM, Longo VD. Tor1/Sch9-regulated carbon source substitution is as effective as calorie restriction in life span extension. PLoS Genet. 2009; 5: e1000467 [PubMed] .
- 16. Stanfel MN, Shamieh LS, Kaeberlein M, Kennedy BK. The TOR pathway comes of age. Biochim Biophys Acta. 2009; 1790: 1067 -1074. [PubMed] .
- 17. Heeren G, Rinnerthaler M, Laun P, von Seyerl P, Kossler S, Klinger H, Hager M, Bogengruber E, Jarolim S, Simon-Nobbe B, Schuller C, Carmona-Gutierrez D, Breitenbach-Koller L, Muck C, Jansen-Durr P, Criollo A, et al. The mitochondrial ribosomal protein of the large subunit, Afo1p, determines cellular longevity through mitochondrial back-signaling via TOR1. Aging. 2009; 1: 622 -636. [PubMed] .
- 18. Pan Y and Shadel GS. Extension of chronological life span by reduced TOR signaling requires down-regulation of Sch9p and involves increased mitochondrial OXPHOS complex density. Aging. 2009; 1: 131 -145. [PubMed] .
- 19. Madia F, Wei M, Yuan V, Hu J, Gattazzo C, Pham P, Goodman MF, Longo VD. Oncogene homologue Sch9 promotes age-dependent mutations by a superoxide and Rev1/Polzeta-dependent mechanism. J Cell Biol. 2009; 186: 509 -523. [PubMed] .
- 20. Alvers AL, Wood MS, Hu D, Kaywell AC, Dunn WA Jr., Aris JP. Autophagy is required for extension of yeast chronological life span by rapamycin. Autophagy. 2009; 5: 847 -849. [PubMed] .
- 21. Parrella E and Longo VD. Insulin/IGF-I and related signaling pathways regulate aging in nondividing cells: from yeast to the mammalian brain. Scientific World Journal. 2010; 10: 161 -177. [PubMed] .
- 22. Pan Y, Schroeder EA, Ocampo A, Barrientos A, Shadel GS. Regulation of Yeast Chronological Life Span by TORC1 via Adaptive Mitochondrial ROS Signaling. Cell Metab. 2011; 13: 668 -678. [PubMed] .
- 23. Delaney JR, Murakami CJ, Olsen B, Kennedy BK, Kaeberlein M. Quantitative evidence for early life fitness defects from 32 longevity-associated alleles in yeast. Cell Cycle. 2011; 10: 156 -165. [PubMed] .
- 24. Powers RW 3rd, Kaeberlein M, Caldwell SD, Kennedy BK, Fields S. Extension of chronological life span in yeast by decreased TOR pathway signaling. Genes Dev. 2006; 20: 174 -184. [PubMed] .
- 25. Kapahi P, Zid BM, Harper T, Koslover D, Sapin V, Benzer S. Regulation of lifespan in Drosophila by modulation of genes in the TOR signaling pathway. Curr Biol. 2004; 14: 885 -890. [PubMed] .
- 26. Blagosklonny MV. Aging and immortality: quasi-programmed senescence and its pharmacologic inhibition. Cell Cycle. 2006; 5: 2087 -2102. [PubMed] .
- 27. Kapahi P, Chen D, Rogers AN, Katewa SD, Li PW, Thomas EL, Kockel L. With TOR, less is more: a key role for the conserved nutrient-sensing TOR pathway in aging. Cell Metab. 2010; 11: 453 -465. [PubMed] .
- 28. Kaeberlein M and Kennedy BK. Hot topics in aging research: protein translation and TOR signaling, 2010. Aging Cell. 2011; 10: 185 -190. [PubMed] .
- 29. Wood JG, Rogina B, Lavu S, Howitz K, Helfand SL, Tatar M, Sinclair D. Sirtuin activators mimic caloric restriction and delay ageing in metazoans. Nature. 2004; 430: 686 -689. [PubMed] .
- 30. Medvedik O, Lamming DW, Kim KD, Sinclair DA. MSN2 and MSN4 Link Calorie Restriction and TOR to Sirtuin-Mediated Lifespan Extension in Saccharomyces cerevisiae. PLoS Biol. 2007; 5: e261 [PubMed] .
- 31. Sinclair DA and Guarente L. Unlocking the secrets of longevity genes. Sci Am. 2006; 294: 48 -51. [PubMed] .
- 32. Kim D, Nguyen MD, Dobbin MM, Fischer A, Sananbenesi F, Rodgers JT, Delalle I, Baur JA, Sui G, Armour SM, Puigserver P, Sinclair DA, Tsai LH. SIRT1 deacetylase protects against neurodegeneration in models for Alzheimer's disease and amyotrophic lateral sclerosis. EMBO J. 2007; 26: 3169 -3179. [PubMed] .
- 33. Longo VD and Kennedy BK. Sirtuins in aging and age-related disease. Cell. 2006; 126: 257 -268. [PubMed] .
- 34. Firestein R, Blander G, Michan S, Oberdoerffer P, Ogino S, Campbell J, Bhimavarapu A, Luikenhuis S, de Cabo R, Fuchs C, Hahn WC, Guarente LP, Sinclair DA. The SIRT1 deacetylase suppresses intestinal tumorigenesis and colon cancer growth. PLoS One. 2008; 3: e2020 [PubMed] .
- 35. Blagosklonny MV, Campisi J, Sinclair DA, Bartke A, Blasco MA, Bonner WM, Bohr VA, Brosh RM Jr., Brunet A, Depinho RA, Donehower LA, Finch CE, Finkel T, Gorospe M, Gudkov AV, Hall MN, et al. Impact papers on aging in 2009. Aging. 2010; 2: 111 -121. [PubMed] .
- 36. Fontana L, Partridge L, Longo VD. Extending healthy life span–from yeast to humans. Science. 2010; 328: 321 -326. [PubMed] .
- 37. Baur JA, Chen D, Chini EN, Chua K, Cohen HY, de Cabo R, Deng C, Dimmeler S, Gius D, Guarente LP, Helfand SL, Imai S, Itoh H, Kadowaki T, Koya D, Leeuwenburgh C, et al. Dietary restriction: standing up for sirtuins. Science. 2010; 329: 1012 -1013. author reply 1013-1014. [PubMed] .
- 38. Haigis MC and Sinclair DA. Mammalian sirtuins: biological insights and disease relevance. Annu Rev Pathol. 2010; 5: 253 -295. [PubMed] .
- 39. Burtner CR, Murakami CJ, Kennedy BK, Kaeberlein M. A molecular mechanism of chronological aging in yeast. Cell Cycle. 2009; 8: 1256 -1270. [PubMed] .
- 40. Demidenko ZN and Blagosklonny MV. Growth stimulation leads to cellular senescence when the cell cycle is blocked. Cell Cycle. 2008; 7: 3355 -3361. [PubMed] .
- 41. Demidenko ZN, Zubova SG, Bukreeva EI, Pospelov VA, Pospelova TV, Blagosklonny MV. Rapamycin decelerates cellular senescence. Cell Cycle. 2009; 8: 1888 -1895. [PubMed] .
- 42. Demidenko ZN and Blagosklonny MV. Quantifying pharmacologic suppression of cellular senescence: prevention of cellular hypertrophy versus preservation of proliferative potential. Aging. 2009; 1: 1008 -1016. [PubMed] .
- 43. Pospelova TV, Demidenko ZN, Bukreeva EI, Pospelov VA, Gudkov AV, Blagosklonny MV. Pseudo-DNA damage response in senescent cells. Cell Cycle. 2009; 8: 4112 -4118. [PubMed] .
- 44. Demidenko ZN, Korotchkina LG, Gudkov AV, Blagosklonny MV. Paradoxical suppression of cellular senescence by p53. Proc Natl Acad Sci U S A. 2010; 9660-4: 9660 -9664. [PubMed] .
- 45. Korotchkina LG, Leontieva OV, Bukreeva EI, Demidenko ZN, Gudkov AV, Blagosklonny MV. The choice between p53-induced senescence and quiescence is determined in part by the mTOR pathway. Aging. 2010; 2: 344 -352. [PubMed] .
- 46. Leontieva OV and Blagosklonny MV. DNA damaging agents and p53 do not cause senescence in quiescent cells, while consecutive re-activation of mTOR is associated with conversion to senescence. Aging. 2010; 2: 924 -935. [PubMed] .
- 47. Leontieva O, Gudkov A, Blagosklonny M. Weak p53 permits senescence during cell cycle arrest. Cell Cycle. 2010; 9: 4323 -4327. [PubMed] .
- 48. Gems D. Ageing. Yeast longevity gene goes public. Nature. 2001; 410: 154 -155. [PubMed] .
- 49. Morselli E, Galluzzi L, Kepp O, Criollo A, Maiuri MC, Tavernarakis N, Madeo F, Kroemer G. Autophagy mediates pharmacological lifespan extension by spermidine and resveratrol. Aging. 2009; 1: 961 -970. [PubMed] .
- 50. Goldberg AA, Richard VR, Kyryakov P, Bourque SD, Beach A, Burstein MT, Glebov A, Koupaki O, Boukh-Viner T, Gregg C, Juneau M, English AM, Thomas DY, Titorenko VI. Chemical genetic screen identifies lithocholic acid as an anti-aging compound that extends yeast chronological life span in a TOR-independent manner, by modulating housekeeping longevity assurance processes. Aging. 2010; 2: 393 -414. [PubMed] .
- 51. Mirisola MG and Longo VD. Conserved role of Ras-GEFs in promoting aging: from yeast to mice. Aging. 2011; 3: 340 -343. [PubMed] .
- 52. Chang BD, Broude EV, Fang J, Kalinichenko TV, Abdryashitov R, Poole JC, Roninson IB. p21Waf1/Cip1/Sdi1-induced growth arrest is associated with depletion of mitosis-control proteins and leads to abnormal mitosis and endoreduplication in recovering cells. Oncogene. 2000; 19: 2165 -2170. [PubMed] .
- 53. Demidenko ZN, Shtutman M, Blagosklonny MV. Pharmacologic inhibition of MEK and PI-3K converges on the mTOR/S6 pathway to decelerate cellular senescence. Cell Cycle. 2009; 8: 1896 -1900. [PubMed] .
- 54. Demidenko ZN and Blagosklonny MV. Quantifying pharmacologic suppression of cellular senescence: prevention of cellular hypertrophy versus preservation of proliferative potential. Aging. 2009; 1: 1008 -1016. [PubMed] .
- 55. Blagosklonny MV. Cell cycle arrest is not senescence. Aging. 2011; 3: 94 -101. [PubMed] .
- 56. Blagosklonny MV. Aging: ROS or TOR. Cell Cycle. 2008; 7: 3344 -3354. [PubMed] .
- 57. Zhang L, Yu J, Park BH, Kinzler KW, Vogelstein B. Role of BAX in the apoptotic response to anticancer agents. Science. 2000; 290: 989 -992. [PubMed] .
- 58. Kuribayashi K, Finnberg N, Jeffers JR, Zambetti GP, El-Deiry WS. The relative contribution of pro-apoptotic p53-target genes in the triggering of apoptosis following DNA damage in vitro and in vivo. Cell Cycle. 2011; 10: 2380 -2389. [PubMed] .
- 59. Arsham AM, Howell JJ, Simon MC. A novel hypoxia-inducible factor-independent hypoxic response regulating mammalian target of rapamycin and its targets. J Biol Chem. 2003; 278: 29655 -29660. [PubMed] .
- 60. Brugarolas J, Lei K, Hurley RL, Manning BD, Reiling JH, Hafen E, Witters LA, Ellisen LW, Kaelin WG Jr. Regulation of mTOR function in response to hypoxia by REDD1 and the TSC1/TSC2 tumor suppressor complex. Genes Dev. 2004; 18: 2893 -2904. [PubMed] .
- 61. Kaeberlein M and Kapahi P. The hypoxic response and aging. Cell Cycle. 2009; 8: 2324 [PubMed] .
- 62. Diaz-Ruiz R, Rigoulet M, Devin A. The Warburg and Crabtree effects: On the origin of cancer cell energy metabolism and of yeast glucose repression. Biochim Biophys Acta. 2011; 1807: 568 -576. [PubMed] .
- 63. Ruckenstuhl C, Buttner S, Carmona-Gutierrez D, Eisenberg T, Kroemer G, Sigrist SJ, Frohlich KU, Madeo F. The Warburg effect suppresses oxidative stress induced apoptosis in a yeast model for cancer. PLoS One. 2009; 4: e4592 [PubMed] .
- 64. Gatenby RA and Gillies RJ. Why do cancers have high aerobic glycolysis? Nat Rev Cancer. 2004; 4: 891 -899. [PubMed] .
- 65. Martinez-Outschoorn UE, Lin Z, Ko YH, Goldberg AF, Flomenberg N, Wang C, Pavlides S, Pestell RG, Howell A, Sotgia F, Lisanti MP. Understanding the metabolic basis of drug resistance: Therapeutic induction of the Warburg effect kills cancer cells. Cell Cycle. 2011; 10: 2521 -2528. [PubMed] .
- 66. Murakami CJ, Wall V, Basisty N, Kaeberlein M. Composition and acidification of the culture medium influences chronological aging similarly in vineyard and laboratory yeast. PLoS One. 2011; 6: e24530 [PubMed] .
- 67. Fabrizio P, Battistella L, Vardavas R, Gattazzo C, Liou LL, Diaspro A, Dossen JW, Gralla EB, Longo VD. Superoxide is a mediator of an altruistic aging program in Saccharomyces cerevisiae. J Cell Biol. 2005; 166: 1055 -1067. [PubMed] .
- 68. Fabrizio P, Gattazzo C, Battistella L, Wei M, Cheng C, McGrew K, Longo VD. Sir2 blocks extreme life-span extension. Cell. 2005; 123: 655 -667. [PubMed] .
- 69. Janes MR and Fruman DA. Targeting TOR dependence in cancer. Oncotarget. 2010; 1: 69 -76. [PubMed] .
- 70. Martelli AM, Evangelisti C, Chiarini F, McCubrey JA. The phosphatidylinositol 3-kinase/Akt/mTOR signaling network as a therapeutic target in acute myelogenous leukemia patients. Oncotarget. 2010; 1: 89 -103. [PubMed] .
- 71. Luo J, Manning BD, Cantley LC. Targeting the PI3K-Akt pathway in human cancer: rationale and promise. Cancer Cell. 2003; 4: 257 -262. [PubMed] .
- 72. Zhang Z, Stiegler AL, Boggon TJ, Kobayashi S, Halmos B. EGFR-mutated lung cancer: a paradigm of molecular oncology. Oncotarget. 2010; 1: 497 -514. [PubMed] .
- 73. Nucera C, Lawler J, Hodin R, Parangi S. The BRAFV600E mutation: what is it really orchestrating in thyroid cancer? Oncotarget. 2010; 1: 751 -756. [PubMed] .
- 74. Choo AY and Blenis J. Not all substrates are treated equally: implications for mTOR, rapamycin-resistance and cancer therapy. Cell Cycle. 2009; 8: 567 -572. [PubMed] .
- 75. Carver BS, Chapinski C, Wongvipat J, Hieronymus H, Chen Y, Chandarlapaty S, Arora VK, Le C, Koutcher J, Scher H, Scardino PT, Rosen N, Sawyers CL. Reciprocal feedback regulation of PI3K and androgen receptor signaling in PTEN-deficient prostate cancer. Cancer Cell. 19: 575 -586. [PubMed] .
- 76. Rexer BN, Engelman JA, Arteaga CL. Overcoming resistance to tyrosine kinase inhibitors: lessons learned from cancer cells treated with EGFR antagonists. Cell Cycle. 2009; 8: 18 -22. [PubMed] .
- 77. Schmidt EV, Ravitz MJ, Chen L, Lynch M. Growth controls connect: interactions between c-myc and the tuberous sclerosis complex-mTOR pathway. Cell Cycle. 2009; 8: 1344 -1351. [PubMed] .
- 78. Markman B, Dienstmann R, Tabernero J. Targeting the PI3K/Akt/mTOR pathway–beyond rapalogs. Oncotarget. 2010; 1: 530 -543. [PubMed] .
- 79. Abrams SL, Steelman LS, Shelton JG, Wong EW, Chappell WH, Basecke J, Stivala F, Donia M, Nicoletti F, Libra M, Martelli AM, McCubrey JA. The Raf/MEK/ERK pathway can govern drug resistance, apoptosis and sensitivity to targeted therapy. Cell Cycle. 2010; 9: 1781 -1791. [PubMed] .
- 80. Novosyadlyy R and LeRoith D. Hyperinsulinemia and type 2 diabetes: impact on cancer. Cell Cycle. 2010; 9: 1449 -1450. [PubMed] .
- 81. Zhao L and Vogt PK. Hot-spot mutations in p110alpha of phosphatidylinositol 3-kinase (pI3K): differential interactions with the regulatory subunit p85 and with RAS. Cell Cycle. 2010; 9: 596 -600. [PubMed] .
- 82. Shahbazian D, Parsyan A, Petroulakis E, Hershey J, Sonenberg N. eIF4B controls survival and proliferation and is regulated by proto-oncogenic signaling pathways. Cell Cycle. 2010; 9: 4106 -4109. [PubMed] .
- 83. Hay N. The Akt-mTOR tango and its relevance to cancer. Cancer Cell. 2005; 8: 179 -183. [PubMed] .
- 84. Sun Q, Chen X, Ma J, Peng H, Wang F, Zha X, Wang Y, Jing Y, Yang H, Chen R, Chang L, Zhang Y, Goto J, Onda H, Chen T, Wang MR, et al. Mammalian target of rapamycin up-regulation of pyruvate kinase isoenzyme type M2 is critical for aerobic glycolysis and tumor growth. Proc Natl Acad Sci U S A. 2011; 108: 4129 -4134. [PubMed] .
- 85. Duvel K, Yecies JL, Menon S, Raman P, Lipovsky AI, Souza AL, Triantafellow E, Ma Q, Gorski R, Cleaver S, Vander Heiden MG, MacKeigan JP, Finan PM, Clish CB, Murphy LO, Manning BD. Activation of a metabolic gene regulatory network downstream of mTOR complex 1. Mol Cell. 39: 171 -183. [PubMed] .
- 86. Pinkston JM, Garigan D, Hansen M, Kenyon C. Mutations that increase the life span of C. elegans inhibit tumor growth. Science. 2006; 313: 971 -975. [PubMed] .
- 87. Blagosklonny MV and Hall MN. Growth and aging: a common molecular mechanism. Aging. 2009; 1: 357 -362. [PubMed] .
- 88. Blagosklonny MV. Revisiting the antagonistic pleiotropy theory of aging: TOR-driven program and quasi-program. Cell Cycle. 2010; 9: 3151 -3156. [PubMed] .
- 89. Matheu A, Maraver A, Klatt P, Flores I, Garcia-Cao I, Borras C, Flores JM, Vina J, Blasco MA, Serrano M. Delayed ageing through damage protection by the Arf/p53 pathway. Nature. 2007; 448: 375 -379. [PubMed] .
- 90. Vigneron A and Vousden KH. p53, ROS and senescence in the control of aging. Aging. 2010; 2: 471 -474. [PubMed] .
- 91. Poyurovsky MV and Prives C. P53 and aging: A fresh look at an old paradigm. Aging. 2010; 2: 380 -382. [PubMed] .
- 92. Serrano M. Shifting senescence into quiescence by turning up p53. Cell Cycle. 2010; 9: 4256 -4257. [PubMed] .
- 93. Galluzzi L, Kepp O, Kroemer G. TP53 and MTOR crosstalk to regulate cellular senescence. Aging. 2010; 2: 535 -537. [PubMed] .
- 94. Chan FH, Carl D, Lyckholm LJ. Severe lactic acidosis in a patient with B-cell lymphoma: a case report and review of the literature. Case Report Med. 2009; 2009: 534561 [PubMed] .
- 95. Dogan E, Erkoc R, Sayarlioglu H, Alici S, Dilek I, Alici O. Fatal lactic acidosis due to leukemic transformation in a patient with non-Hodgkin's lymphoma: case report. Adv Ther. 2005; 22: 443 -446. [PubMed] .
- 96. Feron O. Pyruvate into lactate and back: from the Warburg effect to symbiotic energy fuel exchange in cancer cells. Radiother Oncol. 2009; 92: 329 -333. [PubMed] .
- 97. Pavlides S, Whitaker-Menezes D, Castello-Cros R, Flomenberg N, Witkiewicz AK, Frank PG, Casimiro MC, Wang C, Fortina P, Addya S, Pestell RG, Martinez-Outschoorn UE, Sotgia F, Lisanti MP. The reverse Warburg effect: aerobic glycolysis in cancer associated fibroblasts and the tumor stroma. Cell Cycle. 2009; 8: 3984 -4001. [PubMed] .
- 98. Migneco G, Whitaker-Menezes D, Chiavarina B, Castello-Cros R, Pavlides S, Pestell RG, Fatatis A, Flomenberg N, Tsirigos A, Howell A, Martinez-Outschoorn UE, Sotgia F, Lisanti MP. Glycolytic cancer associated fibroblasts promote breast cancer tumor growth, without a measurable increase in angiogenesis: evidence for stromal-epithelial metabolic coupling. Cell Cycle. 2010; 9: 2412 -2422. [PubMed] .
- 99. Bonuccelli G, Tsirigos A, Whitaker-Menezes D, Pavlides S, Pestell RG, Chiavarina B, Frank PG, Flomenberg N, Howell A, Martinez-Outschoorn UE, Sotgia F, Lisanti MP. Ketones and lactate “fuel” tumor growth and metastasis: Evidence that epithelial cancer cells use oxidative mitochondrial metabolism. Cell Cycle. 2010; 9: 3506 -3514. [PubMed] .