


Introduction
Globally, gastric and esophageal cancers were ranked as the fourth and sixth leading causes of cancer-related deaths, and were responsible for 769,000 and 544,000 deaths in 2020, respectively [1]. Given the advanced or metastatic nature of many gastroesophageal cases at diagnosis, the overall 5-year survival rate remains less than 20% in developing countries [2, 3]. The main factors affecting gastroesophageal cancers prognosis include tumor staging and grading, treatment method, living condition, and genetic marker [4, 5]. However, as a transitional region tumor from esophageal squamous epithelium to the gastric adenoid epithelium, it is possible that the oncological principles for esophageal and gastric cancer are not directly applicable to junctional cancer [6].
Accumulating studies reveal that the molecular characteristics, pathological course, and clinical behavior of junctional cancer differ from that of gastric and esophageal cancer [7]. Junctional cancer primarily refers to adenocarcinoma of the esophagogastric junction (AEGJ). It is based on Siewert’s anatomical classification criteria and includes distal esophageal adenocarcinoma (EAC), cardiac cancer, and proximal gastric adenocarcinoma (GAC) [8]. The AEGJ incidence has risen rapidly in East Asia, North America, and Europe over the last few decades [9]. As the early symptoms are not obvious with a rapid progression, AEGJ is usually diagnosed in the late stages and has a 5-year survival rate of ~6% in the developing world [10]. Therefore, there is an urgent need to identify potential molecular markers to predict and improve the prognosis.
A specific component of the tumor immune microenvironment (TME), tumor-infiltrating lymphocytes (TILs) are reflective of host-tumor immune interactions and are predictive of patient prognosis [11, 12]. TILs primarily include T and B cells, and natural killer (NK) cells, which cooperate with tumor cells by releasing chemokines and cytokines that act as important tumorigenic and prognostic factors and determine tumor progression and aggressiveness [13]. Different cancer types have distinct TME, where numerous clinical studies that evaluated the TIL content in breast carcinoma, colorectal carcinoma, and non-small cell lung carcinoma reported that higher TIL infiltration conferred a significant survival benefit [14–16]. Besides, the observation of the variations in TILs levels can recognize the population or cancer types with a high likelihood of reacting to immunotherapy [13]. However, there are few studies focusing on the characteristics of tumor-infiltrating lymphocytes (TILs) in esophagogastric tumors and their potential as prognostic markers to predict and improve survival in AEGJ patients. Additionally, the association between TILs and survival in esophageal squamous cell carcinoma (ESCC) and GAC remains controversial [17, 18].
Although the gold standard for evaluating TILs is based on routine haematoxylin–eosin (H&E) staining using a semi-quantitative scoring method, it may be subject to interobserver variability and costly [19]. Computational pathology has currently displayed promise in recognizing the biomarkers in tissues, and overcomes limitations related with manual grading and human bias [20]. Therefore, we establish cellular training sets for AEGJ, GAC, and ESCC based on the assessment of experienced pathologists. Then, quantification of the TILs on H&E staining sections using an open-source image processing tool that operates with minimal user intervention. We compared the AEGJ TILs characteristics with that of GAC and ESCC under demographic factors and clinical traits. We also examined the association of auto-assessed TILs as a quantitative variable with overall survival in both large datasets.
Results
Demographic information
Table 1 displays the demographic information of the 214 AEGJ, 256 GAC, and 752 ESCC cases included in the analysis. There were significant differences between AEGJ, GAC, and ESCC for age, sex, tea drinking, wealth score, first-line treatment method, TNM staging, tumor differentiation grade, Helicobacter pylori (HP) infection status, and gastric atrophy (all P < 0.05). Compared with ESCC and GAC, AEGJ cases were more likely to be older (mean age: 69.23 years), drink less tea (77.10%), have positive HP status (78.50%), receive combination therapy (24.30%), have advanced TNM stage (28.97%), and have gastric atrophy (25.23%).
Table 1. Demographic information of 214 AEGJ, 256 GAC, and 752 ESCC cases in Taixing (2010–2014).
| Variables | AEGJ (n = 214), N (%) | GAC (n = 256), N (%) | ESCC (n = 752), N (%) | P-value |
| Age, mean ± SD, years | 69.23 (7.61) | 67.52 (9.56) | 66.96 (8.50) | 0.002 |
| Age (years) | ||||
| <60 | 22 (10.28) | 57 (22.27) | 140 (18.62) | 0.002 |
| ≥60 | 192 (89.72) | 199 (77.73) | 612 (81.38 | |
| Sex | 0.027 | |||
| Man | 152 (71.03) | 189 (73.83) | 492 (65.43) | |
| Woman | 62 (28.97) | 67 (26.17) | 260 (34.57) | |
| Marriage | 0.089 | |||
| Unmarried | 12 (5.61) | 9 (3.52) | 25 (3.32) | |
| Married | 153 (71.50) | 186 (72.66) | 591 (78.59) | |
| Divorce/widow | 49 (22.90) | 61 (23.83) | 136 (18.09) | |
| Educational level | 0.302 | |||
| Illiteracy | 74 (35.58) | 80 (31.25) | 276 (36.70) | |
| Primary or Secondary school | 129 (60.28) | 158 (61.72) | 429 (57.05) | |
| High school and above | 11 (5.14) | 18 (7.03) | 47 (6.25) | |
| Cigarette smoking | 0.820 | |||
| Never | 86 (40.19) | 103 (40.23) | 313 (41.62) | |
| Ever or still | 120 (56.07) | 144 (56.25) | 405 (53.86) | |
| Missing | 8 (3.74) | 9 (3.52) | 34 (4.52) | |
| Alcohol drinking | 0.075 | |||
| Never | 121 (56.54) | 125 (48.83) | 351 (46.68) | |
| Ever or still | 88 (41.12) | 122 (47.66) | 366 (48.67) | |
| Missing | 5 (2.34) | 9 (3.52) | 35 (4.65) | |
| Tea drinking | 0.013 | |||
| Never | 165 (77.10) | 170 (66.41) | 493 (65.56) | |
| Ever | 44 (20.56) | 77 (30.08) | 225 (29.92) | |
| Missing | 5 (2.34) | 9 (3.52) | 34 (4.52) | |
| Fruit intake (g/d) | 0.513 | |||
| <25 | 110 (51.40) | 136 (53.13) | 417 (55.16) | |
| ≥25 | 91 (42.52) | 102 (39.84) | 288 (38.10) | |
| Missing | 13 (6.07) | 18 (7.03) | 47 (6.22) | |
| Pickles intake (g/d) | 0.914 | |||
| <10 | 124 (57.94) | 141 (55.08) | 419 (55.72) | |
| ≥10 | 80 (37.38) | 98 (38.28) | 288 (38.30) | |
| Missing | 10 (4.67) | 17 (6.64) | 45 (5.98) | |
| BMI | 0.350 | |||
| <18.5 | 27 (12.62) | 32 (12.50) | 85 (11.30) | |
| 18.5–24 | 140 (65.42) | 158 (61.72) | 466 (61.97) | |
| ≥24 | 46 (21.50) | 66 (25.78) | 201 (26.73) | |
| Missing | 1 (0.47) | 0 (0.00) | 0 (0.00) | |
| Wealth scores | 0.003 | |||
| Q1 | 62 (28.97) | 52 (20.31) | 232 (30.85) | |
| Q2 | 45 (21.03) | 55 (21.48) | 139 (18.48) | |
| Q3 | 38 (17.76) | 62 (24.42) | 161 (21.41) | |
| Q4 | 43 (20.09) | 47 (18.36) | 138 (18.35) | |
| Q5 | 26 (12.15) | 40 (15.63) | 62 (8.24) | |
| First-line treatment method | <0.001 | |||
| Radiotherapy | 9 (4.21) | 9 (3.52) | 88 (11.70) | |
| Chemotherapy | 21 (9.81) | 27 (10.55) | 93 (12.37) | |
| Surgery | 116 (54.21) | 151 (58.98) | 377 (50.13) | |
| Combination therapy | 52 (24.30) | 57 (22.27) | 170 (22.61) | |
| Untreated | 14 (6.54) | 11 (4.30) | 21 (2.79) | |
| Missing | 2 (0.93) | 1 (0.39) | 3 (0.40) | |
| TNM staging | 0.004 | |||
| 0+I+II | 55 (25.70) | 98 (38.28) | 256 (30.04) | |
| III+IV | 62 (28.97) | 50 (19.53) | 162 (21.54) | |
| Missing | 97 (45.33) | 108 (42.19) | 334 (44.41) | |
| Grade of differentiation | 0.036 | |||
| Gx Grading cannot be evaluated | 36 (16.82) | 47 (18.36) | 40 (5.32) | |
| G1 Highly differentiated | 4 (0.53) | 7 (2.73) | 60 (7.98) | |
| G2 Medium differentiation | 63 (29.44) | 63 (24.61) | 452 (60.11) | |
| G3 Poorly differentiated | 29 (13.55) | 48 (18.75) | 134 (17.82) | |
| G4 Undifferentiated | 11 (5.14) | 9 (3.52) | 45 (5.98) | |
| Missing | 71 (33.18) | 82 (32.03) | 21 (2.79) | |
| Helicobacter pylori | 0.001 | |||
| HP+ | 168 (78.50) | 181 (70.70) | 484 (64.36) | |
| HP− | 42 (19.63) | 68 (26.56) | 234 (31.12) | |
| Missing | 4 (1.87) | 7 (2.73) | 34 (4.52) | |
| Gastric atrophy | <0.001 | |||
| Yes | 54 (25.23) | 51 (19.92) | 98 (13.03) | |
| No | 131 (61.21) | 157 (61.33) | 520 (69.15) | |
| Missing | 29 (13.55) | 157 (61.33) | 134 (17.82) |
Automated cellular recognition accuracy
We obtained the matched H&E-stained images of 214 AEGJ, 256 GAC, and 752 ESCC cases, each of which was from a solid tumor cross-section. The image processing approach automatically segmented the images and classified the cellular components into cancer cells, lymphocytes, and stromal cells. The classification was based on cellular training sets using an SVM classifier that pathologists had trained according to the cell features (Figure 1A). Cross-validation within the cellular training sets of the three cancers yielded overall classification accuracy of >87.55% (Supplementary Table 1). Furthermore, the overall correlation coefficients between automated recognition and the pathologists’ quantitative assessment of AEGJ, GAC, and ESCC were 0.92, 0.93, and 0.93, respectively, and the TILs correlation coefficients were 0.94, 0.95, and 0.95, respectively. The correlation coefficients of the cancer cells and stromal cells were all >0.86 (Figure 1B; Supplementary Figure 1A, 1B). Furthermore, the automated recognition of the TILs proportion in AEGJ, GAC, and ESCC was consistent with the manual grading, and all Jonckheere-Terpstra tests yielded P = 0.001 (Figure 1C; Supplementary Figure 1C, 1D). The AEGJ, GAC, and ESCC cellular training sets are provided in the Supplementary Datasets 1–3.
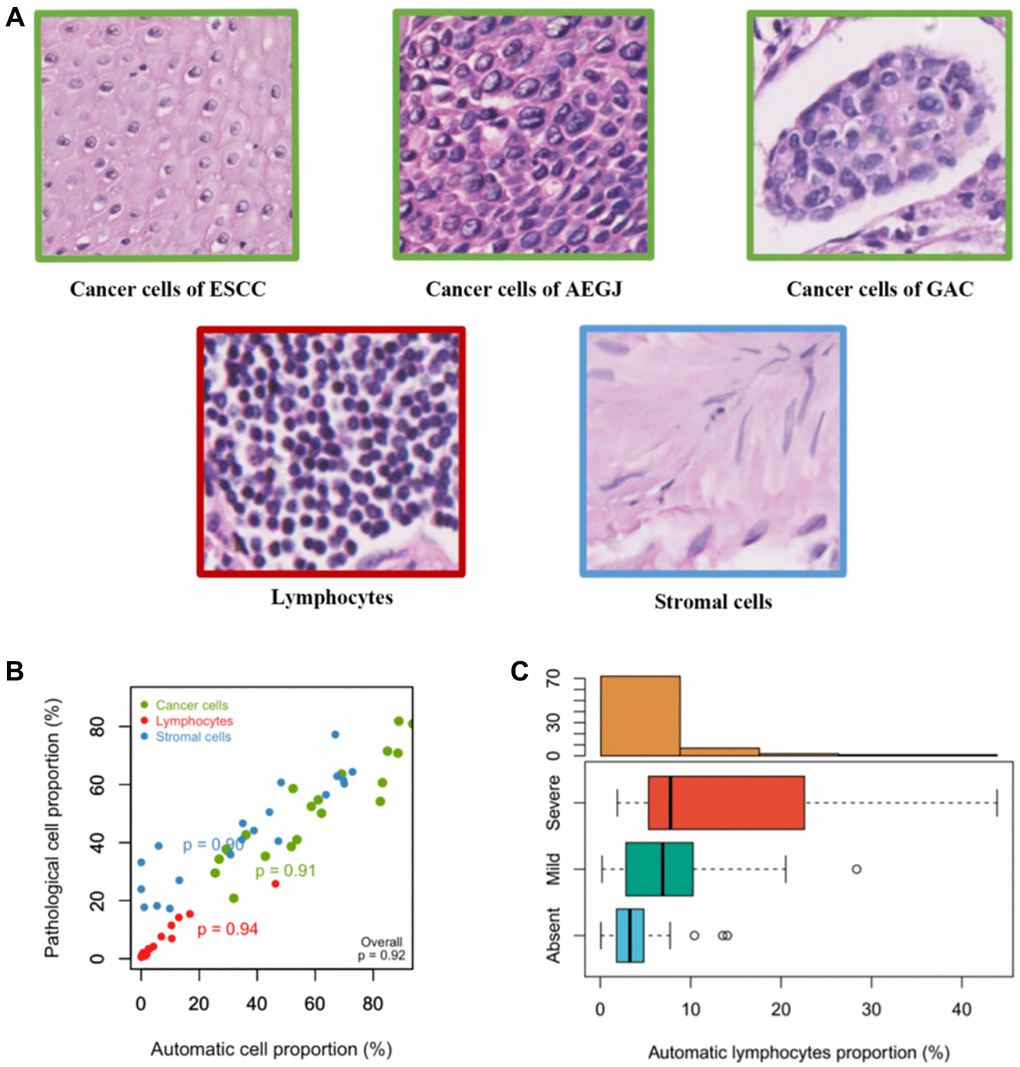
Figure 1. Establishment and verifications of the cell training set in AEGJ. (A) Example images of the three classes used in the classifier: cancer cells, lymphocytes, and stromal cells. (B) Cell proportions obtained by automated image analysis were compared to pathologists’ counts for a total of 10,000 single cells in a representative set of 20 tissue samples within AEGJ. (C) TILs proportions versus manual grading for AEGJ TIL infiltration in random one-third samples.
The auto-quantified TILs characteristics in AEGJ, GAC, and ESCC
Based on the cellular training sets, we extracted the TILs proportions of 214 AEGJ, 256 GAC, and 752 ESCC cases. The examples of low, medium, and high TILs intensity circled by blue in ESCC, AEGJ, and GAC H&E-stained tissue sections and their raw images were displayed (Figure 2A–2I and Supplementary Figure 2A–2I). The association between TILs proportion and demographic information of the above three gastroesophageal cancers was listed in Table 2. In the AEGJ cases, the TILs percentage was associated with the first-line treatment method (P = 0.030), and the patients with the combination therapy (median TILs: 5.72%) had the highest TILs proportion compared to radiotherapy (median TILs: 1.83%), chemotherapy (median TILs: 4.10%), and surgery (median TILs: 2.77%). A similar association between TILs and the first-line treatment method had also discovered in GAC patients (P = 0.031). Besides, the GAC patients drinking more tea (median TILs: 2.74%) were more likely to have a higher TILs proportion (P = 0.028). In the ESCC cases, the patients eating fewer pickles (median TILs: 0.15%) were more likely to have a higher TILs level (P = 0.002), and the trend tests demonstrated the TILs proportion increased with the BMI ranks (P = 0.008).
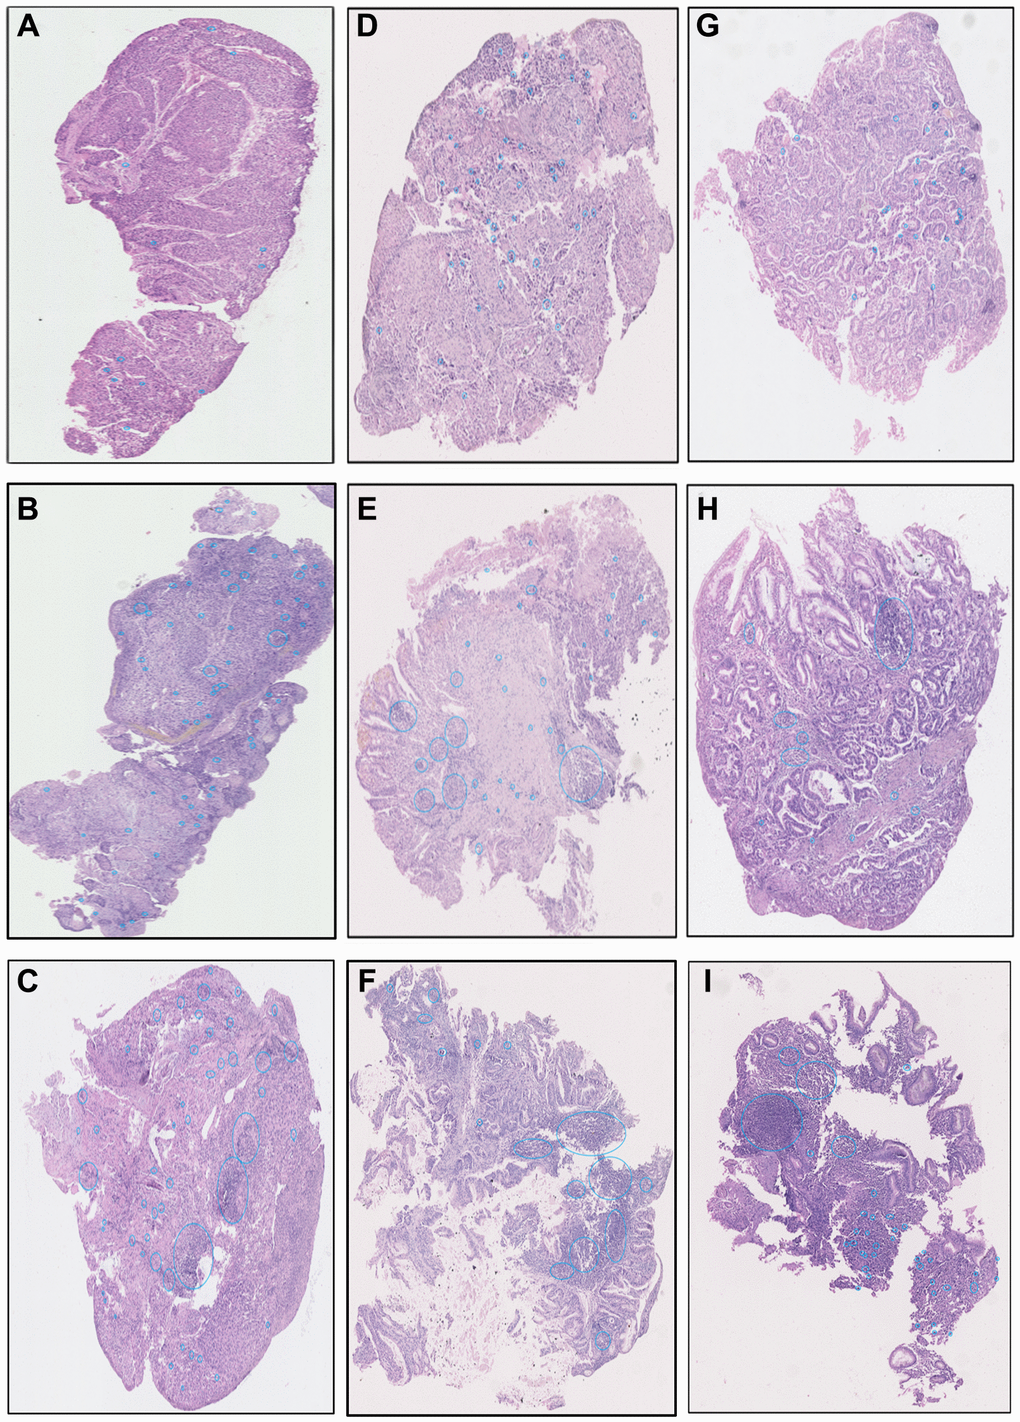
Figure 2. The examples images of low, medium, and high TILs intensity in ESCC (A–C), AEGJ (D–F), and GAC (G–I) H&E-stained tissue sections (H&E×200).
Table 2. The association between TILs proportion and demographic information of AEGJ, GAC, and ESCC cases in Taixing.
| Variables | TILs (%) in AEGJ (n = 214) | TILs (%) in GAC (n = 256) | TILs (%) in ESCC (n = 752) | |||
| Median (IQR) | P-value | Median (IQR) | P-value | Median (IQR) | P-value | |
| Age (years) | 0.775 | 0.711 | 0.090 | |||
| <60 | 3.82 (1.57, 11.05) | 1.86 (0.16, 9.16) | 0.15 (0.03, 0.92) | |||
| ≥60 | 4.88 (2.01, 11.21) | 1.93 (0.47, 8.16) | 0.12 (0.02, 0.73) | |||
| Sex | 0.479 | 0.096 | 0.437 | |||
| Man | 4.55 (1.71, 10.80) | 2.38 (0.52, 9.14) | 0.12 (0.02, 0.67) | |||
| Woman | 5.19 (2.41, 12.45) | 1.27 (0.30, 6.54) | 0.13 (0.02, 1.10) | |||
| Marriage | 0.779 | 0.702 | 0.295 | |||
| Unmarried | 8.02 (1.91, 11.32) | 1.14 (0.43, 1.81) | 0.11 (0.03, 0.43) | |||
| Married | 4.60 (1.86, 10.42) | 2.36 (0.41, 9.30) | 0.12 (0.02, 0.75) | |||
| Divorce/widow | 5.19 (2.52, 13.93) | 2.18 (0.52, 3.55) | 0.17 (0.03, 0.76) | |||
| Educational level | 0.455 | 0.108 | 0.868 | |||
| Illiteracy | 5.19 (2.58, 11.06) | 1.16 (0.35, 4.48) | 0.11 (0.02, 0.79) | |||
| Primary or Secondary school | 4.65 (1.66, 11.30) | 2.50 (0.70, 10.43) | 0.13 (0.02, 0.74) | |||
| High school and above | 3.23 (1.09, 7.31) | 3.09 (0.11, 10.14) | 0.12 (0.02, 0.92) | |||
| Cigarette smoking | 0.683 | 0.025 | 0.173 | |||
| Never | 4.34 (1.35, 13.89) | 1.16 (0.21, 7.54) | 0.13 (0.02, 1.06) | |||
| Ever or still | 4.95 (2.38, 10.50) | 2.49 (0.72, 9.43) | 0.11 (0.02, 0.63) | |||
| Missing | NA | NA | NA | |||
| Alcohol drinking | 0.357 | 0.432 | 0.252 | |||
| Never | 5.42 (1.86, 13.35) | 1.59 (0.36, 7.99) | 0.13 (0.02, 0.91) | |||
| Ever or still | 4.17 (2.20, 9.41) | 2.38 (0.51, 8.99) | 0.11 (0.02, 0.64) | |||
| Missing | NA | NA | NA | |||
| Tea drinking | 0.271 | 0.028 | 0.997 | |||
| Never | 4.65 (1.56, 11.01) | 1.51 (0.29, 7.93) | 0.12 (0.02, 0.72) | |||
| Ever | 5.36 (3.02, 11.11) | 2.74 (1.14, 10.47) | 0.12 (0.02, 0.75) | |||
| Missing | NA | NA | NA | |||
| Fruit intake (g/d) | 0.613 | 0.788 | 0.623 | |||
| <25 | 4.30 (2.07, 10.41) | 2.23 (0.47, 7.80) | 0.13 (0.02, 0.79) | |||
| ≥25 | 5.23 (1.51, 12.34) | 1.90 (0.37, 9.58) | 0.10 (0.02, 0.67) | |||
| Missing | NA | NA | NA | |||
| Pickles intake (g/d) | 0.091 | 0.164 | 0.002 | |||
| <10 | 5.12 (1.63, 16.54) | 2.40 (0.51, 9.14) | 0.15 (0.03, 0.96) | |||
| ≥10 | 3.95 (2.29, 9.66) | 1.39 (0.36, 6.21) | 0.08 (0.02, 0.47) | |||
| Missing | NA | NA | NA | |||
| BMI | 0.737 | 0.700 | 0.039 | |||
| <18.5 | 5.02 (1.32, 8.99) | 1.83 (0.33, 6.88) | 0.08 (0.02, 0.56) | |||
| 18.5–24 | 4.56 (1.99, 11.21) | 2.34 (0.51, 8.08) | 0.11 (0.02, 0.62) | |||
| ≥24 | 4.97 (2.09, 10.82) | 1.86 (0.43, 9.15) | 0.23 (0.02, 1.20) | |||
| Missing | NA | NA | NA | |||
| Wealth scores | 0.124 | 0.707 | 0.085 | |||
| Q1 | 4.99 (2.47, 11.56) | 2.13 (0.37, 8.91) | 0.12 (0.02, 0.69) | |||
| Q2 | 2.94 (1.36, 5.60) | 1.27 (0.36, 4.56) | 0.13 (0.02, 0.96) | |||
| Q3 | 5.22 (2.24, 13.93) | 2.55 (0.38, 12.08) | 0.09 (0.01, 0.45) | |||
| Q4 | 4.26 (1.23, 10.69) | 2.38 (0.67, 10.67) | 0.13 (0.02, 0.51) | |||
| Q5 | 5.71 (3.41, 13.55) | 2.41 (0.93, 4.74) | 0.25 (0.03, 2.05) | |||
| First-line treatment method | 0.030 | 0.031 | 0.262 | |||
| Radiotherapy | 1.83 (1.05, 3.49) | 0.66 (0.18, 1.61) | 0.03 (0.02, 0.43) | |||
| Chemotherapy | 4.10 (1.56, 5.30) | 1.32 (0.30, 13.71) | 0.10 (0.02, 0.48) | |||
| Surgery | 2.77 (0.40, 7.72) | 0.82 (0.27, 2.74) | 0.09 (0.02, 0.68) | |||
| Combination therapy | 5.72 (3.14, 11.94) | 2.78 (0.73, 11.12) | 0.15 (0.03, 0.80) | |||
| Untreated | 4.64 (1.81, 10.42) | 1.32 (0.35, 3.21) | 0.10 (0.02, 0.92) | |||
| Missing | NA | NA | NA | |||
| TNM staging | 0.750 | 0.841 | 0.996 | |||
| 0+I+II | 6.92 (3.12, 13.39) | 2.64 (0.49, 10.91) | 0.14 (0.02, 0.76) | |||
| III+IV | 5.34 (2.99, 11.56) | 2.47 (0.74, 11.12) | 0.15 (0.02, 0.92) | |||
| Missing | NA | NA | NA | |||
| Grade of differentiation | 0.207 | 0.930 | 0.954 | |||
| Gx Grading cannot be evaluated | 4.04 (1.77, 12.42) | 2.38 (0.82, 10.20) | 0.16 (0.02, 1.30) | |||
| G1 Highly differentiated | 8.67 (2.55, 14.28) | 1.60 (0.68, 10.19) | 0.13 (0.03, 0.69) | |||
| G2 Medium differentiation | 7.72 (3.89, 13.39) | 2.78 (1.13, 9.15) | 0.13 (0.02, 0.84) | |||
| G3 Poorly differentiated | 7.17 (1.97, 12.81) | 2.10 (0.26, 11.47) | 0.11 (0.02, 0.56) | |||
| G4 Undifferentiated | 4.34 (2.42, 5.17) | 0.85 (0.35, 3.50) | 0.13 (0.05, 0.35) | |||
| Missing | NA | NA | NA | |||
| Helicobacter pylori | 0.599 | 0.721 | 0.707 | |||
| HP+ | 5.24 (2.99, 11.10) | 1.83 (0.39, 6.87) | 0.12 (0.02, 0.60) | |||
| HP− | 4.62 (1.84, 11.24) | 2.28 (0.45, 9.66) | 0.13 (0.02, 0.77) | |||
| Missing | NA | NA | NA | |||
| Gastric atrophy | 0.475 | 0.167 | 0.589 | |||
| Yes | 4.96 (1.92, 10.58) | 2.40 (0.73, 10.68) | 0.12 (0.02, 0.73) | |||
| No | 4.34 (1.46, 11.06) | 1.31 (0.36, 6.32) | 0.09 (0.02, 0.42) | |||
| Missing | NA | NA | NA | |||
The distribution of auto-quantified TILs proportion
We performed a crude comparison of the AEGJ TILs proportion with that of ESCC and GAC by The Kruskal-Wallis H test. The differences in the TILs proportions were statistically significant (P < 0.001). The multiple comparisons corrected by the Bonferroni method found that the AEGJ cases had the highest TILs proportion (median, 4.82%), followed by GAC (median, 1.92%), and that of ESCC was the lowest (median, 0.12%) (Supplementary Figure 3). However, lymphocyte infiltration is associated with age, sex, BMI, TNM staging, tumor differentiation grade, and first-line treatment method [21–23]. Hence, based on the above factors and the demographic information that differed among the three cancers, we compared the TILs proportion between these three cancers within each factor. The result revealed that significantly different among the above cancers still existed (Supplementary Table 2; all P < 0.001). Moreover, the distribution of auto-quantified TILs proportion was tested with Spearman correlation analysis and multi-variable linear regression. After adding the cancer type as a variable to the analysis-adjusted covariates, cancer type remained associated with TILs proportion (Table 3; ρ = 0.49; P < 0.001). The standardised effects of AEGJ and GAC were 0.36 and 0.28, respectively (Table 3; R2 = 0.204; adjusted R2 = 0.179; P < 0.001). This indicated that the cancer type contributed considerably to explaining variations in the distribution of auto-assessed TILs proportion. We also determined that the cancer type is AEGJ had the most influence on TILs proportion compared with GAC and ESCC.
Table 3. Multi-variable linear regression analysis of the association between factors and TILs proportion.
| Variables | Correlation coefficient | Unstandardized coefficient (B) | Standardized coefficient (Beta) | P-value | |
| B (95% CI) | SE | ||||
| Age | |||||
| <60 | 0.01 | Ref. | |||
| ≥60 | −0.03 (−1.62, 1.57) | 0.81 | −0.01 | 0.975 | |
| Sex | |||||
| Woman | −0.03 | Ref. | |||
| Man | −0.06 (−1.54, 1.43) | 0.75 | 0.00 | 0.942 | |
| BMI | |||||
| <18.5 | 0.04 | Ref. | |||
| 18.5–24 | 0.36 (−1.72, 2.44) | 1.06 | 0.02 | 0.734 | |
| ≥24 | 0.50 (−1.77, 2.78) | 1.16 | 0.03 | 0.664 | |
| Helicobacter pylori | |||||
| HP− | 0.06 | Ref. | |||
| HP+ | 0.21 (−1.22, 1.63) | 0.73 | 0.01 | 0.776 | |
| Pickles intake | |||||
| <10 | 0.04 | Ref. | |||
| ≥10 | −1.20 (−2.51, 0.11) | 0.67 | −0.07 | 0.07 | |
| Tea drinking | |||||
| Never | 0.00 | Ref. | |||
| Ever | 0.28 (−1.26, 1.83) | 0.79 | 0.01 | 0.721 | |
| First-line treatment method | |||||
| Untreated | 0.06 | Ref. | |||
| Radiotherapy | −13.94 (−22.20, −5.67) | 4.21 | −0.39 | 0.001 | |
| Chemotherapy | −14.42 (−22.58, −6.26) | 4.15 | −0.46 | 0.001 | |
| Surgery | −13.52 (−21.40, −5.63) | 4.01 | −0.74 | 0.001 | |
| Combination therapy | −13.85 (−21.81, −5.88) | 4.06 | −0.64 | 0.001 | |
| Grade of differentiation | |||||
| G1 Highly differentiated | −0.06 | Ref. | |||
| G2 Medium differentiation | −0.03 (−2.53, 2.47) | 1.27 | −0.00 | 0.981 | |
| G3 Poorly differentiated | 0.51 (−2.35, 3.38) | 1.46 | 0.02 | 0.725 | |
| G4 Undifferentiated | −1.46 (−4.87, 1.95) | 1.74 | −0.05 | 0.401 | |
| Gx Grading cannot be evaluated | 1.21 (−2.39, 4.81) | 1.83 | 0.03 | 0.510 | |
| TNM staging | |||||
| 0+I+II | 0.03 | Ref. | |||
| III+IV | 0.21 (−1.24, 1.66) | 0.74 | 0.01 | 0.776 | |
| Cancer type | |||||
| ESCC | 0.49 | Ref. | |||
| GAC | 6.07 (4.32, 7.82) | 0.89 | 0.28 | <0.001 | |
| AEGJ | 8.28 (6.45, 10.12) | 0.94 | 0.36 | <0.001 | |
| Summary | R2 = 0.204 | Adjusted R2 = 0.179 | <0.001 | ||
The prognostic value of auto-quantified TILs proportion in AEGJ, GAC, and ESCC
To explore whether there was a prognostic value of the auto-assessed TILs proportion in AEGJ, GAC, and ESCC, we utilized the cases from Taixing as discovery (Taixing: 214 AEGJ, 256 GAC, and 752 ESCC cases) and these of TCGA as validation (TCGA: 169 AEGJ, 222 GAC, and 70 ESCC cases). The AEGJ, GAC, and ESCC cases from the Taixing dataset were divided into high- and low-TIL groups using median TILs proportions of 4.82%, 1.92%, and 0.12% as cut-offs, respectively. The AEGJ, GAC, and ESCC cases from the TCGA dataset were divided using median TILs proportions of 1.99%, 4.14%, and 32.40%, respectively, as cut-offs, and evaluated the prognostic value in both datasets. Kaplan-Meier plots were generated to compare the OS based on high and low TILs proportions. There were statistically significant associations between better OS and higher TILs proportion in the three cancers of the Taixing dataset (Figure 3A, 3C, 3E; all P < 0.001). As validation, we also identified statistically significant differences in OS between the high- and low-groups of the TCGA dataset (Figure 3B, 3D, 3F; all P < 0.05).
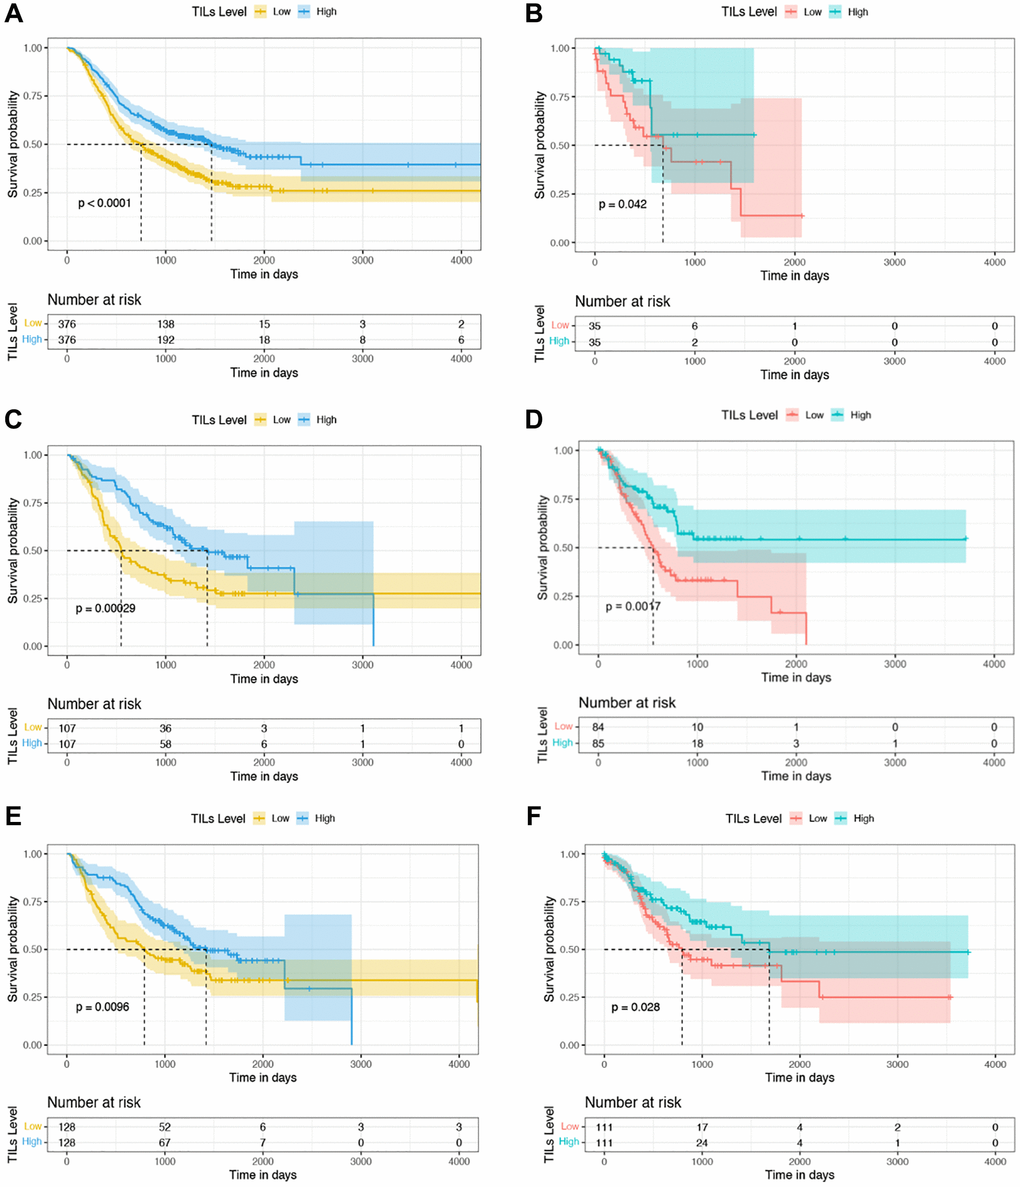
Figure 3. Kaplan-Meier curves of OS based on TILs proportion in the discovery and validation datasets. (A, C, E) Survival analysis between the high- and low-TILs groups in 752 ESCC, 214 AEGJ, and 256 GAC cases in Taixing, China, 2010–2014. (B, D, F) Survival analysis between the high- and low-TILs groups in 70 ESCC, 169 AEGJ, and 222 GAC cases of the TCGA dataset.
We further examined the independent prognostic value of the auto-quantified TILs proportion. A multivariable Cox regression analysis was performed on the discovery and validation. In discovery, the marriage and TILs proportion were statistically related to the outcome in AEGJ cases (Table 4). Education level, first-line treatment method, gastric atrophy, and TILs proportion were significantly associated with prognosis in GAC cases (Supplementary Table 3). The age, sex, marriage, first-line treatment method, differentiation grade, and TILs proportion were significantly associated with OS in the ESCC cases (Supplementary Table 4). Specifically, a higher TIL percentage was associated with a better prognosis in AEGJ (adjusted HR (aHR) = 0.965; 95% CI = 0.938–0.994; P = 0.017), GAC (aHR = 0.972; 95% CI = 0.949–0.995; P = 0.016), and ESCC (aHR = 0.967; 95% CI = 0.938–0.997; P = 0.032) cases (Table 4 and Supplementary Tables 3 and 4). Notably, after further adjusting for TNM staging and other covariates, the associations between TILs proportion and OS were still significant in the AEGJ (aHR = 0.946; 95% CI = 0.907–0.986; P = 0.009), GAC (aHR = 0.961; 95% CI = 0.931–0.993; P = 0.016), and ESCC (aHR = 0.954; 95% CI = 0.911–0.998; P = 0.041) cases (Supplementary Tables 5–7). In validation, except the ESCC (aHR = 0.984; 95% CI = 0.965–1.005; P = 0.133) cases, the auto-quantified TILs also were an independent prognostic biomarker in AEGJ (aHR = 0.812; 95% CI = 0.712–0.925; P = 0.002), GAC (aHR = 0.969; 95% CI = 0.942–0.996; P = 0.025) cases (Supplementary Tables 8–10).
Table 4. Univariable and multivariable Cox regression analyses of basic characteristics with OS in AEGJ of Taixing dataset (Discovery, N = 214).
| Characteristics | No. of patients (%) | Median survival (years) | Univariable analysis | Multivariable analysis | |||||||||||||||||||||||||||||||||||||||||||||||||||||||||||||||||||||||||||||||||||||||||||||||
| P-value | HR (95% CI) | P-value | aHRa (95% CI) | ||||||||||||||||||||||||||||||||||||||||||||||||||||||||||||||||||||||||||||||||||||||||||||||||
| TILs, Median (IQR) | 4.82 (1.90, 11.18) | <0.001 | 0.964 (0.943, 0.985) | 0.017 | 0.965 (0.938, 0.994) | ||||||||||||||||||||||||||||||||||||||||||||||||||||||||||||||||||||||||||||||||||||||||||||||
| Age, mean (range) | 69.23 (49–84) | 0.488 | 1.008 (0.986, 1.031) | 0.849 | 1.003 (0.970, 1.037) | ||||||||||||||||||||||||||||||||||||||||||||||||||||||||||||||||||||||||||||||||||||||||||||||
| Sex | |||||||||||||||||||||||||||||||||||||||||||||||||||||||||||||||||||||||||||||||||||||||||||||||||||
| Woman | 62 (28.97) | 2.44 | Ref. | Ref. | |||||||||||||||||||||||||||||||||||||||||||||||||||||||||||||||||||||||||||||||||||||||||||||||
| Man | 152 (71.03) | 2.32 | 0.640 | 1.097 (0.743, 1.621) | 0.852 | 0.950 (0.552, 1.634) | |||||||||||||||||||||||||||||||||||||||||||||||||||||||||||||||||||||||||||||||||||||||||||||
| Marriage | |||||||||||||||||||||||||||||||||||||||||||||||||||||||||||||||||||||||||||||||||||||||||||||||||||
| Divorce/widow | 49 (22.90) | 2.51 | Ref. | Ref. | |||||||||||||||||||||||||||||||||||||||||||||||||||||||||||||||||||||||||||||||||||||||||||||||
| Unmarried | 12 (5.61) | 2.71 | 0.286 | 0.597 (0.231, 1.540) | 0.019 | 0.125 (0.022, 0.708) | |||||||||||||||||||||||||||||||||||||||||||||||||||||||||||||||||||||||||||||||||||||||||||||
| Married | 153 (71.50) | 2.26 | 0.819 | 0.953 (0.630, 1.441) | 0.383 | 0.749 (0.391, 1.434) | |||||||||||||||||||||||||||||||||||||||||||||||||||||||||||||||||||||||||||||||||||||||||||||
| Educational level | |||||||||||||||||||||||||||||||||||||||||||||||||||||||||||||||||||||||||||||||||||||||||||||||||||
| High school and above | 11 (5.14) | 1.95 | Ref. | Ref. | |||||||||||||||||||||||||||||||||||||||||||||||||||||||||||||||||||||||||||||||||||||||||||||||
| Primary or Secondary school | 129 (60.28) | 2.39 | 0.175 | 0.633 (0.327, 1.226) | 0.253 | 1.881 (0.637, 5.550) | |||||||||||||||||||||||||||||||||||||||||||||||||||||||||||||||||||||||||||||||||||||||||||||
| Illiteracy | 74 (35.58) | 2.52 | 0.130 | 0.586 (0.293, 1.171) | 0.496 | 1.258 (0.650, 2.435) | |||||||||||||||||||||||||||||||||||||||||||||||||||||||||||||||||||||||||||||||||||||||||||||
| Cigarette smoking | |||||||||||||||||||||||||||||||||||||||||||||||||||||||||||||||||||||||||||||||||||||||||||||||||||
| Never | 313 (41.62) | 2.48 | Ref. | Ref. | |||||||||||||||||||||||||||||||||||||||||||||||||||||||||||||||||||||||||||||||||||||||||||||||
| Ever or still | 120 (56.07) | 2.45 | 0.813 | 0.957 (0.666, 1.375) | 0.927 | 1.023 (0.622, 1.683) | |||||||||||||||||||||||||||||||||||||||||||||||||||||||||||||||||||||||||||||||||||||||||||||
| Missing | 8 (3.74) | ||||||||||||||||||||||||||||||||||||||||||||||||||||||||||||||||||||||||||||||||||||||||||||||||||
| Alcohol drinking | |||||||||||||||||||||||||||||||||||||||||||||||||||||||||||||||||||||||||||||||||||||||||||||||||||
| Never | 121 (56.54) | 2.39 | Ref. | Ref. | |||||||||||||||||||||||||||||||||||||||||||||||||||||||||||||||||||||||||||||||||||||||||||||||
| Ever or still | 88 (41.12) | 2.44 | 0.979 | 1.005 (0.701, 1.441) | 0.767 | 0.930 (0.574, 1.505) | |||||||||||||||||||||||||||||||||||||||||||||||||||||||||||||||||||||||||||||||||||||||||||||
| Missing | 5 (2.34) | ||||||||||||||||||||||||||||||||||||||||||||||||||||||||||||||||||||||||||||||||||||||||||||||||||
| Tea drinking | |||||||||||||||||||||||||||||||||||||||||||||||||||||||||||||||||||||||||||||||||||||||||||||||||||
| Never | 165 (77.10) | 2.51 | Ref. | Ref. | |||||||||||||||||||||||||||||||||||||||||||||||||||||||||||||||||||||||||||||||||||||||||||||||
| Ever | 44 (20.56) | 2.14 | 0.930 | 1.020 (0.656, 1.585) | 0.909 | 1.033 (0.590, 1.809) | |||||||||||||||||||||||||||||||||||||||||||||||||||||||||||||||||||||||||||||||||||||||||||||
| Missing | 5 (2.34) | ||||||||||||||||||||||||||||||||||||||||||||||||||||||||||||||||||||||||||||||||||||||||||||||||||
| BMI | |||||||||||||||||||||||||||||||||||||||||||||||||||||||||||||||||||||||||||||||||||||||||||||||||||
| ≥24 | 46 (21.50) | 2.57 | Ref. | Ref. | |||||||||||||||||||||||||||||||||||||||||||||||||||||||||||||||||||||||||||||||||||||||||||||||
| 18.5–24 | 140 (65.42) | 2.45 | 0.587 | 0.890 (0.585, 1.354) | 0.706 | 0.893 (0.497, 1.607) | |||||||||||||||||||||||||||||||||||||||||||||||||||||||||||||||||||||||||||||||||||||||||||||
| <18.5 | 27 (12.62) | 1.68 | 0.611 | 1.171 (0.638, 2.151) | 0.800 | 1.116 (0.477, 2.608) | |||||||||||||||||||||||||||||||||||||||||||||||||||||||||||||||||||||||||||||||||||||||||||||
| Missing | 1 (0.47) | ||||||||||||||||||||||||||||||||||||||||||||||||||||||||||||||||||||||||||||||||||||||||||||||||||
| Wealth scores | |||||||||||||||||||||||||||||||||||||||||||||||||||||||||||||||||||||||||||||||||||||||||||||||||||
| Q5 | 26 (12.15) | 2.35 | Ref. | Ref. | |||||||||||||||||||||||||||||||||||||||||||||||||||||||||||||||||||||||||||||||||||||||||||||||
| Q4 | 43 (20.09) | 2.35 | 0.682 | 1.145 (0.600, 2.187) | 0.647 | 0.817 (0.345, 1.939) | |||||||||||||||||||||||||||||||||||||||||||||||||||||||||||||||||||||||||||||||||||||||||||||
| Q3 | 38 (17.76) | 2.45 | 0.936 | 0.973 (0.494, 1.914) | 0.916 | 0.952 (0.379, 2.390) | |||||||||||||||||||||||||||||||||||||||||||||||||||||||||||||||||||||||||||||||||||||||||||||
| Q2 | 45 (21.03) | 1.98 | 0.566 | 1.206 (0.636, 2.288) | 0.457 | 0.718 (0.300, 1.719) | |||||||||||||||||||||||||||||||||||||||||||||||||||||||||||||||||||||||||||||||||||||||||||||
| Q1 | 62 (28.97) | 2.53 | 0.862 | 1.056 (0.570, 1.959) | 0.430 | 0.714 (0.309, 1.647) | |||||||||||||||||||||||||||||||||||||||||||||||||||||||||||||||||||||||||||||||||||||||||||||
| First-line treatment method | |||||||||||||||||||||||||||||||||||||||||||||||||||||||||||||||||||||||||||||||||||||||||||||||||||
| Untreated | 14 (6.54) | 1.44 | Ref. | Ref. | |||||||||||||||||||||||||||||||||||||||||||||||||||||||||||||||||||||||||||||||||||||||||||||||
| Radiotherapy | 9 (4.21) | 0.99 | 0.294 | 0.598 (0.229, 1.563) | 0.424 | 0.473 (0.075, 2.967) | |||||||||||||||||||||||||||||||||||||||||||||||||||||||||||||||||||||||||||||||||||||||||||||
| Chemotherapy | 21 (9.81) | 1.19 | 0.256 | 0.664 (0.327, 1.347) | 0.610 | 0.723 (0.208, 2.516) | |||||||||||||||||||||||||||||||||||||||||||||||||||||||||||||||||||||||||||||||||||||||||||||
| Surgery | 116 (54.21) | 2.94 | <0.001 | 0.235 (0.129, 0.426) | 0.303 | 0.542 (0.169, 1.738) | |||||||||||||||||||||||||||||||||||||||||||||||||||||||||||||||||||||||||||||||||||||||||||||
| Combination therapy | 52 (24.30) | 2.05 | 0.002 | 0.369 (0.196, 0.695) | 0.469 | 0.637 (0.188, 2.162) | |||||||||||||||||||||||||||||||||||||||||||||||||||||||||||||||||||||||||||||||||||||||||||||
| Missing | 2 (0.93) | ||||||||||||||||||||||||||||||||||||||||||||||||||||||||||||||||||||||||||||||||||||||||||||||||||
| Grade of differentiation | |||||||||||||||||||||||||||||||||||||||||||||||||||||||||||||||||||||||||||||||||||||||||||||||||||
| G1 Highly differentiated | 4 (0.53) | 2.19 | Ref. | Ref. | |||||||||||||||||||||||||||||||||||||||||||||||||||||||||||||||||||||||||||||||||||||||||||||||
| G2 Medium differentiation | 63 (29.44) | 3.00 | 0.573 | 0.661 (0.156, 2.790) | 0.625 | 0.695 (0.161, 2.994) | |||||||||||||||||||||||||||||||||||||||||||||||||||||||||||||||||||||||||||||||||||||||||||||
| G3 Poorly differentiated | 29 (13.55) | 3.13 | 0.572 | 0.894 (0.204, 3.919) | 0.926 | 0.931 (0.206, 4.203) | |||||||||||||||||||||||||||||||||||||||||||||||||||||||||||||||||||||||||||||||||||||||||||||
| G4 Undifferentiated | 11 (5.14) | 0.68 | 0.048 | 4.665 (1.015, 21.443) | 0.058 | 4.655 (0.947, 22.879) | |||||||||||||||||||||||||||||||||||||||||||||||||||||||||||||||||||||||||||||||||||||||||||||
| Gx Grading cannot be evaluated | 36 (16.82) | 1.48 | 0.348 | 1.993 (0.473, 8.405) | 0.396 | 1.886 (0.436, 8.156) | |||||||||||||||||||||||||||||||||||||||||||||||||||||||||||||||||||||||||||||||||||||||||||||
| Missing | 71 (33.18) | ||||||||||||||||||||||||||||||||||||||||||||||||||||||||||||||||||||||||||||||||||||||||||||||||||
| Helicobacter pylori | |||||||||||||||||||||||||||||||||||||||||||||||||||||||||||||||||||||||||||||||||||||||||||||||||||
| HP− | 42 (19.63) | 2.36 | Ref. | Ref. | |||||||||||||||||||||||||||||||||||||||||||||||||||||||||||||||||||||||||||||||||||||||||||||||
| HP+ | 168 (78.50) | 2.36 | 0.959 | 1.012 (0.654, 1.564) | 0.794 | 1.083 (0.597, 1.962) | |||||||||||||||||||||||||||||||||||||||||||||||||||||||||||||||||||||||||||||||||||||||||||||
| Missing | 4 (1.87) | ||||||||||||||||||||||||||||||||||||||||||||||||||||||||||||||||||||||||||||||||||||||||||||||||||
| Gastric atrophy | |||||||||||||||||||||||||||||||||||||||||||||||||||||||||||||||||||||||||||||||||||||||||||||||||||
| No | 131 (61.21) | 2.26 | Ref. | Ref. | |||||||||||||||||||||||||||||||||||||||||||||||||||||||||||||||||||||||||||||||||||||||||||||||
| Yes | 54 (25.23) | 2.13 | 0.116 | 1.362 (0.927, 2.001) | 0.164 | 1.466 (0.855, 2.514) | |||||||||||||||||||||||||||||||||||||||||||||||||||||||||||||||||||||||||||||||||||||||||||||
| Missing | 29 (13.55) | ||||||||||||||||||||||||||||||||||||||||||||||||||||||||||||||||||||||||||||||||||||||||||||||||||
| aaHR with adjustment for TILs proportion, age, sex, differentiation grade, first-line treatment method, and BMI. | |||||||||||||||||||||||||||||||||||||||||||||||||||||||||||||||||||||||||||||||||||||||||||||||||||
Discussion
Although a standardized methodology for manual TILs assessment exists, it has several limitations due to requiring professional pathologists, interobserver variability, and higher costs. To address these problems, our study established the cellular training sets, respectively, explored the characteristics of auto-quantified TILs in AEGJ, GAC, and ESCC. The prognostic value of auto-assessed TILs was investigated in the above esophagogastric tumors. The TILs proportion was distinctive between different demographic and clinical traits and was the highest in AEGJ compared with GAC and ESCC in Taixing. The auto-quantified TILs were an independent prognostic biomarker for AEGJ, GAC, and ESCC.
The characteristics of TILs infiltration are distinctive in different body mass, eating habits, and cancer treatment methods. The tumor microenvironment (TME) is a specific metabolic niche composed of various cellular components as well as the contents of the tumor interstitial space. Recent research data have revealed that high-fat diet-induced obesity contributes to the tumor cell fat uptake, whereas the CD8+ T cell intaking the energy was suppressed [24]. These distinctive adaptations impaired the lymphocyte infiltration degree. However, our study showed the TILs proportion tends to enrich with increasing BMI ranks. This may be related to the types of TILs contained. The TILs include diverse immune cells, e.g., T cells, B cells, and NK cells [25]. In this research, we regard TILs as a major category that might weaken the above association. Our study also discovered that patients drinking more tea and intaking fewer pickles were more likely to enrich the TILs. These results were consistent with previous experiments. Mantena et al. [26] proved that the tea polyphenols that originated from tea contributed to the increasing recruitment of TILs in TME. Besides, eating excessive pickles leads to more nitrite intake, which easily oxidizes hemoglobin to methemoglobin, resulting in the lower oxygen-carrying capacity of blood and facilitating the formation of an immunosuppressive environment [27]. Additionally, the patients with combination therapy had the most TILs levels compared to radiotherapy, chemotherapy, and surgery in our cases. These results support that combination therapy produces fewer side effects on immune cells than applying the above three methods alone [28]. Hence, keeping a better diet and body quality, and choosing a suitable cancer therapy in the clinical field will help to improve immune infiltration to resist tumor growth.
The TILs infiltration showed a cancer-specificity in esophagogastric cancers. Quantification of TILs is growing in significance as evidence emerges of a reliable biomarker to reflect the better response to immunotherapeutic agents [29]. Characterizing the TIL proportion between different solid tumors would provide clues into the varied effectiveness of in immunotherapy. In the general clinical field, the AEGJ, located between the esophagus and stomach is more likely to group with GAC. Nevertheless, increasing evidence demonstrated the AEGJ displayed a significant difference in immune molecular characteristics [30]. In this study, we revealed that the TILs proportion varied between esophagogastric cancer, where AEGJ had the highest TIL proportion. The absolute difference in the TILs proportions between AEGJ and GAC was smaller than that between ESCC and AEGJ or between ESCC and GAC. Our results were similar to previous studies. Mohamed et al. [31] studied 215 ESCC, 1176 EAC, and 1951 GAC cases, including gastric and gastroesophageal junction cancers, and reported that ESCC exhibited a unique molecular profile, whereas GAC and AEGJ shared similarities, supporting the idea that squamous cell carcinomas and adenocarcinomas are entirely different diseases at the molecular level. In another study of 4125 tumor specimens from patients with 14 different gastrointestinal cancer types, Alberto et al. demonstrated that AEGJ had different immune characteristics from GAC and EAC [32]. Our results supported and complemented these findings, indicating the specificity of AEGJ in lymphocyte infiltration degree compared to GAC and ESCC. In addition, variations of TILs infiltration in cancers also indirectly reflect the different immunotherapy effects. Our results might present evidence for the specific selection of immunotherapy for esophagogastric cancers. However, some trial examinations of PD-1/PD-L1 blockade in upper gastrointestinal cancers enrolled patients with gastric cancers and AEGJ without distinction [33]. Therefore, our results also provide clues for future clinical immunotherapy in esophagogastric cancers and enhance precision therapy.
The auto-assessed TIL proportion is an independent prognostic biomarker in AEGJ, GAC, and ESCC patients. The cumulative studies have focused on the association between semiquantitative scoring of TILs levels and prognosis in esophagogastric cancers, and high TILs scores have been reported as a positive prognosis marker [34–37]. Despite the standardized efforts, the subjective nature and higher costs have limited its translational adoption into clinical practice [38]. Besides, the prognostic biomarkers for AEGJ are still under-explored. For this reason, we used the automatic algorithm to quantify the TILs percentage and investigate its prognostic value. We performed a survival analysis of AEGJ and determined that the auto-quantified TILs proportion was an independent prognostic biomarker in Taixing and TCGA datasets. This finding was consistent with the results of two previous studies [39, 40], in which the TILs proportion was estimated by pathologists. However, several researchers demonstrated that the prognostic value of TILs in GAC and ESCC has not been defined [41–43]. Nevertheless, some studies also reported positive results [44–47]. In the present study, we also identified an association between higher auto-assessed TILs proportion and better overall survival in GAC and ESCC cases in both datasets. This discovery supported the idea of the prognostic value of TILs proportion in GAC and ESCC. Hence, we can predict the overall survival of AEGJ, GAC, and ESCC by auto-quantified TILs infiltration degree objectively and it has the potential for translation to the routine clinical and pathological application at minimal additional cost.
As far as we know, this is the first relatively comprehensive establishment of cellular training sets for esophagogastric tumors to automatically quantify TILs infiltration in AEGJ, GAC, and ESCC. We obtained relatively full demographic characteristics and clinical information to explore the TILs characteristics. The findings contributed to more accurate tumor classification and immunotherapy outcome prediction. As an independent prognostic factor common to AEGJ, the auto-quantified TILs provided more evidence for its predictive value in upper gastrointestinal tumors. The findings established the foundation for further exploration of TME differences at specific immune cell level, providing crucial insights into immunotherapy and supporting the prognostic value of the auto-quantified TILs proportion in esophagogastric tumors, particularly in the AEGJ patients.
This study has some limitations. Our study aims to provide clues for immunotherapy in patients with upper gastrointestinal tumors by comparing the TILs level as the immune characteristic. Although the cases in our study did not receive immunotherapy to directly draw relevant conclusions, our results can provide data support for immunotherapy in AEGJ to some extent. Besides, multivariable survival analysis in the validation set showed that auto-quantified TILs were not an independent prognostic factor for ESCC, which may be related to the small sample size of ESCC in TCGA. However, considering the large sample size of ESCC in the Taixing dataset, we can still consider the independent prognostic value of auto-quantified TILs in ESCC.
Future research should investigate the association between the auto-quantified TILs proportion and clinical outcomes in patients received immunotherapy. Moreover, incorporating additional independent datasets to deeply validate the independent prognostic value of TILs in patients with AEGJ, GAC and ESCC will enhance the value of the clinical application of this biomarker.
Conclusions
The findings of this study suggested that TILs levels determined by CRImage based on three different cell training sets are showing distinctive characteristics between various demographic information, clinical traits, and cancer types. The auto-quantified TILs are an independent prognostic factor in AEGJ, GAC, and ESCC patients, and are associated with a favorable prognosis. It is a cost-effective biomarker to predict and improve prognosis in clinical and pathological research.
Materials and Methods
Patients and sample selection
The analysis was based on a 2010–2014 population-based case-control study in Taixing, Jiangsu, China, where there is a high incidence of upper gastrointestinal cancer. Patients were mainly recruited from the endoscopy units of the four most prominent hospitals in Taixing, the People’s Hospital of Taixing, the Second People’s Hospital of Taixing, the Third People’s Hospital of Taixing, and the Hospital of Traditional Chinese Medicine of Taixing. Patients with suspected ESCC, AEGJ, and GAC on endoscopy were invited to participate. The demographic information of patients was obtained using questionnaires and pathological sections of formalin-fixed, paraffin-embedded tissue blocks were obtained from the pathology department. The following inclusion criteria of the participants were applied: (1) age 40–85 years old and living in Taixing for >5 years; (2) suspected ESCC, AEGJ, and GAC by endoscopy that was subsequently pathologically confirmed; (3) preserved H&E staining tumor section images. The detailed research designs were described previously [48–50]. Based on the above criteria, the 1005 ESCC, 292 AEGJ, and 340 GAC cases were included. We also excluded 233 ESCC (23.18%), 71 AEGJ (24.32%), and 80 GAC (23.53%) cases with low-quality images due to uneven H&E-stained, unflattening, and blurred images. And the 20 ESCC (1.99%), 7 AEGJ (2.40%), and 4 GAC (1.18%) patients who missed the survival time were excluded. Finally, the 752 ESCC, 214 AEGJ, and 256 GAC cases were analyzed. Figure 4 illustrates the case selection flow. In the TCGA dataset, we excluded 34 AEGJ (16.75%), 51 GAC (18.68%), and 19 ESCC (21.35%) cases with low-quality images from the 203 AEGJ, 273 GAC, and 89 ESCC cases, respectively. The 169 AEGJ, 222 GAC, and 70 ESCC cases from the TCGA dataset were analyzed to validate the prognostic value of auto-quantified TILs.
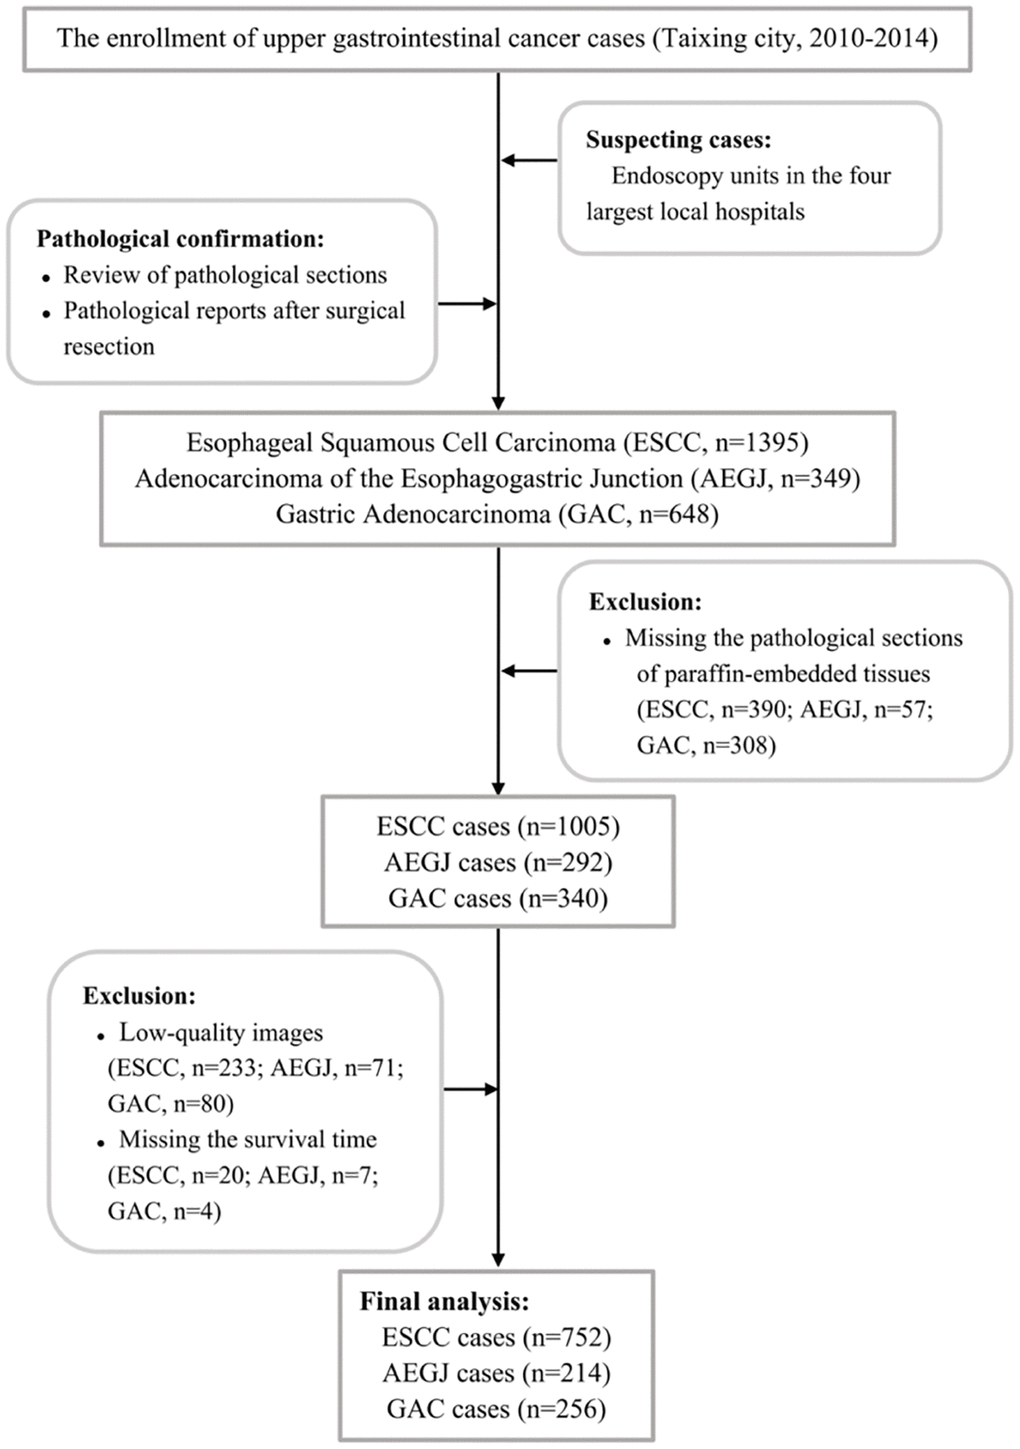
Figure 4. The flowchart of inclusion and exclusion of ESCC, AEGJ, and GAC cases in Taixing, Jiangsu (2010–2014).
Pathological image processing pipeline
We utilized the pathological image processing pipeline published in our previous study [51]. The images of the H&E-stained tumor sections were processed using the R package CRImage developed by Yuan et al. [52]. Based on watershed segmentation and Otsu thresholding for haematoxylin-positive nuclei, this tool was embedded with the EBImage R package and a support vector machine (SVM) [52], to achieve color transformation and segmentation of the nuclei, then analyzed each morphological feature of each nuclei detected, such as shape, intensity, and texture features. The resulting morphological and textural features were input into the SVM for the supervised classification of cancer cells, lymphocytes, and stromal cells. The cancer cells exhibited large nuclei and variable texture and shape, and lymphocytes were small, round, and contained basophilic nuclei. Therefore, cancer cells and lymphocytes could be reliably differentiated from stromal cells that contained the elongated nuclei of fibroblasts and endothelial cells.
We selected the regions containing tumor cells, lymphocytes, and stromal cells from the tissue images and imported them into EBImage for conversion to the LAB color space. The mean and standard deviation of each channel were computed to convert the image to grayscale for further segmentation and cell recognition. Subsequently, an Otsu threshold to partition the image into foreground and background was constructed by the algorithm of maximization of the between-class variance method and morphological opening. Leveraging both the image grayscale and the threshold, the algorithm can eliminate noise and refine the cell edges. Eventually, the watershed segmentation was performed to separate cell clusters, automatically outlining recognized cells in the image.
The senior pathologists were invited to discern the circled cell types, identifying them as cancer cells, lymphocytes, and stromal cells. Subsequently, the EBImage toolkit integrated within CRImage was employed to extract 43 cellular features, encompassing nucleus perimeter, major axis, eccentricity, and the count of neighboring cells, among additional metrics. These features were then exported to construct training sets comprising cellular characteristics for each cancer type. Considering the cytomorphological differences between AEGJ, GAC, and ESCC, we established cell training sets for each cancer. We performed three verifications to test the accuracy of the image analysis tool based on our training sets: (1) cross-validation within each training set; (2) correlation between 10,000 single-cell annotations by the pathologists and automated recognition; (3) comparison of auto-quantified TILs proportion with manual infiltration grade of TILs evaluated by expert pathologists in random one-third samples of each cancer type.
We enhanced the computational efficiency of the algorithm by dividing each entire H&E-stained tumor section image into 100 equal parts. The established AEGJ, GAC, and ESCC cell feature training sets were loaded into the SVM embedded in CRImage to create cell classifiers, respectively. Utilizing the corresponding classifier to read the target H&E-stained tumor tissue sections, we obtained the cell counts and measured lymphocyte infiltration of each sample by calculating the TILs proportion which refers to lymphocyte counts divided by the total cell counts.
Statistical analysis
The distributions of the patient’s demographic characteristics were summarized and presented as counts and percentages. Differences in ordered categorical or continuous variables between cancer types were assessed with the Kruskal-Wallis H test and Wilcoxon rank sum tests. The Pearson chi-square test was used for disordered categorical variables. The multiple comparisons were corrected by the Bonferroni method. The correlations between the auto-assessed TILs percentage and demographic information were analyzed using a Kruskal-Wallis H test since the proportion of TILs did not meet the prerequisites for the parametric testing method. Spearman correlation analysis and multi-variable linear regression were performed to explore the distribution of TILs proportion between cancer types with adjustment for age, sex, body mass index (BMI), first-line treatment method, tumor differentiation grade, tumor-node-metastasis (TNM) staging, i.e., factors correlated with TILs levels. Besides, we also adjusted for Helicobacter pylori infection status, pickles intake, and tea drinking which were significant in univariable correlation analyses.
Overall survival (OS) was defined as the time from diagnosis to the time of any-cause death or the last follow-up. The OS was evaluated with Kaplan-Meier curves and compared using log-rank tests. The Cox proportional hazard model was conducted for univariable and multivariable association analyses between the auto-quantified TILs proportion and OS, adjusted for age, sex, BMI, first-line treatment method, and tumor differentiation grade, i.e., factors associated with esophagogastric cancers survival. The multivariable model adjusting for TNM staging and other demographic characteristics was used for the 117 AEGJ, 148 GAC, and 418 ESCC cases with TNM staging information. The hazard ratio (HR) and 95% confidence interval (CI) were estimated. The statistical analyses were performed using R version 4.1.2 (http://cran.r-project.org). Two-sided P < 0.05 was considered statistically significant.
Availability of data and materials
The datasets generated during and analyzed during the current study are available from the corresponding author upon reasonable request.
Supplementary Materials
Author Contributions
HD designed the study and made substantial contributions to establishing the AEGJ and GAC cellular training sets, and participated in data analysis and writing the manuscript. LY contributed to establishing the ESCC cellular training set and the conception. JF, PG, and XY participated in the design of the study and in the critical revision of the manuscript draft. ZY, TZ, ML, and LJ contributed to the design of the study and conceived data recording. CS and XC conceived the study, performed experiments, essentially revised the manuscript, and contributed equally to this article. All authors provided comments on the draft manuscript and approved the final manuscript.
Acknowledgments
We would like to thank the interviewers and technicians at Fudan University Taizhou Institute of Health Sciences for their contribution to data collection and sample preparation; the staff of Taixing Center for Disease Control and Prevention for organizing the fieldwork; and the staff of the study hospitals for their assistance in sample collection.
Conflicts of Interest
The authors declare no conflicts of interest related to this study.
Ethical Statement and Consent
This study was performed in line with the principles of the declaration of Helsinki. Approval was granted by the institutional review board at the School of Life Sciences, Fudan University, and the institutional review board at Qilu Hospital, Shandong University (Ethical Approval Number: KYLL-2018(KS)-204). The authors affirm that all human research participants provided informed consent for publication of the individual details in this article.
Funding
This work was supported by the National Natural Science Foundation of China (Grant Numbers: 82122060, 82073637, 81973116), the National Key Research and Development Program of China (Grant Number: 2019YFC1315804), the Innovation Grant from Science and Technology Commission of Shanghai Municipality, China (Grant Number: 20ZR1405600).
References
- 1. Sung H, Ferlay J, Siegel RL, Laversanne M, Soerjomataram I, Jemal A, Bray F. Global Cancer Statistics 2020: GLOBOCAN Estimates of Incidence and Mortality Worldwide for 36 Cancers in 185 Countries. CA Cancer J Clin. 2021; 71:209–49. https://doi.org/10.3322/caac.21660 [PubMed]
- 2. Karimi P, Islami F, Anandasabapathy S, Freedman ND, Kamangar F. Gastric cancer: descriptive epidemiology, risk factors, screening, and prevention. Cancer Epidemiol Biomarkers Prev. 2014; 23:700–13. https://doi.org/10.1158/1055-9965.EPI-13-1057 [PubMed]
- 3. Smyth EC, Lagergren J, Fitzgerald RC, Lordick F, Shah MA, Lagergren P, Cunningham D. Oesophageal cancer. Nat Rev Dis Primers. 2017; 3:17048. https://doi.org/10.1038/nrdp.2017.48 [PubMed]
- 4. Wang D, Dai J, Suo C, Wang S, Zhang Y, Chen X. Molecular subtyping of esophageal squamous cell carcinoma by large-scale transcriptional profiling: Characterization, therapeutic targets, and prognostic value. Front Genet. 2022; 13:1033214. https://doi.org/10.3389/fgene.2022.1033214 [PubMed]
- 5. Sung H, Hu N, Yang HH, Giffen CA, Zhu B, Song L, Su H, Wang C, Parisi DM, Goldstein AM, Taylor PR, Hyland PL. Association of high-evidence gastric cancer susceptibility loci and somatic gene expression levels with survival. Carcinogenesis. 2017; 38:1119–28. https://doi.org/10.1093/carcin/bgx090 [PubMed]
- 6. Chevallay M, Bollschweiler E, Chandramohan SM, Schmidt T, Koch O, Demanzoni G, Mönig S, Allum W. Cancer of the gastroesophageal junction: a diagnosis, classification, and management review. Ann N Y Acad Sci. 2018; 1434:132–8. https://doi.org/10.1111/nyas.13954 [PubMed]
- 7. Hui Z, Xianglin M. Association of HOTAIR expression with PI3K/Akt pathway activation in adenocarcinoma of esophagogastric junction. Open Med (Wars). 2016; 11:36–40. https://doi.org/10.1515/med-2016-0008 [PubMed]
- 8. Ichihara S, Uedo N, Gotoda T. Considering the esophagogastric junction as a 'zone'. Dig Endosc. 2017 (Suppl 2); 29:3–10. https://doi.org/10.1111/den.12792 [PubMed]
- 9. Tang W, Chen S, Chen Y, Lin J, Lin J, Wang Y, Liu C, Kang M. Programmed death-1 polymorphisms is associated with risk of esophagogastric junction adenocarcinoma in the Chinese Han population: A case-control study involving 2,740 subjects. Oncotarget. 2017; 8:39198–208. https://doi.org/10.18632/oncotarget.17338 [PubMed]
- 10. Alsina M, Diez M, Tabernero J. Emerging biological drugs for the treatment of gastroesophageal adenocarcinoma. Expert Opin Emerg Drugs. 2021; 26:385–400. https://doi.org/10.1080/14728214.2021.2010705 [PubMed]
- 11. Eismann L, Rodler S, Buchner A, Schulz GB, Volz Y, Bischoff R, Ebner B, Westhofen T, Casuscelli J, Waidelich R, Stief C, Schlenker B, Ledderose S. Identification of the Tumor Infiltrating Lymphocytes (TILs) Landscape in Pure Squamous Cell Carcinoma of the Bladder. Cancers (Basel). 2022; 14:3999. https://doi.org/10.3390/cancers14163999 [PubMed]
- 12. Hendry S, Salgado R, Gevaert T, Russell PA, John T, Thapa B, Christie M, van de Vijver K, Estrada MV, Gonzalez-Ericsson PI, Sanders M, Solomon B, Solinas C, et al. Assessing Tumor-Infiltrating Lymphocytes in Solid Tumors: A Practical Review for Pathologists and Proposal for a Standardized Method from the International Immuno-Oncology Biomarkers Working Group: Part 2: TILs in Melanoma, Gastrointestinal Tract Carcinomas, Non-Small Cell Lung Carcinoma and Mesothelioma, Endometrial and Ovarian Carcinomas, Squamous Cell Carcinoma of the Head and Neck, Genitourinary Carcinomas, and Primary Brain Tumors. Adv Anat Pathol. 2017; 24:311–35. https://doi.org/10.1097/PAP.0000000000000161 [PubMed]
- 13. Hendry S, Salgado R, Gevaert T, Russell PA, John T, Thapa B, Christie M, van de Vijver K, Estrada MV, Gonzalez-Ericsson PI, Sanders M, Solomon B, Solinas C, et al. Assessing Tumor-infiltrating Lymphocytes in Solid Tumors: A Practical Review for Pathologists and Proposal for a Standardized Method From the International Immunooncology Biomarkers Working Group: Part 1: Assessing the Host Immune Response, TILs in Invasive Breast Carcinoma and Ductal Carcinoma In Situ, Metastatic Tumor Deposits and Areas for Further Research. Adv Anat Pathol. 2017; 24:235–51. https://doi.org/10.1097/PAP.0000000000000162 [PubMed]
- 14. Rakaee M, Adib E, Ricciuti B, Sholl LM, Shi W, Alessi JV, Cortellini A, Fulgenzi CAM, Viola P, Pinato DJ, Hashemi S, Bahce I, Houda I, et al. Association of Machine Learning-Based Assessment of Tumor-Infiltrating Lymphocytes on Standard Histologic Images With Outcomes of Immunotherapy in Patients With NSCLC. JAMA Oncol. 2023; 9:51–60. https://doi.org/10.1001/jamaoncol.2022.4933 [PubMed]
- 15. Yoo SY, Park HE, Kim JH, Wen X, Jeong S, Cho NY, Gwon HG, Kim K, Lee HS, Jeong SY, Park KJ, Han SW, Kim TY, et al. Whole-Slide Image Analysis Reveals Quantitative Landscape of Tumor-Immune Microenvironment in Colorectal Cancers. Clin Cancer Res. 2020; 26:870–81. https://doi.org/10.1158/1078-0432.CCR-19-1159 [PubMed]
- 16. Bai Y, Cole K, Martinez-Morilla S, Ahmed FS, Zugazagoitia J, Staaf J, Bosch A, Ehinger A, Nimeus E, Hartman J, Acs B, Rimm DL. An Open-Source, Automated Tumor-Infiltrating Lymphocyte Algorithm for Prognosis in Triple-Negative Breast Cancer. Clin Cancer Res. 2021; 27:5557–65. https://doi.org/10.1158/1078-0432.CCR-21-0325 [PubMed]
- 17. Yoshioka T, Miyamoto M, Cho Y, Ishikawa K, Tsuchikawa T, Kadoya M, Li L, Mishra R, Ichinokawa K, Shoji Y, Matsumura Y, Shichinohe T, Hirano S, et al. Infiltrating regulatory T cell numbers is not a factor to predict patient's survival in oesophageal squamous cell carcinoma. Br J Cancer. 2008; 98:1258–63. https://doi.org/10.1038/sj.bjc.6604294 [PubMed]
- 18. Zheng X, Song X, Shao Y, Xu B, Chen L, Zhou Q, Hu W, Zhang D, Wu C, Tao M, Zhu Y, Jiang J. Prognostic role of tumor-infiltrating lymphocytes in gastric cancer: a meta-analysis. Oncotarget. 2017; 8:57386–98. https://doi.org/10.18632/oncotarget.18065 [PubMed]
- 19. Kos Z, Roblin E, Kim RS, Michiels S, Gallas BD, Chen W, van de Vijver KK, Goel S, Adams S, Demaria S, Viale G, Nielsen TO, Badve SS, et al, and International Immuno-Oncology Biomarker Working Group. Pitfalls in assessing stromal tumor infiltrating lymphocytes (sTILs) in breast cancer. NPJ Breast Cancer. 2020; 6:17. https://doi.org/10.1038/s41523-020-0156-0 [PubMed]
- 20. Lan L, Feng K, Wu Y, Zhang W, Wei L, Che H, Xue L, Gao Y, Tao J, Qian S, Cao W, Zhang J, Wang C, Tian M. Phenomic Imaging. Phenomics. 2023; 3:597–612. https://doi.org/10.1007/s43657-023-00128-8 [PubMed]
- 21. Dodd KC, Menon M. Sex bias in lymphocytes: Implications for autoimmune diseases. Front Immunol. 2022; 13:945762. https://doi.org/10.3389/fimmu.2022.945762 [PubMed]
- 22. Murad LD, Silva TQ, Schilithz AOC, Fernandes PV, Monteiro M, Murad LB, Fialho E. Low body mass index is associated with reduced intratumoral CD4+ T-lymphocyte infiltration in laryngeal squamous cell carcinoma patients. Nutr Res. 2022; 102:1–12. https://doi.org/10.1016/j.nutres.2022.02.005 [PubMed]
- 23. Takada K, Kashiwagi S, Asano Y, Goto W, Morisaki T, Shibutani M, Tanaka H, Hirakawa K, Ohira M. Differences in tumor-infiltrating lymphocyte density and prognostic factors for breast cancer by patient age. World J Surg Oncol. 2022; 20:38. https://doi.org/10.1186/s12957-022-02513-5 [PubMed]
- 24. Ringel AE, Drijvers JM, Baker GJ, Catozzi A, García-Cañaveras JC, Gassaway BM, Miller BC, Juneja VR, Nguyen TH, Joshi S, Yao CH, Yoon H, Sage PT, et al. Obesity Shapes Metabolism in the Tumor Microenvironment to Suppress Anti-Tumor Immunity. Cell. 2020; 183:1848–66.e26. https://doi.org/10.1016/j.cell.2020.11.009 [PubMed]
- 25. Zhu Y, Yu X, Thamphiwatana SD, Zheng Y, Pang Z. Nanomedicines modulating tumor immunosuppressive cells to enhance cancer immunotherapy. Acta Pharm Sin B. 2020; 10:2054–74. https://doi.org/10.1016/j.apsb.2020.08.010 [PubMed]
- 26. Zheng YY, Viswanathan B, Kesarwani P, Mehrotra S. Dietary agents in cancer prevention: an immunological perspective. Photochem Photobiol. 2012; 88:1083–98. https://doi.org/10.1111/j.1751-1097.2012.01128.x [PubMed]
- 27. Kohn MC, Melnick RL, Ye F, Portier CJ. Pharmacokinetics of sodium nitrite-induced methemoglobinemia in the rat. Drug Metab Dispos. 2002; 30:676–83. https://doi.org/10.1124/dmd.30.6.676 [PubMed]
- 28. Hassanian H, Asadzadeh Z, Baghbanzadeh A, Derakhshani A, Dufour A, Rostami Khosroshahi N, Najafi S, Brunetti O, Silvestris N, Baradaran B. The expression pattern of Immune checkpoints after chemo/radiotherapy in the tumor microenvironment. Front Immunol. 2022; 13:938063. https://doi.org/10.3389/fimmu.2022.938063 [PubMed]
- 29. Lee N, Zakka LR, Mihm MC
Jr , Schatton T. Tumour-infiltrating lymphocytes in melanoma prognosis and cancer immunotherapy. Pathology. 2016; 48:177–87. https://doi.org/10.1016/j.pathol.2015.12.006 [PubMed] - 30. Yu X, Xiao H, Zhao B, Zhang X, Wang G. DNA repair gene ERCC1 C118T polymorphism predicts sensitivity of recurrent esophageal cancer to radiochemotherapy in a Chinese population. Thorac Cancer. 2015; 6:741–8. https://doi.org/10.1111/1759-7714.12251 [PubMed]
- 31. Salem ME, Puccini A, Xiu J, Raghavan D, Lenz HJ, Korn WM, Shields AF, Philip PA, Marshall JL, Goldberg RM. Comparative Molecular Analyses of Esophageal Squamous Cell Carcinoma, Esophageal Adenocarcinoma, and Gastric Adenocarcinoma. Oncologist. 2018; 23:1319–27. https://doi.org/10.1634/theoncologist.2018-0143 [PubMed]
- 32. Salem ME, Puccini A, Grothey A, Raghavan D, Goldberg RM, Xiu J, Korn WM, Weinberg BA, Hwang JJ, Shields AF, Marshall JL, Philip PA, Lenz HJ. Landscape of Tumor Mutation Load, Mismatch Repair Deficiency, and PD-L1 Expression in a Large Patient Cohort of Gastrointestinal Cancers. Mol Cancer Res. 2018; 16:805–12. https://doi.org/10.1158/1541-7786.MCR-17-0735 [PubMed]
- 33. Jin Z, Yoon HH. The promise of PD-1 inhibitors in gastro-esophageal cancers: microsatellite instability vs. PD-L1. J Gastrointest Oncol. 2016; 7:771–88. https://doi.org/10.21037/jgo.2016.08.06 [PubMed]
- 34. Gao Y, Guo W, Geng X, Zhang Y, Zhang G, Qiu B, Tan F, Xue Q, Gao S, He J. Prognostic value of tumor-infiltrating lymphocytes in esophageal cancer: an updated meta-analysis of 30 studies with 5,122 patients. Ann Transl Med. 2020; 8:822. https://doi.org/10.21037/atm-20-151 [PubMed]
- 35. Jiang D, Song Q, Wei X, Yu Z, Liu Y, Wang H, Wang X, Huang J, Su J, Hong Y, Xu Y, Xu C, Hou Y. PMS2 Expression With Combination of PD-L1 and TILs for Predicting Survival of Esophageal Squamous Cell Carcinoma. Front Oncol. 2022; 12:897527. https://doi.org/10.3389/fonc.2022.897527 [PubMed]
- 36. Kim HI, Kim SY, Yu JE, Shin SJ, Roh YH, Cheong JH, Hyung WJ, Noh SH, Park CG, Lee HJ. Contrasting Prognostic Effects of Tumor-Infiltrating Lymphocyte Density in Cardia and Non-cardia Gastric Adenocarcinomas. J Gastric Cancer. 2020; 20:190–201. https://doi.org/10.5230/jgc.2020.20.e21 [PubMed]
- 37. Zou W, Zhou ML, Zhang LY, Yang JN, Yang W, Wang YQ, Yi YX, Li GC, Zhang Z. Immune Score Predicts Outcomes of Gastric Cancer Patients Treated with Adjuvant Chemoradiotherapy. J Oncol. 2021; 2021:9344124. https://doi.org/10.1155/2021/9344124 [PubMed]
- 38. Van Bockstal MR, François A, Altinay S, Arnould L, Balkenhol M, Broeckx G, Burguès O, Colpaert C, Dedeurwaerdere F, Dessauvagie B, Duwel V, Floris G, Fox S, et al. Interobserver variability in the assessment of stromal tumor-infiltrating lymphocytes (sTILs) in triple-negative invasive breast carcinoma influences the association with pathological complete response: the IVITA study. Mod Pathol. 2021; 34:2130–40. https://doi.org/10.1038/s41379-021-00865-z [PubMed]
- 39. Knief J, Lazar-Karsten P, Wellner U, Hummel R, Thorns C. Density of CD8-positive tumor-infiltrating T-lymphocytes is an independent prognostic factor in adenocarcinoma of the esophagogastric junction. Histol Histopathol. 2019; 34:1121–9. https://doi.org/10.14670/HH-18-109 [PubMed]
- 40. Knief J, Reddemann K, Petrova E, Herhahn T, Wellner U, Thorns C. High Density of Tumor-infiltrating B-Lymphocytes and Plasma Cells Signifies Prolonged Overall Survival in Adenocarcinoma of the Esophagogastric Junction. Anticancer Res. 2016; 36:5339–45. https://doi.org/10.21873/anticanres.11107 [PubMed]
- 41. Fukuoka E, Yamashita K, Tanaka T, Sawada R, Sugita Y, Arimoto A, Fujita M, Takiguchi G, Matsuda T, Oshikiri T, Nakamura T, Suzuki S, Kakeji Y. Neoadjuvant Chemotherapy Increases PD-L1 Expression and CD8+ Tumor-infiltrating Lymphocytes in Esophageal Squamous Cell Carcinoma. Anticancer Res. 2019; 39:4539–48. https://doi.org/10.21873/anticanres.13631 [PubMed]
- 42. Pohl H, Welch HG. The role of overdiagnosis and reclassification in the marked increase of esophageal adenocarcinoma incidence. J Natl Cancer Inst. 2005; 97:142–6. https://doi.org/10.1093/jnci/dji024 [PubMed]
- 43. Thrift AP, Whiteman DC. The incidence of esophageal adenocarcinoma continues to rise: analysis of period and birth cohort effects on recent trends. Ann Oncol. 2012; 23:3155–62. https://doi.org/10.1093/annonc/mds181 [PubMed]
- 44. Jiang D, Liu Y, Wang H, Wang H, Song Q, Sujie A, Huang J, Xu Y, Zeng H, Tan L, Hou Y, Xu C. Tumour infiltrating lymphocytes correlate with improved survival in patients with esophageal squamous cell carcinoma. Sci Rep. 2017; 7:44823. https://doi.org/10.1038/srep44823 [PubMed]
- 45. Liu K, Yang K, Wu B, Chen H, Chen X, Chen X, Jiang L, Ye F, He D, Lu Z, Xue L, Zhang W, Li Q, et al. Tumor-Infiltrating Immune Cells Are Associated With Prognosis of Gastric Cancer. Medicine (Baltimore). 2015; 94:e1631. https://doi.org/10.1097/MD.0000000000001631 [PubMed]
- 46. Suo C, Chen H, Binczyk F, Zhao R, Fan J, Yang X, Yuan Z, Kreil D, Łabaj P, Zhang T, Lu M, Jin L, Polańska J, et al. Tumor infiltrating lymphocyte signature is associated with single nucleotide polymorphisms and predicts survival in esophageal squamous cell carcinoma patients. Aging (Albany NY). 2021; 13:10369–86. https://doi.org/10.18632/aging.202798 [PubMed]
- 47. Wu ZD, Wang JC, Zhang HJ, Lin JQ, Wu ZZ, Zheng XW, Chen G. [Prognostic values of stromal tumor-infiltrating lymphocytes and lymphocyte-activation gene-3 in advanced gastric adenocarcinoma]. Zhonghua Bing Li Xue Za Zhi. 2022; 51:1007–12. https://doi.org/10.3760/cma.j.cn112151-20220412-00273 [PubMed]
- 48. Gao P, Cai N, Yang X, Yuan Z, Zhang T, Lu M, Jin L, Ye W, Suo C, Chen X. Association of Helicobacter pylori and gastric atrophy with adenocarcinoma of the esophagogastric junction in Taixing, China. Int J Cancer. 2022; 150:243–52. https://doi.org/10.1002/ijc.33801 [PubMed]
- 49. Yang X, Chen X, Zhuang M, Yuan Z, Nie S, Lu M, Jin L, Ye W. Smoking and alcohol drinking in relation to the risk of esophageal squamous cell carcinoma: A population-based case-control study in China. Sci Rep. 2017; 7:17249. https://doi.org/10.1038/s41598-017-17617-2 [PubMed]
- 50. Zhang T, Yang X, Yin X, Yuan Z, Chen H, Jin L, Chen X, Lu M, Ye W. Poor oral hygiene behavior is associated with an increased risk of gastric cancer: A population-based case-control study in China. J Periodontol. 2022; 93:988–1002. https://doi.org/10.1002/JPER.21-0301 [PubMed]
- 51. Dong H, Yao L, Fan J, Yang X, Yuan Z, Zhang T, Lu M, Chen X, Suo C. Development and application of a tool for automatically evaluating tumor lymphocytes infiltration in esophagogastric cancers. J Mod Oncol. 2024; 32:870–7.
- 52. Yuan Y, Failmezger H, Rueda OM, Ali HR, Gräf S, Chin SF, Schwarz RF, Curtis C, Dunning MJ, Bardwell H, Johnson N, Doyle S, Turashvili G, et al. Quantitative image analysis of cellular heterogeneity in breast tumors complements genomic profiling. Sci Transl Med. 2012; 4:157ra143. https://doi.org/10.1126/scitranslmed.3004330 [PubMed]