Submit an Article
Navigate
Home
Editorial Board
Editorial Policies
Current Volume
Archive
Scientific Integrity
Publication Ethics Statements
Interviews with Outstanding Authors
Newsroom
Sponsored Conferences
Podcast
Contact
Special Collections
Submit an Article
Online ISSN: 1945-4589
Research Paper
|
Volume 16, Issue 13
|
pp. 11027–11061
Characteristics of auto-quantified tumor-infiltrating lymphocytes and the prognostic value in adenocarcinoma of the esophagogastric junction, gastric adenocarcinoma, and esophageal squamous cell carcinoma
Back to article
Figure 2
(2 of 4)
−
100%
+
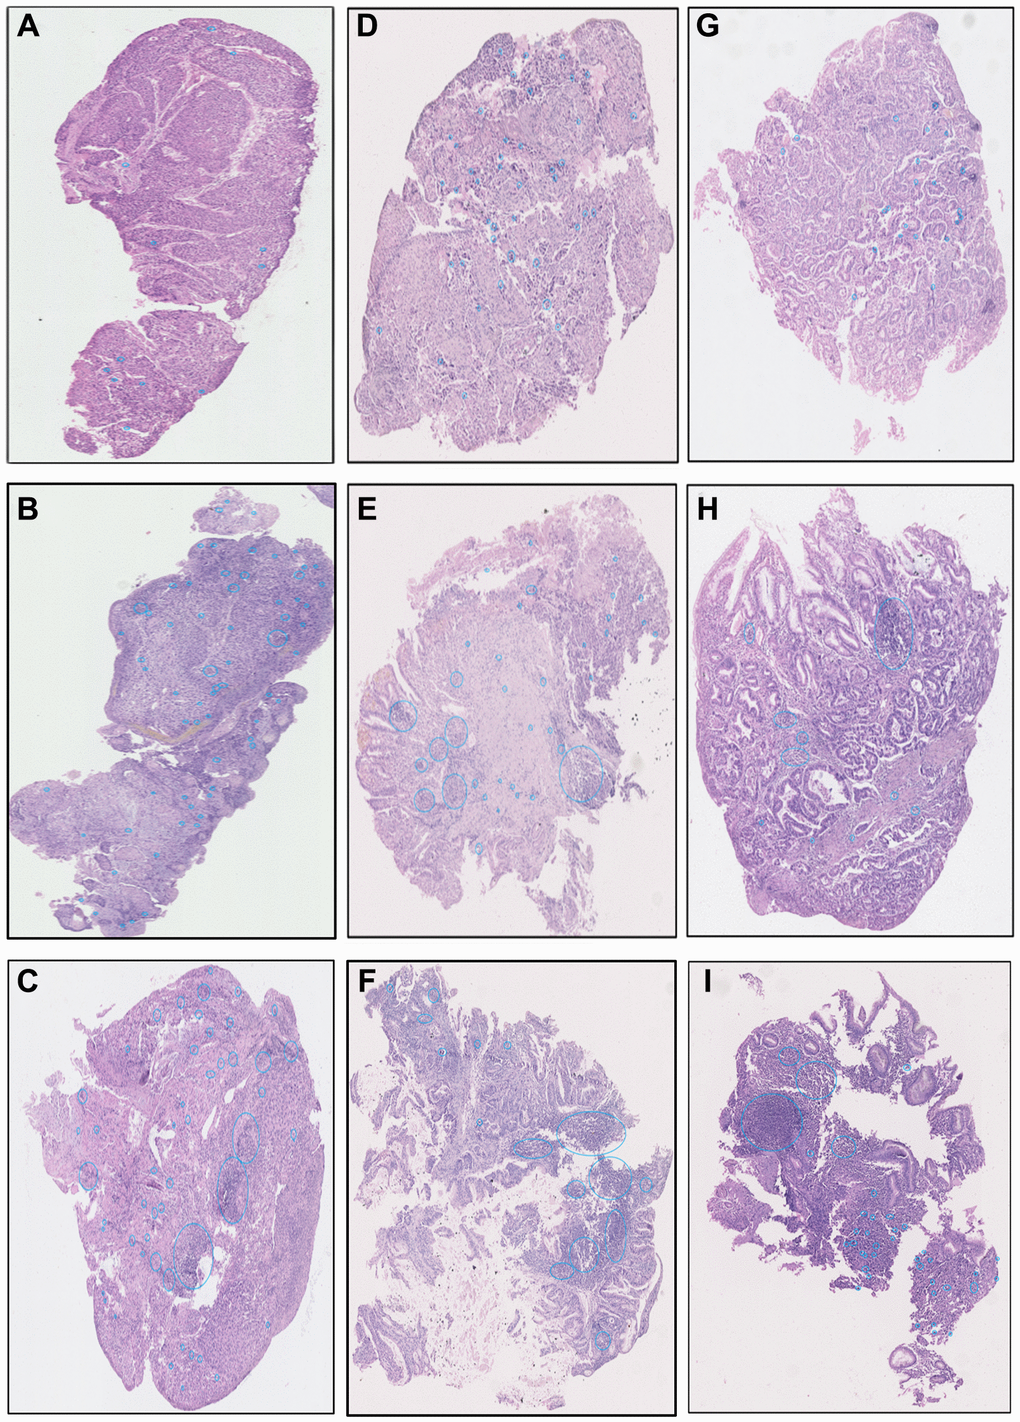
Figure 2.
The examples images of low, medium, and high TILs intensity in ESCC (
A
–
C
), AEGJ (
D
–
F
), and GAC (
G
–
I
) H&E-stained tissue sections (H&E×200).