


Introduction
Ovarian cancer (OC) is the gynecological malignant tumor that exhibits the highest recurrence rate and mortality [1]. 70% of OC will relapse and eventually develop into platinum resistance that displays a poor prognosis with overall survival (OS) time less than 12 months [2–4]. Therefore, it is important to illustrate the underlying mechanisms that contribute to adverse clinical outcomes of OC.
Emerging research has highlighted the significant role of cancer-associated fibroblasts (CAFs) in tumor progression and therapeutic response [5]. CAFs engage in frequent communication with tumor cells and immune cells through paracrine signaling, remodeling of the extracellular matrix (ECM), and direct cell-to-cell contact [6]. The ECM produced by CAFs, serves as a physical barrier for tumors, hindering effective drug delivery and promoting the stemness of tumor cells [7, 8]. Cytokines secreted by CAFs, including TGF-β, IL-6, and CXCL12, contribute to the malignant phenotype of tumor cells [9–11]. Moreover, biglycan derived from CAFs, can promote immunotherapy resistance and serve as a prognostic indicator of clinical outcomes of tumor patients [6, 12].
CAFs exhibit heterogeneity, and they can be classified into distinct subpopulations based on specific gene markers. The heterogeneity is partially attributed to their diverse cellular origins. The majority of CAFs originate from resting fibroblasts, and the others are acquired through epithelial-mesenchymal transition from epithelial cells, adipocytes, pericytes, and smooth muscle cells [13]. Besides, the heterogeneity is from divergent differentiation states of cells [14].
Studies have shown that CAFs are divided into subpopulations with distinctive biological functions including ECM formation, cytokines secretion, self-proliferation, and facilitating tumor metastasis [15–18]. Myofibroblastic CAFs (myCAF) and inflammatory CAFs (iCAF) are frequently recognized. Additionally, CAF subgroups encompass antigen-presenting CAFs, developmental CAFs, etc. [15–19]. More importantly, CAF subpopulations are associated with therapeutic response. For instance, LRRC15+ CAF subgroup acts as a determinant factor of immunotherapy response [20]. SLC14A1+ interferon-regulated CAFs correlate with poor prognosis and chemotherapy resistance in bladder cancer. Therefore, CAF subgroups are potential therapeutic targets for precision medicine. However, the landscape of CAFs in OC has not been fully illustrated.
This study aimed to identify CAF subpopulations of OC and investigate their impacts on clinical outcomes by integrated transcriptomics. Three CAF subgroups were identified: desmoplastic CAF (dCAF), iCAF, and myCAF. Notably, dCAF was associated with prognosis and chemotherapy response of OC patients. For clinical application, we selected dCAF-relevant prognostic feature genes by machine learning methods and constructed a risk scoring system. This study enhances the understanding of CAFs in OC and provides a CAF subpopulation as a promising therapeutic target and biomarker.
Materials and Methods
Material
The data for this study were collected from The Cancer Genome Atlas Program (TCGA), the Gene Expression Omnibus (GEO), and the International Cancer Genome Consortium (ICGC). Patients were eligible if they met the following selection criteria: (a) pathologically diagnosed ovarian cancer; (b) available survival data. RNA sequencing (RNA-seq) and clinical data of OC patients in TCGA were downloaded from UCSC XENA (http://xena.ucsc.edu/). The RNA-seq data include raw read counts and transcripts per million (TPM) values. Gene array expression datasets (GSE26712, GSE63885, GSE30161), single-cell RNA sequencing datasets (scRNA-seq) (GSE165897, GSE158937, GSE147082), and a spatial transcriptomics dataset (GSE213699) were obtained from GEO (https://www.ncbi.nlm.nih.gov/geo/). RNA-seq and survival information of OC were downloaded from the ICGC database (https://dcc.icgc.org/). Ensembl IDs were annotated and converted to gene symbols using the gencode.v38.annotation.gtf, and the average values for duplicate genes were calculated.
scRNA-seq analysis
The samples from GSE165897, GSE158937, and GSE147082 were analyzed using “Seurat” (v4.3.0) and “harmony” (v1.2.0) R packages [21, 22]. Firstly, quality control measures were applied (nFeature_RNA > 200, nCount_RNA > 600, percent. mt < 20). Gene expression was then normalized using the “LogNormalize” method, and variable genes were selected based on the mean of “vst”. To account for the impact of the cell cycle, the CellCycleScoring function was employed. We performed Principal Component Analysis (PCA) for dimension reduction and selected the first 50 principal components for further analysis. The number of clusters was determined using the FindNeighbors and FindCluster functions at a resolution of 0.5. Uniform Manifold Approximation and Projection (UMAP) and t-Distributed Stochastic Neighbor Embedding (t-SNE) were used for nonlinear dimension reduction and visualization. The three major cell types were annotated based on recognized markers: epithelial tumor cells (WFDC2, PAX8, and EPCAM), stromal cells (COL1A2, FGFR1, and DCN), and immune cells (CD79A, FCER1G, and PTPRC) [23]. The stromal cells were extracted and subjected to the above analysis process. The FindMarkers function was used to define marker genes for cell clusters. To determine the subcellular localization of these marker genes, the Unified Protein Database (UniProt) (https://www.uniprot.org/) was utilized [24]. Furthermore, Gene Ontology (GO) analysis of the marker genes was conducted using the clusterProfiler R package (v4.8.3) [25].
Spatial transcriptomics analysis
The spatial transcriptomic data were analyzed using the “Seurat” R package (v4.3.0). For normalization, we applied the SCTransform function. Subsequently, PCA and UMAP were employed for dimension reduction. Clustering was performed using the default resolution of the first 30 principal components. The module scores of genes were evaluated by the AddModuleScore function. The SpatialFeaturePlot function was used to visualize gene expression and module scores.
Identification of transcription factors (TFs) by pySCENIC
The SCENIC Suite is based on SCENIC (Single-Cell rRegulatory Network Inference and Clustering), which infers TFs and gene regulatory networks from scRNA-seq [26]. In our analysis, we utilized pySCENIC (v0.12.1) with the default parameter. pySCENIC constructs a gene co-expression network by GRNBoost2 then employs RcisTarget to identify DNA motifs within 10kb upstream and downstream of the transcription start site to select the potential direct target genes (regulons) of TFs, and finally quantifies the activity of regulons using AUCell.
Cell-cell communication
We used CellphoneDB (v5.0.0) to identify cell-cell communication mediated by ligand-receptor complexes [27]. CellPhoneDB stores 978 proteins sourced from various databases such as UniProt, Ensembl, PDB, IUPHAR, and others. These proteins participate in 1,396 distinct interactions. Ligand-receptor complexes were included if their component genes were expressed in over 10% of the cells at a given cell cluster.
Non-negative matrix factorization (NMF) for molecular subtyping
NMF is a group of algorithms in multivariate analysis and linear algebra that decomposes a matrix V into two matrices W and H, with the property that all three matrices have no negative elements. We applied NMF molecular subtyping in the TCGA cohort by the “NMF” R package (v0.25), using marker genes selected from scRNA-seq. The range of clusters (k) was chosen to be 2 to 5, and the optimal number was determined based on cophenetic, dispersion, and silhouette indicators [28]. Kaplan-Meier (KM) survival analysis of subtypes was conducted using the “survival” and “survminer” R packages (v3.5.5, v0.4.9 respectively).
Gene set enrichment analysis (GSEA) identifies chemotherapy response
GSEA is a method used to determine whether a predefined gene set exhibits random distribution or aggregation at the top or bottom of an ordered gene list. The gene list is typically ordered based on specific criteria. The “limma” R package (v3.50.3) was used to identify differentially expressed genes (DEGs) between cancer subtypes. These DEGs were ranked by log fold change (FC) values [29]. We incorporated genes that were highly expressed in platinum-resistant patients in GSE63885 and GSE30161 as platinum-resistance gene sets (False Discovery Rate (FDR) < 0.05, logFC > 0). GSEA analysis was applied based on these gene sets.
Drug sensitivity analysis
The “pRRophetic” algorithm is employed to predict drug response from gene expression data, utilizing models derived from cancer cell lines. The algorithm calculates predicted sensitivity according to half-maximal inhibitory concentration (IC50) of drugs in Cancer Genome Project (CGP) cell lines. The predicted drug sensitivity was assessed by “pRRophetic” R package (v0.5) [30].
Cellular histochemical staining and immunohistochemistry (IHC)
Surgical specimens of OC were collected at Zhongnan Hospital of Wuhan University between 2018 and 2022. The study was approved by the Ethics Committee of Zhongnan Hospital of Wuhan University. The samples underwent Masson staining, Sinus rose BB staining, and IHC. The methods are as follows:
(a) Masson staining: OC tissues were fixed in formalin and Bouin’s solution for 1 hour at 56° C, and then embedded in paraffin to obtain 4 μm tissue sections. The sections were stained with Weigert’s iron hematoxylin, acid fuchsin solution, phosphomolybdic acid solution, and aniline blue solution (BQD-BIO) successively. The sections were then treated with 1% glacial acetic acid, dehydrated with anhydrous alcohol, cleared twice with xylene, and mounted with neutral gum. Masson staining allows visualization of collagen fibers in blue.
(b) Sinus rose BB staining: OC tissues were fixed in formalin and embedded in paraffin to obtain 4 μm tumor tissue sections. The sections were stained with Harris hematoxylin and Sirius red saturated picric acid solution (BQD-BIO) successively. The sections were dehydrated with anhydrous alcohol, cleared thrice with xylene, and mounted with neutral gum. Sinus rose BB staining enables the visualization of collagen fibers in red.
(c) IHC: OC tissues were fixed in formalin and then embedded in paraffin to obtain 4 μm tissue sections. The paraffin-embedded sections were dewaxed with xylene and ethanol, hydrated, and blocked. The sections were incubated with POSTN monoclonal antibody (66491-1, Proteintech, China) or SFRP2 monoclonal antibody (66328-1, Proteintech) overnight at 4° C and then treated with a secondary antibody at room temperature for 30 minutes. Finally, they were observed using a 3,3’-diaminobenzidine (DAB) substrate kit and counterstained with hematoxylin.
The average Optical Density (AOD) is used to quantify the expression levels of stained targets. ImageJ can measure the Integrated Optical Density (IOD) and stained area [31]. IOD represents the sum of the optical density of each pixel, which is directly proportional to the amount of targets. The ratio of IOD to the area is the AOD.
Ultrasound elastography
Ultrasound elastography is used to quantitatively assess tissue stiffness. We utilized ultrasound elastography (Philips, EPIQ7) to examine the stiffness of tumor regions in 8 newly diagnosed OC patients before treatment from the Department of Gynecologic Oncology at Zhongnan Hospital of Wuhan University. Experienced sonographers performed tumor extent assessment and conducted elasticity coefficient measurements.
Selecting feature genes and constructing a prognosis signature
Firstly, we identified genes associated with OS using univariate Cox regression based on data from TCGA. Next, we employed the Least Absolute Shrinkage and Selection Operator (LASSO), Random Survival Forest Model (RSF), and Extreme Gradient Boosting Method (XGBoost) to select feature genes [32–34]. For LASSO, we utilized the “glmnet” R package (v4.1.8) and implemented it with 500-fold cross-validation to achieve the best fit. RSF was conducted by the “randomForestSRC” R package (v3.1.1), and feature genes were selected by the minimal depth method. We performed XGBoost using the “xgboost” R package (v1.5.2.1). The xgb.importance function was utilized to select feature genes. We intersected the results and used the coefficient of multivariate Cox regression to construct a risk score.
Validation of the prognostic signature
We used the receiver operating characteristic curve (ROC) to validate the efficacy of the prognostic signature. Specifically, we employed the “tdROC” R package (v1.0) to generate time-dependent ROC curves (tdROC) and calculate the corresponding area under the curve (AUC) values, along with their 95% confidence intervals (CI), by the bootstrap method with a sampling frequency of 1000. tdROC is plotted based on a cumulative dynamic model, where each individual is classified into the death group or the survival group according to their state at time t. Furthermore, we extended the validation in three external cohorts, including GSE63885, GSE26712, and ICGC_AU.
Cell culture
The human ovarian epithelial cancer cell lines OVCAR3 were purchased from American Type Culture Collection (ATCC, USA). The cell lines were routinely tested for mycoplasmas (MycoAlert Mycoplasma Detection Kit, Lonza, Switzerland). Cells were cultured in RPMI-1640 medium (Procell) with 10% FBS (ABW) and 1% penicillin-streptomycin (Procell, China). Cells were cultured at 37° C in a humidified incubator with 5% CO2.
Cell proliferation assay
Cells were seeded into 96-well plates at a density of 10,000 cells per well. Next, recombinant POSTN protein (1 μg/ml, MCE, USA) and recombinant SFRP2 protein (1 μg/ml, MCE) were separately added to each group. After 24 hours, cells were treated with different concentrations of cisplatin ranging from 0 to 512 μM for 24 hours. 10 μl cell counting kit-8 regent (CCK-8, Meilune, China) was added to each well and incubated for 1 hour. Absorbance was measured at a wavelength of 450 nm. The concentration-cell viability curve was plotted and IC50 was estimated.
Statistical analysis
Student’s t-test or Wilcoxon rank-sum test was used for the comparison of normally or non-normally distributed variables in two groups. The Shapiro-Wilk test was used to assess the normality of the variables. The significance of KM survival analysis was assessed by the Log-rank test. The significance of GSEA was evaluated by multiple hypotheses testing. Univariate Cox regression analysis was conducted to calculate the hazard ratio (HR) for OS. Statistical analysis was conducted by R (v4.1.0) and GraphPad Prism (v9.0). P-value<0.05 was considered statistically significant.
Results
Identification of CAF subpopulations in OC
The study followed a workflow shown in Figure 1 Initially, analysis of integrated OC scRNA-seq was conducted to distinguish tumor cell, immune cell, and stromal cell. Within the stromal cell population, CAFs were further classified into three subpopulations: dCAF, iCAF, myCAF. By NMF clustering of OC patients, dCAF was discovered to exhibit an association with prognosis and therapeutic response, Lastly, a prognostic signature was developed based on dCAF-related feature genes selected by LASSO, RSF, and XGBoost methods.
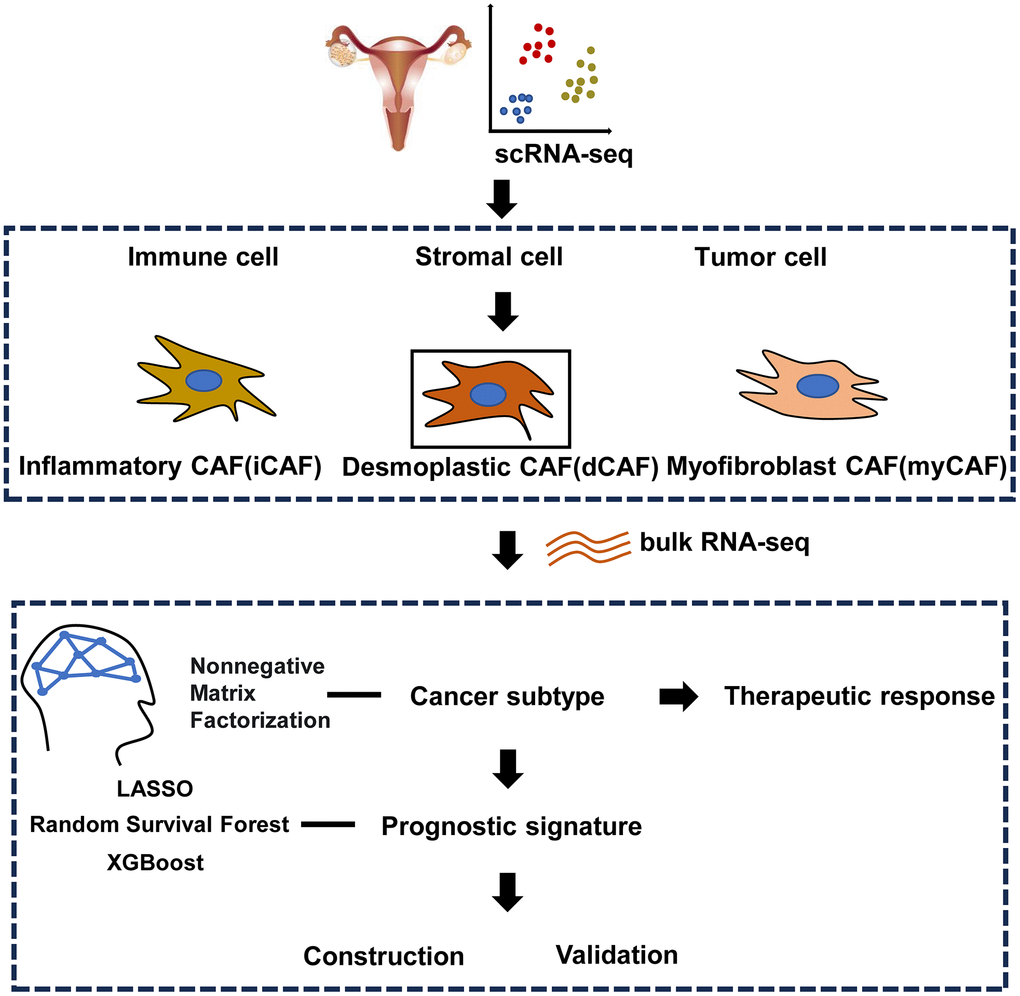
Figure 1. Workflow of the study.
We integrated scRNA-seq data including GSE165897, GSE158937, and GSE147082. 31 OC samples were obtained (Supplementary Figure 1A). Following quality control, we retained 67,201 cells, which were subsequently classified into 27 clusters (Supplementary Figure 1B). These cells were further categorized into three main groups: epithelial tumor cells (33.31%, marked with EPCAM, PAX8, and WFDC2), immune cells (50.06%, marked with DCN, FGFR1, and COL1A2), stromal cells (16.63%, marked with PTPRC and FCER1G) (Figure 2A, 2B). After extracting stromal cells for analysis, we identified several cell clusters: dCAF (marked with CTHRC1, FN1, COL1A1), lymphatic endothelial cell (marked with RSAD1, PDPN), iCAF (marked with CFD, APOE, C7, IL-6), mesenchymal stem cell (marked with LOX), myCAF (marked with RGS5, MCAM, MYH11, ACTA2), vascular endothelial cell (marked with ANGPT2, PECAM1, VWF), low quality cell without detectable markers (Figure 2C, 2D and Supplementary Figure 1C, 1D). To validate the subgroups of CAFs, we mapped the expression of marker genes to spatial transcriptomics and observed that dCAFs, iCAFs, and myCAFs exhibited unique spatial distribution in tumor microenvironment (Figure 2E).
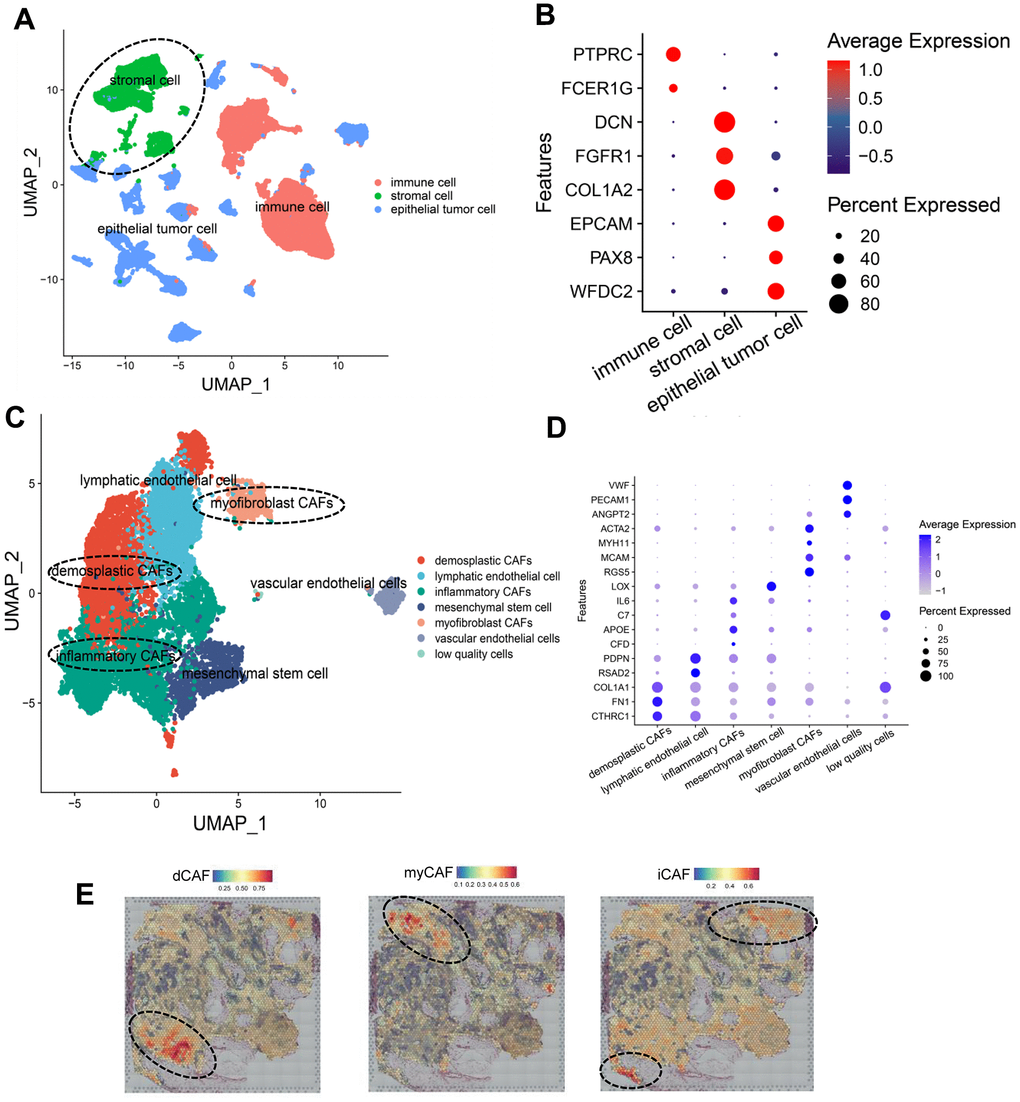
Figure 2. Identification of CAF subpopulations in OC. (A) UMAP plot of all cells, colored by cell types. (B) Dot plot showing expression of cell type markers. (C) UMAP plot of stromal cells, colored by cell types. (D) Dot plot showing the expression of gene markers of cell types in stromal cells. (E) Spatial distribution of CAF-subpopulation-specific scores defined by marker genes, calculated by the AddModuleScore function. Representative images are shown.
Identification of membrane proteins and biological functions of CAF subpopulations
For better isolation of CAF subpopulations, we focused on marker genes that encode membrane proteins. We extracted the top 30 genes with the highest logFC values that were calculated by the FindAllMarkers function and then queried these genes in UniProt to obtain their cell membrane localization. As a result, we identified specific membrane proteins in each CAF subpopulation: CTSK and SULF1 for dCAF, APOE for iCAF, RGS5 for myCAF (Figure 3A). To gain insights into the biological functions of the CAF subgroups, we performed enrichment of marker genes in GO terms and examined the expression level of important genes. In dCAF, the expression of collagens was elevated, and the enriched gene sets involved in ECM. In iCAF, several inflammatory factors were up-regulated, correspondingly, the marker genes were associated with terms related to response to stress including corticosteroid, oxidative stress, toxic substance, and chemical stress. myCAF exhibited high expression level of smooth muscle cell markers, and terms related to actin regulation, cell-substrate adhesion, and muscle contraction were activated (Figure 3B, 3C).
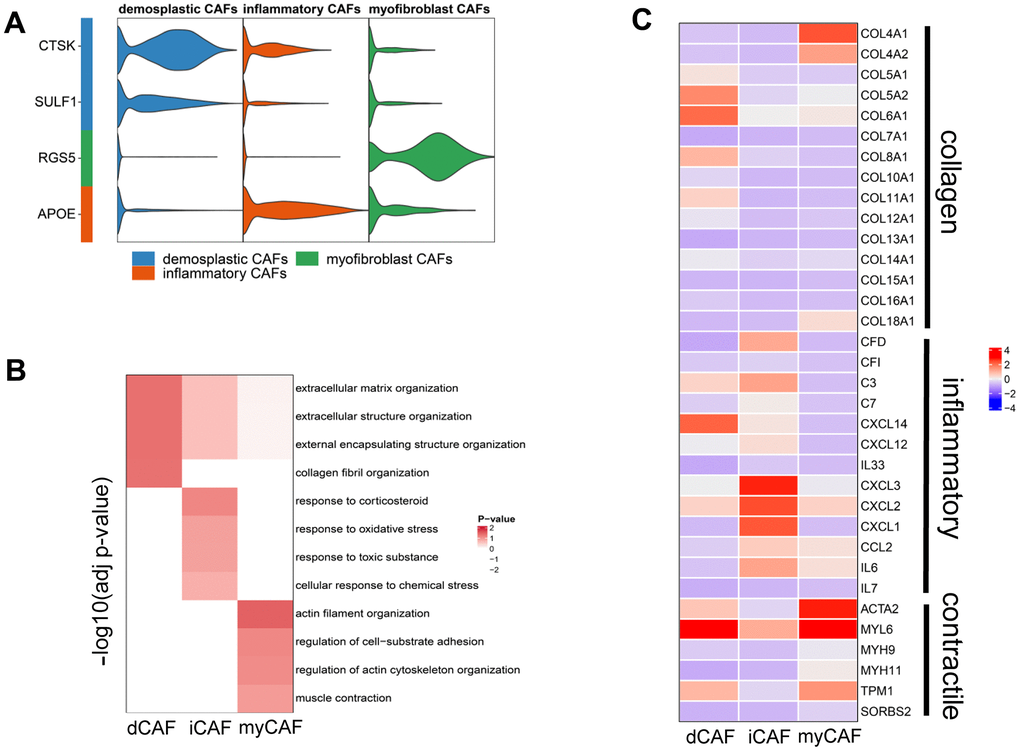
Figure 3. Membrane proteins and biological functions of CAF subgroups. (A) Violin plot showing the expression level of membrane protein markers in CAF subgroups. (B) Enriched gene sets in GO database of CAF subgroups. (C) Heatmap displaying the expression of genes involving the enriched gene sets.
TFs and cell-cell communication of CAF subpopulations
We utilized pySCENIC to identify activated TFs in CAF subpopulations. The higher the regulon specificity score (RSS) is, the more likely the regulon-related TFs are activated in this cell cluster. We screened the top 10 regulons with the highest RSS across the three CAF subgroups. In iCAF, ATF and CREB5 were enriched. ATF4 and CREB5 belong to the ATF/CREB TF family. This family of proteins can modulate their transcriptional activity in response to extracellular signals, such as energy states and hormone levels. FOXO3 and FOXO4, members of the Forkhead TF family, were activated in iCAFs. This TF family is involved in diverse cellular processes including cell differentiation, metabolism, cell cycle progression, apoptosis, autophagy, and protection against cellular stress. In dCAFs, TCF4 and LEF1 were activated. These two TFs collaboratively initiate the transcription of target genes in Wnt/β-catenin signaling pathway. No CAF subgroup-specific TFs were discovered in myCAFs (Figure 4A).
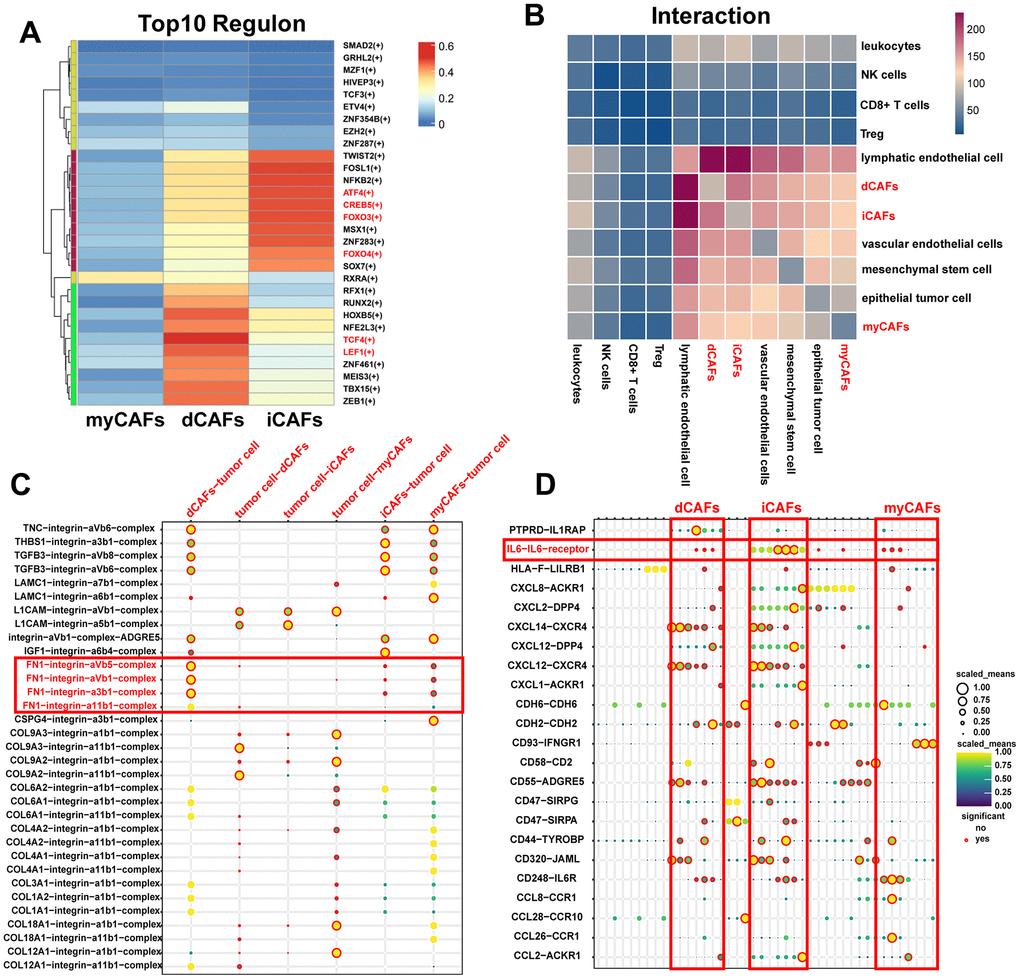
Figure 4. TFs and cell-cell communication of CAF subgroups. (A) Heatmap of the top ten TF regulons in CAF subgroups ranked by RSS scores, with color representing relative RSS values. (B) Heatmap showing cell types with significant correlations. The color represents the number of receptor-ligand pairs between cells. (C) ECM-related receptor-ligand pairs between CAF subpopulations and tumor cells with P < 0.05. (D) Immune-related receptor-ligand pairs between CAF subpopulations and other cell types with P < 0.05.
Results of CellphoneDB revealed that CAFs exhibited frequent interactions with lymphatic endothelial cells, while interactions with CD8+ T cells and Treg cells were relatively rare (Figure 4B). In terms of cell-cell communication, we highlighted ECM complexes and immune-related ligand-receptor pairs. We observed that dCAFs had the highest number of interactions with other cells through ECM complexes (Supplementary Figure 2). Notably, FN1-related complexes were primarily produced by dCAFs, suggesting their significant role in ECM-mediated communication (Figure 4C). iCAFs exhibited the greatest extent of interaction with other cells through immune-related pathways. IL-6 was an important cytokine produced by iCAFs (Figure 4D).
NMF identifies dCAF-based cancer subtypes with different prognosis and therapeutic response
We identified cancer subtypes based on the three CAF subgroups by NMF. We select the k value when the cophenetic started declining (Supplementary Figure 3). The results revealed that the prognosis of dCAF-based cancer subtypes was different (P=0.00044), whereas the prognosis of iCAF- and myCAF-based cancer subtypes did not exhibit significant differences (P=0.62, P=0.3, respectively). Therefore, we further analyzed the characteristics of dCAF-based cancer subtypes (Figure 5A). The expression level of representative dCAF markers was distinctive in two subtypes, so we defined the subtypes as high-dCAF-infiltrating subtype (H-dCAF) (n=100) and low-dCAF-infiltrating subtype (L-dCAF) (n=278) (Figure 5B).
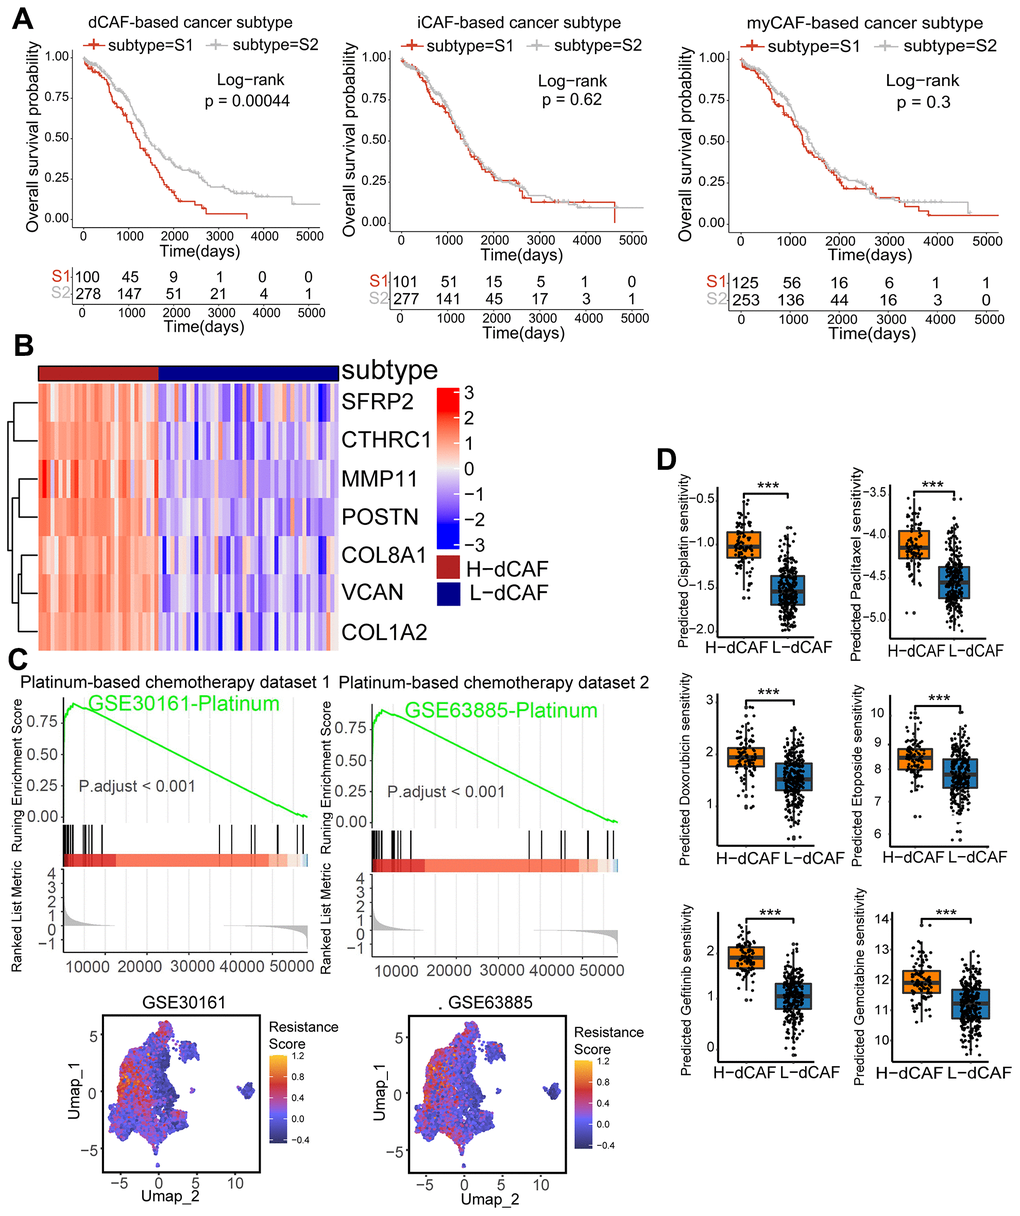
Figure 5. dCAFs were related to prognosis and platinum response in OC. (A) KM survival analysis of CAF-based cancer subtypes. (B) The expression level of dCAF marker genes in dCAF-based cancer subtypes. (C) GSEA of GSE30161- and GSE63885-derived platinum resistance gene in dCAF-based cancer subtypes. Feature plot of these genes in stromal cells. (D) IC50 of drugs including cisplatin, paclitaxel, gemcitabine, gefitinib, doxorubicin, and etoposide in dCAF-based cancer subtypes, calculated by pRRophetic algorithm. (***p < 0.001, **p < 0.01, *p < 0.05).
We observed distinct chemotherapy response of the dCAF-based cancer subtypes. By performing GSEA using platinum-resistant genes from GSE30161 and GSE63885, we found that these genes were markedly enriched in H-dCAF. Furthermore, scRNA-seq analysis revealed a significant up-regulation of these platinum resistance genes in dCAFs compared to other stromal cells (Figure 5C). Additionally, we employed the pRRophetic algorithm to obtain the predicted sensitivity of subtypes to 6 chemotherapy drugs: cisplatin, doxorubicin, etoposide, gefitinib, gemcitabine, paclitaxel, and we observed an increasing predicted drug sensitivity in H-dCAF, indicating that H-dCAF was more prone to multidrug resistance (Figure 5D). As dCAFs enhance the deposition of matrix components, we conducted Masson staining and Sinus rose BB staining on OC specimens consisting of 3 platinum-resistant and 4 platinum-sensitive OC. The results displayed a significant increase of collagen fiber density in resistant patients (P=0.001, P=0.0011, respectively) (Figure 6A). Intense collagen fiber density indicates heightened tissue stiffness. The results of ultrasound elastography further confirmed higher elastic coefficients in tumor regions of platinum-resistant patients, indicating greater tumor rigidity (P=0.00072) (Figure 6B). By intersecting the differentially expressed genes (DEGs) of cancer subtypes with the top 10 dCAF markers, we gained POSTN and SFRP2. IHC results demonstrated that platinum-resistant OC exhibited higher expression of POSTN and SFPR2 in stromal sections (P<0.0001, P=0.017, respectively) (Figure 6C). To verify the role of POSTN and SFRP2 in cisplatin sensitivity in OC cells, IC50 values were estimated by CCK-8 assay. We observed that OVCAR3 cells treated with recombinant POSTN or recombinant SFRP2 had a significantly higher IC50 value compared to the untreated cells after 24 hours of cisplatin treatment (Figure 6D) (P = 0.023, P = 0.012, respectively).
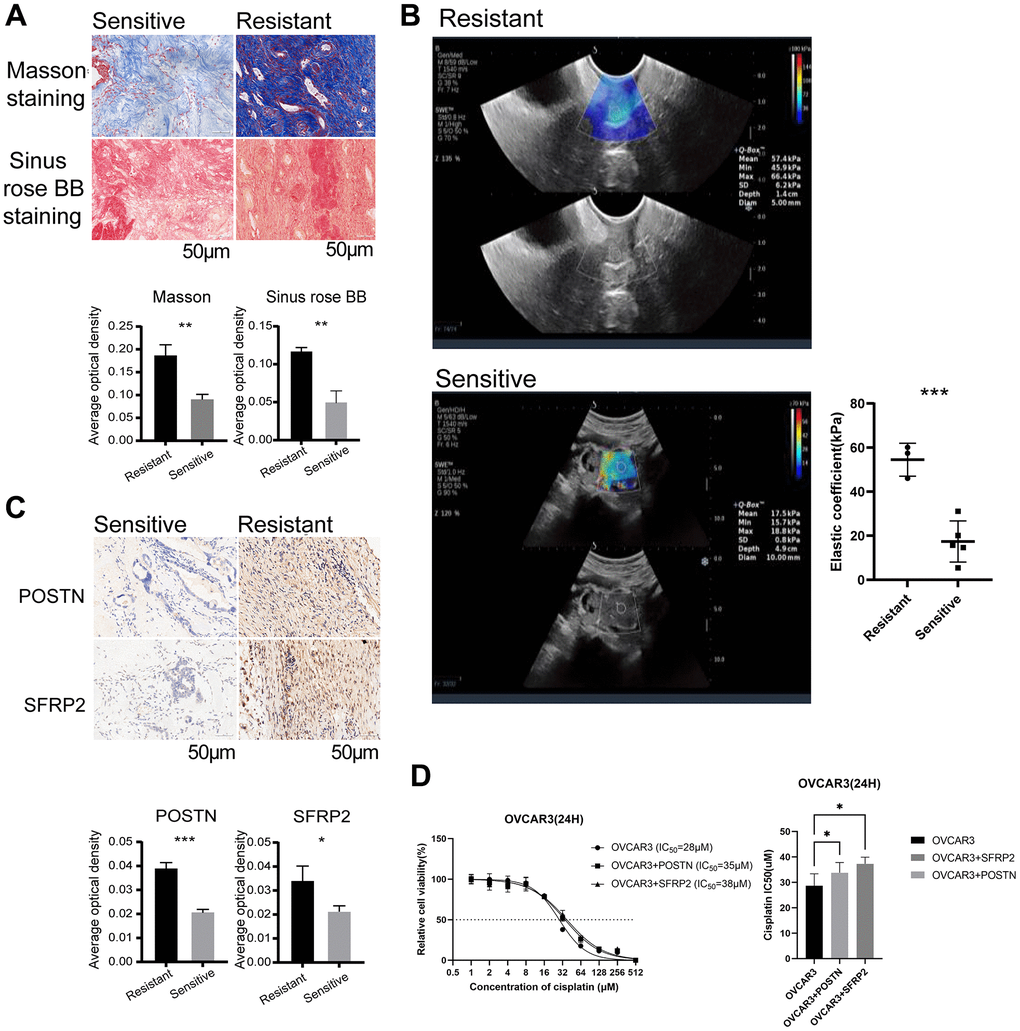
Figure 6. dCAFs were related to platinum resistance in OC patients. (A) Representative plots of Masson staining and Sinus rose BB staining in platinum-sensitive and -resistant OC cohorts (scale bar: 50 μm). The collagen fiber density was identified by AOD. (B) Elastic coefficient (kPa) and representative ultrasound elastography images of OC patients with platinum treatment. (C) Representative IHC staining of POSTN and SFRP2 in platinum-sensitive and -resistant cohorts (scale bar: 50 μm). The expression level of POSTN and SFRP2 was identified by AOD. (D) Quantitative analysis of IC50 of OVCAR3 with cisplatin treatment for 24 hours in the presence or absence of recombinant POSTN (1 μg/ml) or recombinant SFRP2 (1 μg/ml). (***p < 0.001, **p < 0.01, *p < 0.05).
Machine learning to select feature genes and construct a risk score
For clinical application, we utilized machine learning approaches to identify feature genes and develop a risk score as the dCAF-related prognostic signature. Initially, we conducted univariate Cox regression with a significance threshold of 0.05 and identified 47 survival-related genes from 397 dCAF marker genes. Subsequently, we applied LASSO, RSF, and XGBoost and intersected the results, and obtained 8 genes, including CHN1 (HR = 0.845, 95% CI: 0.722-0.989), GNAS (HR = 0.81, 95% CI: 0.661-0.993), EPB41L2 (HR = 1.22, 95% CI: 1.05-1.4), TSPAN9 (HR = 1.37, 95% CI: 1.12-1.66), GAS1 (HR = 1.17, 95% CI: 1.06-1.31), GBP1 (HR = 0.882, 95% CI: 0.791-0.984), DAP (HR = 0.772, 95% CI: 0.617-0.985), TCEAL4 (HR = 0.756, 95% CI: 0.584-0.979) (Figure 7A). In LASSO, the best fit for the model was achieved when λ was set to 0.03, and 14 feature genes were selected (Figure 7B). In RSF, the importance of variables was evaluated by minimal depth, where a lower depth represents a greater importance for the outcome (Figure 7C). In XGBoost, a larger gain value indicates a greater contribution to predicting the outcome. CHN1 was identified as the most important predictive factor in selected genes (Figure 7D).
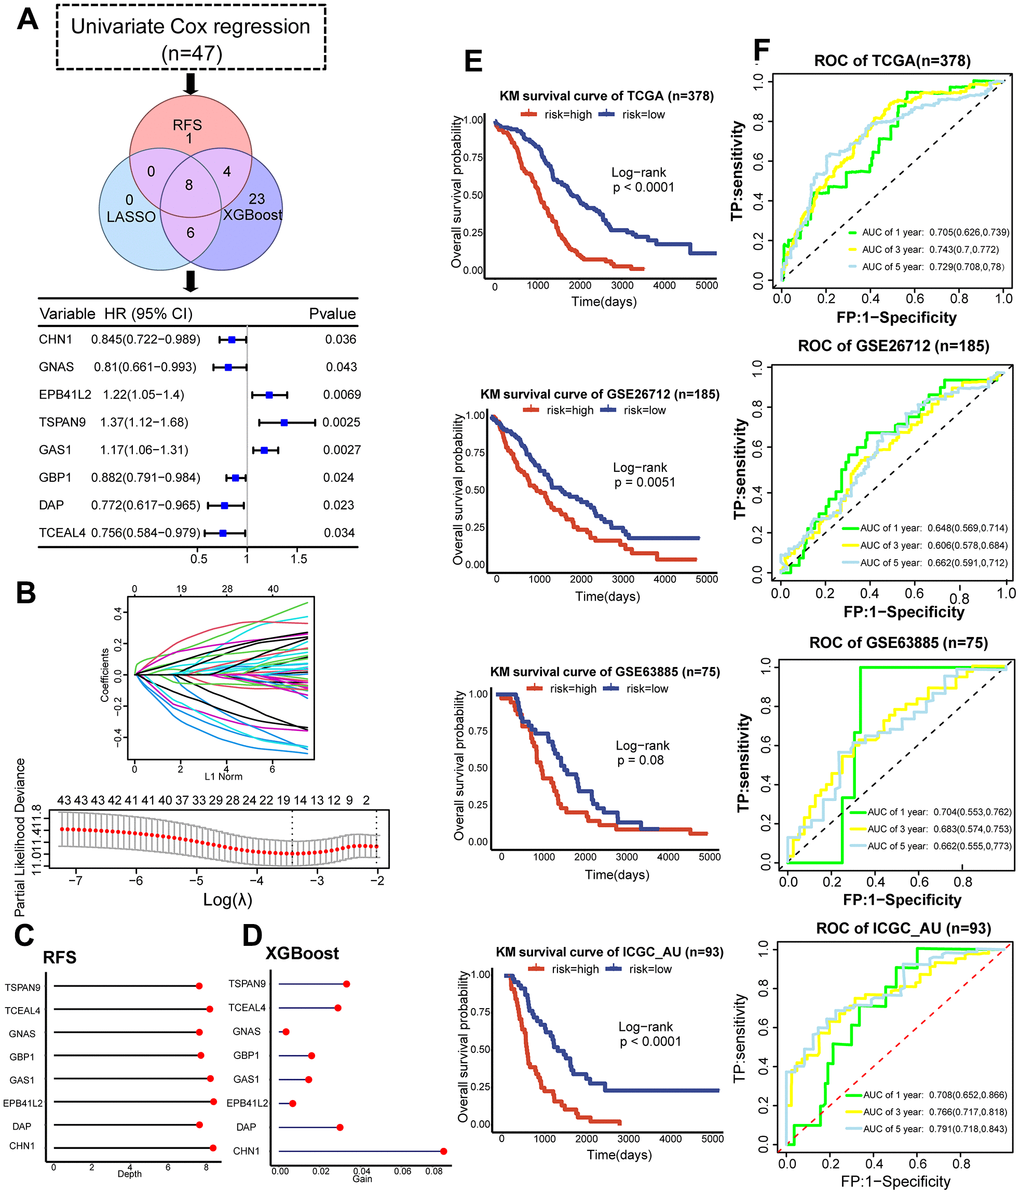
Figure 7. Development and validation of the dCAF-based prognostic signature. (A) Workflow for feature gene selection and HR values of the 8 feature genes with 95% CI. (B) Characteristics of coefficient changes of variables; selection of tuning parameter λ and the corresponding number of variables through cross-validation in LASSO model. (C) Depths of feature genes calculated by the RSF model. (D) Gain values of feature genes calculated by the XGBoost model. (E) KM survival analysis was performed in the low- and high-risk groups categorized by the median risk score in the training set (TCGA) and validation sets (GSE63885, GSE26712, ICGC_AU). (F) ROC and AUC values with 95% CI of 1-, 3-, and 5-year survival prediction by the dCAF-based risk score in the training set (TCGA) and testing sets (GSE63885, GSE26712, and ICGC_AU). (***p < 0.001, **p < 0.01, *p < 0.05).
We employed multivariate Cox regression and stepwise regression to construct a risk score that was calculated by summing the coefficients and gene expression. Based on the median score, we divided patients into low- and high-risk groups and performed KM survival analysis. The results demonstrated a significant difference in prognosis between risk groups in TCGA, GSE26712, and ICGC_AU (P<0.0001, P=0.0051, P<0.0001, respectively), and a marginally significant difference in GSE63885 (P=0.08) (Figure 6E). We validated the distribution of dCAF marker genes in risk groups by GSEA and noted significant enrichment of dCAF marker genes in the high-risk group (Supplementary Figure 4). In TCGA (n=378) training set, the risk score predicted 1-year, 3-year, and 5-year survival AUCs of 0.705 (95% CI: 0.626-0.739), 0.743 (95% CI: 0.7-0.772), and 0.729 (95% CI: 0.708-0.78). In GSE63885 (n=75), the AUCs were 0.704 (95% CI: 0.553-0.762), 0.683 (95% CI: 0.574-0.753), and 0.662 (95% CI: 0.555-0.773). In GSE26712 (n=185), the AUCs were 0.648 (95% CI: 0.569-0.714), 0.606 (95% CI: 0.578-0.684), and 0.662 (95% CI: 0.591-0.712). In ICGC-AU, the AUCs were 0.648 (95% CI: 0.569-0.714), 0.606 (95% CI: 0.578-0.684), and 0.662 (95% CI: 0.591-0.712) (Figure 6F). The relatively lower AUCs of GSE26712 may be attributed to different distribution of clinical data. TCGA comprises patients across Stage I-IV, whereas GSE26712 only includes patients in Stage III.
Discussion
This study delineated the heterogeneity of CAFs in OC through integrated transcriptomics and identified three CAF subpopulations: dCAF, iCAF, and myCAF. dCAFs were associated with poor prognosis and chemotherapy resistance, suggesting the potential as biomarkers and therapeutic targets. Moreover, by machine learning methods, a dCAF-based prognostic signature was developed and displayed favorable accuracy.
By integrating samples in OC scRNA-seq datasets, we gained 8,943 CAFs and identified three CAF subclasses, including dCAF, iCAF, and myCAF, with different biological functions. dCAFs involved in ECM remodeling, marked with components of ECM (COL1A1, FN1, and CTHRC1). iCAFs displayed a strong association with inflammatory responses, characterized by inflammatory cytokines (IL-6 and APOE). myCAFs were marked with smooth muscle-related genes (MCAM, MYH11, and ACTA2) and possessed contractile and secretory properties. These three CAF subgroups have been reported in other types of cancers. For instance, in pancreatic cancer, CAFs were classified into myCAFs with ACTA2 expression and iCAFs with IL-6 expression [16]. In colorectal cancer, two CAF subgroups were identified: ECM-related CAF-As, myCAF-like CAF-Bs [35]. A pan-cancer study recognized CAF subgroups including dCAFs, iCAFs, myCAFs, and proliferating CAFs [18]. These results demonstrate that CAF subgroups in OC share certain similarities with other cancers, and specific CAF subgroups exhibit analogous functions.
The analysis of transcription factors (TFs) revealed the high expression of TCF4 and LEF1 in dCAFs, indicating potential activation of the Wnt/β-catenin pathway. TCF/LEF TFs interact with β-catenin, forming a complex to regulate the transcription of downstream genes [36]. In iCAFs, ATF4 and CREB5 were up-regulated, and they are markers of cellular stress response [37]. This suggests that iCAFs may be generated in response to toxic stress induced by chemotherapy [23]. For cell-cell communication, we noted that dCAFs specifically interacted with tumor cells through FN1-related complex. FN1 in ECM has been shown to induce gemcitabine resistance in pancreatic cancer cells with integrin α5β1 or αvβ3 [38]. The formation of FN1-related ligand-receptor pairs may contribute to chemotherapy resistance in OC.
To further investigate the impact of CAF subpopulations on clinical outcomes, we employed NMF for unsupervised clustering based on CAF marker genes. NMF was chosen due to its insensitivity to prior gene selection or initial conditions, making it advantageous over other clustering methods when working with gene expression matrices [39, 40]. We observed that patients with a greater abundance of dCAFs exhibited worse prognosis and a higher likelihood of chemotherapy resistance. Moreover, the tumor regions of platinum-resistant patients displayed increased infiltration of collagen fibers and greater stiffness. Additionally, the dCAF markers, POSTN and SFRP2, also showed a positive expression in platinum-resistant patients and were associated with decreased sensitivity to cisplatin in epithelial OC cells. These results illustrate that dCAFs may play a significant role in the adverse clinical outcomes of OC.
The risk score based on CAF-related genes has proven to be effective in predicting the prognosis of tumor patients [41]. Therefore, we aimed to select feature genes to construct a prognostic signature. LASSO, RSF, and XGBoost models are suitable for feature selection in survival data. By intersecting the results of these models, we identified 8 genes and constructed a risk score. The risk score demonstrated good efficacy in both the training and testing sets, suggesting its potential as a prognostic tool for OC patients.
Currently, most anti-CAF therapies target CAFs as a whole without sufficient specificity [42–44]. However, the investigations into therapies that focus on specific CAF subpopulations are ongoing. One promising example is the use of GPR77 monoclonal antibodies, which specifically target CD10+ GPR77+ CAFs, can increase chemotherapy sensitivity in solid tumors in vivo [45]. Targeting dCAFs and the related marker genes may be a promising therapy for OC.
In summary, the study characterized the landscape of CAFs in OC by integrative transcriptomics. Importantly, a specific CAF subpopulation, dCAF, was identified, and it was associated with adverse clinical outcomes. dCAF holds promise as both a potential therapeutic target and biomarker for OC.
Conclusion
We identified three CAF subpopulations in OC, dCAF, iCAF, and myCAF, by comprehensive transcriptomics. dCAF was found to be associated with poor prognosis and chemotherapy resistance. Furthermore, we selected dCAF-related feature genes and constructed a prognostic signature that displayed favorable efficacy. Overall, the study deepens the understanding of CAF heterogeneity in OC and identifies a CAF subpopulation, dCAF, related to adverse clinical outcomes. dCAF could serve as a potential therapeutic target and biomarker for precision medicine.
Supplementary Materials
Author Contributions
S.W. and Z.L. performed the experiments. S.Y. wrote the original draft. A.W. and X.L. helped with visualization. H.H. reviewed and edited the original draft. H.C., Y.G., and H.W. supervised the research and acquired the funding. The authors read and approved the final manuscript.
Conflicts of Interest
The authors declare that they have no conflicts of interest.
Ethical Statement and Consent
The study was conducted in accordance with the Declaration of Helsinki. The study was approved by the Ethics Committee of Zhongnan Hospital of Wuhan University [approval number: 2021087]. All the patients signed a written informed consent form.
Funding
This work was supported by Hubei Province Health and Family Planning Scientific Research Project (WJ2023M067), National Natural Science Foundation of China (81972447), and National Natural Science Foundation of China Youth Project (82002770).
References
- 1. Siegel RL, Miller KD, Wagle NS, Jemal A. Cancer statistics, 2023. CA Cancer J Clin. 2023; 73:17–48. https://doi.org/10.3322/caac.21763 [PubMed]
- 2. Pujade-Lauraine E, Hilpert F, Weber B, Reuss A, Poveda A, Kristensen G, Sorio R, Vergote I, Witteveen P, Bamias A, Pereira D, Wimberger P, Oaknin A, et al. Bevacizumab combined with chemotherapy for platinum-resistant recurrent ovarian cancer: The AURELIA open-label randomized phase III trial. J Clin Oncol. 2014; 32:1302–8. https://doi.org/10.1200/JCO.2013.51.4489 [PubMed]
- 3. Gaillard S, Oaknin A, Ray-Coquard I, Vergote I, Scambia G, Colombo N, Fernandez C, Alfaro V, Kahatt C, Nieto A, Zeaiter A, Aracil M, Vidal L, et al. Lurbinectedin versus pegylated liposomal doxorubicin or topotecan in patients with platinum-resistant ovarian cancer: A multicenter, randomized, controlled, open-label phase 3 study (CORAIL). Gynecol Oncol. 2021; 163:237–45. https://doi.org/10.1016/j.ygyno.2021.08.032 [PubMed]
- 4. Moore KN, Oza AM, Colombo N, Oaknin A, Scambia G, Lorusso D, Konecny GE, Banerjee S, Murphy CG, Tanyi JL, Hirte H, Konner JA, Lim PC, et al. Phase III, randomized trial of mirvetuximab soravtansine versus chemotherapy in patients with platinum-resistant ovarian cancer: primary analysis of FORWARD I. Ann Oncol. 2021; 32:757–65. https://doi.org/10.1016/j.annonc.2021.02.017 [PubMed]
- 5. Rimal R, Desai P, Daware R, Hosseinnejad A, Prakash J, Lammers T, Singh S. Cancer-associated fibroblasts: Origin, function, imaging, and therapeutic targeting. Adv Drug Deliv Rev. 2022; 189:114504. https://doi.org/10.1016/j.addr.2022.114504 [PubMed]
- 6. Zheng S, Liang JY, Tang Y, Xie J, Zou Y, Yang A, Shao N, Kuang X, Ji F, Liu X, Tian W, Xiao W, Lin Y. Dissecting the role of cancer-associated fibroblast-derived biglycan as a potential therapeutic target in immunotherapy resistance: A tumor bulk and single-cell transcriptomic study. Clin Transl Med. 2023; 13:e1189. https://doi.org/10.1002/ctm2.1189 [PubMed]
- 7. Guo J, Zeng H, Chen Y. Emerging Nano Drug Delivery Systems Targeting Cancer-Associated Fibroblasts for Improved Antitumor Effect and Tumor Drug Penetration. Mol Pharm. 2020; 17:1028–48. https://doi.org/10.1021/acs.molpharmaceut.0c00014 [PubMed]
- 8. Loh JJ, Ma S. The Role of Cancer-Associated Fibroblast as a Dynamic Player in Mediating Cancer Stemness in the Tumor Microenvironment. Front Cell Dev Biol. 2021; 9:727640. https://doi.org/10.3389/fcell.2021.727640 [PubMed]
- 9. Ren Y, Jia HH, Xu YQ, Zhou X, Zhao XH, Wang YF, Song X, Zhu ZY, Sun T, Dou Y, Tian WP, Zhao XL, Kang CS, Mei M. Paracrine and epigenetic control of CAF-induced metastasis: the role of HOTAIR stimulated by TGF-ß1 secretion. Mol Cancer. 2018; 17:5. https://doi.org/10.1186/s12943-018-0758-4 [PubMed]
- 10. Lee YE, Go GY, Koh EY, Yoon HN, Seo M, Hong SM, Jeong JH, Kim JC, Cho D, Kim TS, Kim SC, Jun E, Jang M. Synergistic therapeutic combination with a CAF inhibitor enhances CAR-NK-mediated cytotoxicity via reduction of CAF-released IL-6. J Immunother Cancer. 2023; 11:e006130. https://doi.org/10.1136/jitc-2022-006130 [PubMed]
- 11. Feig C, Jones JO, Kraman M, Wells RJ, Deonarine A, Chan DS, Connell CM, Roberts EW, Zhao Q, Caballero OL, Teichmann SA, Janowitz T, Jodrell DI, et al. Targeting CXCL12 from FAP-expressing carcinoma-associated fibroblasts synergizes with anti-PD-L1 immunotherapy in pancreatic cancer. Proc Natl Acad Sci USA. 2013; 110:20212–7. https://doi.org/10.1073/pnas.1320318110 [PubMed]
- 12. Zheng S, Zou Y, Tang Y, Yang A, Liang JY, Wu L, Tian W, Xiao W, Xie X, Yang L, Xie J, Wei W, Xie X. Landscape of cancer-associated fibroblasts identifies the secreted biglycan as a protumor and immunosuppressive factor in triple-negative breast cancer. Oncoimmunology. 2022; 11:2020984. https://doi.org/10.1080/2162402X.2021.2020984 [PubMed]
- 13. Huang J, Tsang WY, Li ZH, Guan XY. The Origin, Differentiation, and Functions of Cancer-Associated Fibroblasts in Gastrointestinal Cancer. Cell Mol Gastroenterol Hepatol. 2023; 16:503–11. https://doi.org/10.1016/j.jcmgh.2023.07.001 [PubMed]
- 14. Kanzaki R, Pietras K. Heterogeneity of cancer-associated fibroblasts: Opportunities for precision medicine. Cancer Sci. 2020; 111:2708–17. https://doi.org/10.1111/cas.14537 [PubMed]
- 15. Bartoschek M, Oskolkov N, Bocci M, Lövrot J, Larsson C, Sommarin M, Madsen CD, Lindgren D, Pekar G, Karlsson G, Ringnér M, Bergh J, Björklund Å, Pietras K. Spatially and functionally distinct subclasses of breast cancer-associated fibroblasts revealed by single cell RNA sequencing. Nat Commun. 2018; 9:5150. https://doi.org/10.1038/s41467-018-07582-3 [PubMed]
- 16. Öhlund D, Handly-Santana A, Biffi G, Elyada E, Almeida AS, Ponz-Sarvise M, Corbo V, Oni TE, Hearn SA, Lee EJ, Chio II, Hwang CI, Tiriac H, et al. Distinct populations of inflammatory fibroblasts and myofibroblasts in pancreatic cancer. J Exp Med. 2017; 214:579–96. https://doi.org/10.1084/jem.20162024 [PubMed]
- 17. Elyada E, Bolisetty M, Laise P, Flynn WF, Courtois ET, Burkhart RA, Teinor JA, Belleau P, Biffi G, Lucito MS, Sivajothi S, Armstrong TD, Engle DD, et al. Cross-Species Single-Cell Analysis of Pancreatic Ductal Adenocarcinoma Reveals Antigen-Presenting Cancer-Associated Fibroblasts. Cancer Discov. 2019; 9:1102–23. https://doi.org/10.1158/2159-8290.CD-19-0094 [PubMed]
- 18. Galbo PM
Jr , Zang X, Zheng D. Molecular Features of Cancer-associated Fibroblast Subtypes and their Implication on Cancer Pathogenesis, Prognosis, and Immunotherapy Resistance. Clin Cancer Res. 2021; 27:2636–47. https://doi.org/10.1158/1078-0432.CCR-20-4226 [PubMed] - 19. Kieffer Y, Hocine HR, Gentric G, Pelon F, Bernard C, Bourachot B, Lameiras S, Albergante L, Bonneau C, Guyard A, Tarte K, Zinovyev A, Baulande S, et al. Single-Cell Analysis Reveals Fibroblast Clusters Linked to Immunotherapy Resistance in Cancer. Cancer Discov. 2020; 10:1330–51. https://doi.org/10.1158/2159-8290.CD-19-1384 [PubMed]
- 20. Dominguez CX, Müller S, Keerthivasan S, Koeppen H, Hung J, Gierke S, Breart B, Foreman O, Bainbridge TW, Castiglioni A, Senbabaoglu Y, Modrusan Z, Liang Y, et al. Single-Cell RNA Sequencing Reveals Stromal Evolution into LRRC15+ Myofibroblasts as a Determinant of Patient Response to Cancer Immunotherapy. Cancer Discov. 2020; 10:232–53. https://doi.org/10.1158/2159-8290.CD-19-0644 [PubMed]
- 21. Hao Y, Hao S, Andersen-Nissen E, Mauck WM 3rd, Zheng S, Butler A, Lee MJ, Wilk AJ, Darby C, Zager M, Hoffman P, Stoeckius M, Papalexi E, et al. Integrated analysis of multimodal single-cell data. Cell. 2021; 184:3573–87.e29. https://doi.org/10.1016/j.cell.2021.04.048 [PubMed]
- 22. Korsunsky I, Millard N, Fan J, Slowikowski K, Zhang F, Wei K, Baglaenko Y, Brenner M, Loh PR, Raychaudhuri S. Fast, sensitive and accurate integration of single-cell data with Harmony. Nat Methods. 2019; 16:1289–96. https://doi.org/10.1038/s41592-019-0619-0 [PubMed]
- 23. Zhang K, Erkan EP, Jamalzadeh S, Dai J, Andersson N, Kaipio K, Lamminen T, Mansuri N, Huhtinen K, Carpén O, Hietanen S, Oikkonen J, Hynninen J, et al. Longitudinal single-cell RNA-seq analysis reveals stress-promoted chemoresistance in metastatic ovarian cancer. Sci Adv. 2022; 8:eabm1831. https://doi.org/10.1126/sciadv.abm1831 [PubMed]
- 24. UniProt Consortium. UniProt: the Universal Protein Knowledgebase in 2023. Nucleic Acids Res. 2023; 51:D523–31. https://doi.org/10.1093/nar/gkac1052 [PubMed]
- 25. Wu T, Hu E, Xu S, Chen M, Guo P, Dai Z, Feng T, Zhou L, Tang W, Zhan L, Fu X, Liu S, Bo X, Yu G. clusterProfiler 4.0: A universal enrichment tool for interpreting omics data. Innovation (Camb). 2021; 2:100141. https://doi.org/10.1016/j.xinn.2021.100141 [PubMed]
- 26. Aibar S, González-Blas CB, Moerman T, Huynh-Thu VA, Imrichova H, Hulselmans G, Rambow F, Marine JC, Geurts P, Aerts J, van den Oord J, Atak ZK, Wouters J, Aerts S. SCENIC: single-cell regulatory network inference and clustering. Nat Methods. 2017; 14:1083–6. https://doi.org/10.1038/nmeth.4463 [PubMed]
- 27. Efremova M, Vento-Tormo M, Teichmann SA, Vento-Tormo R. CellPhoneDB: inferring cell-cell communication from combined expression of multi-subunit ligand-receptor complexes. Nat Protoc. 2020; 15:1484–506. https://doi.org/10.1038/s41596-020-0292-x [PubMed]
- 28. Yuan Y, Chen J, Wang J, Xu M, Zhang Y, Sun P, Liang L. Development and Clinical Validation of a Novel 4-Gene Prognostic Signature Predicting Survival in Colorectal Cancer. Front Oncol. 2020; 10:595. https://doi.org/10.3389/fonc.2020.00595 [PubMed]
- 29. Ritchie ME, Phipson B, Wu D, Hu Y, Law CW, Shi W, Smyth GK. limma powers differential expression analyses for RNA-sequencing and microarray studies. Nucleic Acids Res. 2015; 43:e47. https://doi.org/10.1093/nar/gkv007 [PubMed]
- 30. Geeleher P, Cox N, Huang RS. pRRophetic: an R package for prediction of clinical chemotherapeutic response from tumor gene expression levels. PLoS One. 2014; 9:e107468. https://doi.org/10.1371/journal.pone.0107468 [PubMed]
- 31. Schneider CA, Rasband WS, Eliceiri KW. NIH Image to ImageJ: 25 years of image analysis. Nat Methods. 2012; 9:671–5. https://doi.org/10.1038/nmeth.2089 [PubMed]
- 32. Tibshirani R. The lasso method for variable selection in the Cox model. Stat Med. 1997; 16:385–95. https://doi.org/10.1002/(sici)1097-0258(19970228)16:4<385::aid-sim380>3.0.co;2-3 [PubMed]
- 33. Pickett KL, Suresh K, Campbell KR, Davis S, Juarez-Colunga E. Random survival forests for dynamic predictions of a time-to-event outcome using a longitudinal biomarker. BMC Med Res Methodol. 2021; 21:216. https://doi.org/10.1186/s12874-021-01375-x [PubMed]
- 34. Chen T, Guestrin C. Xgboost: A scalable tree boosting systemed. 2016: 785–94. https://doi.org/10.1145/2939672.2939785
- 35. Li H, Courtois ET, Sengupta D, Tan Y, Chen KH, Goh JJ, Kong SL, Chua C, Hon LK, Tan WS, Wong M, Choi PJ, Wee LJ, et al. Reference component analysis of single-cell transcriptomes elucidates cellular heterogeneity in human colorectal tumors. Nat Genet. 2017; 49:708–18. https://doi.org/10.1038/ng.3818 [PubMed]
- 36. Grumolato L, Liu G, Haremaki T, Mungamuri SK, Mong P, Akiri G, Lopez-Bergami P, Arita A, Anouar Y, Mlodzik M, Ronai ZA, Brody J, Weinstein DC, Aaronson SA. β-Catenin-independent activation of TCF1/LEF1 in human hematopoietic tumor cells through interaction with ATF2 transcription factors. PLoS Genet. 2013; 9:e1003603. https://doi.org/10.1371/journal.pgen.1003603 [PubMed]
- 37. Neill G, Masson GR. A stay of execution: ATF4 regulation and potential outcomes for the integrated stress response. Front Mol Neurosci. 2023; 16:1112253. https://doi.org/10.3389/fnmol.2023.1112253 [PubMed]
- 38. Wu C, Rakhshandehroo T, Wettersten HI, Campos A, von Schalscha T, Jain S, Yu Z, Tan J, Mose E, Childers BG, Lowy AM, Weis SM, Cheresh DA. Pancreatic cancer cells upregulate LPAR4 in response to isolation stress to promote an ECM-enriched niche and support tumour initiation. Nat Cell Biol. 2023; 25:309–22. https://doi.org/10.1038/s41556-022-01055-y [PubMed]
- 39. Brunet JP, Tamayo P, Golub TR, Mesirov JP. Metagenes and molecular pattern discovery using matrix factorization. Proc Natl Acad Sci USA. 2004; 101:4164–9. https://doi.org/10.1073/pnas.0308531101 [PubMed]
- 40. Ding C, He X, Simon HD. On the equivalence of nonnegative matrix factorization and spectral clusteringed. SIAM. 2005:606–10.
- 41. Xie J, Zheng S, Zou Y, Tang Y, Tian W, Wong CW, Wu S, Ou X, Zhao W, Cai M, Xie X. Turning up a new pattern: Identification of cancer-associated fibroblast-related clusters in TNBC. Front Immunol. 2022; 13:1022147. https://doi.org/10.3389/fimmu.2022.1022147 [PubMed]
- 42. Lo A, Wang LS, Scholler J, Monslow J, Avery D, Newick K, O’Brien S, Evans RA, Bajor DJ, Clendenin C, Durham AC, Buza EL, Vonderheide RH, et al. Tumor-Promoting Desmoplasia Is Disrupted by Depleting FAP-Expressing Stromal Cells. Cancer Res. 2015; 75:2800–10. https://doi.org/10.1158/0008-5472.CAN-14-3041 [PubMed]
- 43. Ostermann E, Garin-Chesa P, Heider KH, Kalat M, Lamche H, Puri C, Kerjaschki D, Rettig WJ, Adolf GR. Effective immunoconjugate therapy in cancer models targeting a serine protease of tumor fibroblasts. Clin Cancer Res. 2008; 14:4584–92. https://doi.org/10.1158/1078-0432.CCR-07-5211 [PubMed]
- 44. Loeffler M, Krüger JA, Niethammer AG, Reisfeld RA. Targeting tumor-associated fibroblasts improves cancer chemotherapy by increasing intratumoral drug uptake. J Clin Invest. 2006; 116:1955–62. https://doi.org/10.1172/JCI26532 [PubMed]
- 45. Su S, Chen J, Yao H, Liu J, Yu S, Lao L, Wang M, Luo M, Xing Y, Chen F, Huang D, Zhao J, Yang L, et al. CD10+GPR77+ Cancer-Associated Fibroblasts Promote Cancer Formation and Chemoresistance by Sustaining Cancer Stemness. Cell. 2018; 172:841–56.e16. https://doi.org/10.1016/j.cell.2018.01.009 [PubMed]