


Introduction
About one-third of intracranial tumors are gliomas, the most frequent malignant tumor inside the brain that arises from the central nervous system (CNS) [1, 2]. According to molecular staging, tumor cell anisotropy, mesenchymal degeneration, nuclear fission activity, degree of microvascular proliferation, and degree of tumor necrosis, the World Health Organization divides gliomas into low-grade and high-grade gliomas [3, 4]. Currently, the main treatment options for patients with glioma include surgery, radiation therapy, chemotherapy, and follow-up observation [5–7]. Of these, surgery is currently recognized as the first line of treatment [8, 9]. Few studies have been reported on the clinical characteristics and prognostic factors related to glioma patients, and in addition, few studies have been published on the prediction models associated with the prognosis of gliomas patients. In order to create a useful prognostic prediction model for glioma patients, we therefore created a nomogram for predicting overall survival (OS).
We collected the data from the Surveillance, Epidemiology, and End Results (seer) Database since the development of such a predictive model necessitates a sizable clinical database with a big sample size, multicenter, and high confidence. Publicly available oncology data from 28% of the US population are bundled in the Seer database, which also includes information on patient demographics, primary tumor sites, treatment details, and survival rates [10]. The nomogram is a visual graphical presentation of complex mathematical formulas [11, 12]. By integrating different clinical variables, nomograms can create statistical predictive models that can be used to help determine the risk of cancer recurrence or death [13]. This work aims to provide an accurate estimate of OS and risk assessment for glioma patients undergoing additional treatment by creating a complete and useful nomogram for glioma patients utilizing the SEER database.
Results
Features of the patients
3,375 glioma patients in all, who met the selection criteria, were gathered for this investigation from the SEER database. R program randomly allocated 2,362 patients (69.99%) to the training set and 1,013 patients (30.01%) to the test set, divided the patients into two groups based on the proportion of 7:3 (Figure 1). Among the training cohort, 2,130 patients (90.2%) were White, 1,371 patients (58.0%) were male, and 1,548 patients (65.5%) were between the ages of 40 and 60. Regarding the validation cohort, 581 (57.4%) patients were male, and 639 (63.1%) patients were aged 40-60 years old. Table 1 displays the particular baseline clinicopathological characteristics.
Table 1. Summary of clinicopathologic features and treatments of patients with glioma.
| All | Training | Test | p-value | |
| N=3375 | N=2362 | N=1013 | ||
| Age | 0.591 | |||
| <18 | 30 (0.89%) | 21 (0.89%) | 9 (0.89%) | |
| 18-65 | 2187 (64.8%) | 1548 (65.5%) | 639 (63.1%) | |
| 66-79 | 892 (26.4%) | 611 (25.9%) | 281 (27.7%) | |
| ≥80 | 266 (7.88%) | 182 (7.71%) | 84 (8.29%) | |
| Race | 0.677 | |||
| White | 3047 (90.3%) | 2130 (90.2%) | 917 (90.5%) | |
| Black | 138 (4.09%) | 101 (4.28%) | 37 (3.65%) | |
| Other | 190 (5.63%) | 131 (5.55%) | 59 (5.82%) | |
| Gender | 0.739 | |||
| Male | 1952 (57.8%) | 1371 (58.0%) | 581 (57.4%) | |
| Female | 1423 (42.2%) | 991 (42.0%) | 432 (42.6%) | |
| Laterality | 0.529 | |||
| Left | 1472 (43.6%) | 1025 (43.4%) | 447 (44.1%) | |
| Right | 1518 (45.0%) | 1075 (45.5%) | 443 (43.7%) | |
| Not a paired site | 385 (11.4%) | 262 (11.1%) | 123 (12.1%) | |
| Site | 0.226 | |||
| Frontal lobe | 1334 (39.5%) | 951 (40.3%) | 383 (37.8%) | |
| Temporal lobe | 830 (24.6%) | 577 (24.4%) | 253 (25.0%) | |
| Parietal lobe | 602 (17.8%) | 409 (17.3%) | 193 (19.1%) | |
| Occipital lobe | 134 (3.97%) | 102 (4.32%) | 32 (3.16%) | |
| Overlapping lesion | 475 (14.1%) | 323 (13.7%) | 152 (15.0%) | |
| Histological | 0.053 | |||
| Mixed glioma | 158 (4.68%) | 107 (4.53%) | 51 (5.03%) | |
| Astrocytoma | 795 (23.6%) | 569 (24.1%) | 226 (22.3%) | |
| Glioblastoma | 2021 (59.9%) | 1386 (58.7%) | 635 (62.7%) | |
| Oligodendroglioma | 401 (11.9%) | 300 (12.7%) | 101 (9.97%) | |
| Surgery | 0.898 | |||
| Yes | 2768 (82.0%) | 1939 (82.1%) | 829 (81.8%) | |
| No | 607 (18.0%) | 423 (17.9%) | 184 (18.2%) | |
| Radiotherapy | 0.819 | |||
| Yes | 2642 (78.3%) | 1846 (78.2%) | 796 (78.6%) | |
| No | 733 (21.7%) | 516 (21.8%) | 217 (21.4%) | |
| Radiation sequence with surgery: | 0.924 | |||
| Prior to surgery | 15 (0.44%) | 10 (0.42%) | 5 (0.49%) | |
| After surgery | 2204 (65.3%) | 1542 (65.3%) | 662 (65.4%) | |
| Before and after | 8 (0.24%) | 5 (0.21%) | 3 (0.30%) | |
| Unknown | 1148 (34.0%) | 805 (34.1%) | 343 (33.9%) | |
| Chemotherapy | 0.85 | |||
| Yes | 2305 (68.3%) | 1616 (68.4%) | 689 (68.0%) | |
| No | 1070 (31.7%) | 746 (31.6%) | 324 (32.0%) | |
| Status | 0.047 | |||
| Alive | 644 (19.1%) | 472 (20.0%) | 172 (17.0%) | |
| Dead | 2731 (80.9%) | 1890 (80.0% | 841 (83.0%) | |
| Marital | 0.982 | |||
| Married | 2199 (65.2%) | 1534 (64.9%) | 665 (65.6%) | |
| Single | 571 (16.9%) | 403 (17.1%) | 168 (16.6%) | |
| Separated/Divorced | 315 (9.33%) | 221 (9.36%) | 94 (9.28%) | |
| Widowed | 290 (8.59%) | 204 (8.64%) | 86 (8.49%) | |
| Size (mm) | 0.326 | |||
| <26 | 780 (23.1%) | 542 (22.9%) | 238 (23.5%) | |
| 27-44 | 1336 (39.6%) | 920 (39.0%) | 416 (41.1%) | |
| >44 | 1259 (37.3%) | 900 (38.1%) | 359 (35.4%) | |
| Grade | 0.688 | |||
| Grade I+II | 278 (8.24%) | 198 (8.38%) | 80 (7.90%) | |
| Grade III+IV | 3097 (91.8%) | 2164 (91.6%) | 933 (92.1%) |
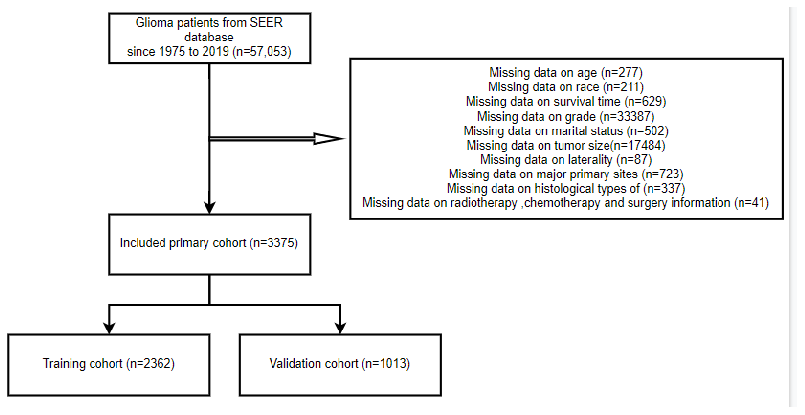
Figure 1. The flow diagram of how cases were selected from the SEER database.
Survival prognostic factor analysis using clinical factors
The univariate analysis results for the training cohort showed that the following factors were related to glioma patient survival: age, race, laterality, primary site, histological type, surgery, chemotherapy, marital status, and grade (all P<0.05). But there was no correlation between tumor size, treatment, or sex and survival (all P>0.05). Age, primary site, histological type, surgery, chemotherapy, marital status, grade, and other factors (all P<0.05) were linked in the multivariate analysis to lower overall survival (OS) rates for glioma patients. Tables 2, 3 display the findings of the univariate and multivariate analyses. To further visualize the findings, forest plots were created (Figure 2).
Table 2. Univariate Cox regression analysis of overall survival in the training cohort.
| Hazard rate (95%CI) | p-value | ||
| Age | |||
| <18 | 1.00 | ||
| 18-65 | 2.12 (1.13-3.94) | 0.018 | |
| 66-79 | 7 (3.74-13.1) | <0.001 | |
| ≥80 | 13.49 (7.12-25.56) | <0.001 | |
| Race | |||
| White | 1.00 | ||
| Black | 0.9 (0.72-1.12) | 0.347 | |
| Other | 0.73 (0.59-0.9) | 0.004 | |
| Gender | |||
| Male | 1.00 | ||
| Female | 0.96 (0.87-1.05) | 0.347 | |
| Laterality | |||
| Left | 1.00 | ||
| Right | 1.08 (0.98-1.19) | 0.1 | |
| Not a paired site | 1.55 (1.34-1.79) | <0.001 | |
| Site | |||
| Frontal lobe | 1.00 | ||
| Temporal lobe | 1.55 (1.38-1.75) | <0.001 | |
| Parietal lobe | 1.58 (1.38-1.79) | <0.001 | |
| Occipital lobe | 2.07 (1.67-2.57) | <0.001 | |
| Overlapping lesion | 1.82 (1.59-2.09) | <0.001 | |
| Histological | |||
| Mixed glioma | 1.00 | ||
| Astrocytoma | 1.67 (1.26-2.21) | <0.001 | |
| Glioblastoma | 5.74 (4.38-7.52) | <0.001 | |
| Oligodendroglioma | 0.87 (0.63-1.18) | 0.365 | |
| Surgery | |||
| Yes | 1.00 | ||
| No | 2.07 (1.85-2.31) | <0.001 | |
| Radiotherapy | |||
| Yes | 1.00 | ||
| No | 1.12 (1-1.25) | 0.057 | |
| Radiation sequence with surgery: | |||
| Prior to surgery | 1.00 | ||
| After surgery | 1 (0.52-1.93) | 0.995 | |
| Before and after | 1.36 (0.46-4.07) | 0.579 | |
| Unknown | 1.36 (0.71-2.63) | 0.358 | |
| Chemotherapy | |||
| Yes | 1.00 | ||
| No | 1.31 (1.19-1.45) | <0.001 | |
| Marital | |||
| Married | 1.00 | ||
| Single | 0.49 (0.43-0.57) | <0.001 | |
| Separated/Divorced | 1.16 (1-1.35) | 0.058 | |
| Widowed | 2.71 (2.33-3.15) | <0.001 | |
| Size (mm) | |||
| <26 | 1.00 | ||
| 27-44 | 1.01 (0.9-1.14) | 0.866 | |
| >44 | 0.88 (0.68-1.09) | 0.054 | |
| Grade | |||
| Grade I+II | 1.00 | ||
| Grade III+IV | 3.88 (3.12-4.83) | <0.001 | |
Table 3. Multivariate Cox regression analysis of overall survival in the training cohort.
| Hazard rate (95%CI) | p-value | ||
| Age | |||
| <18 | 1.00 | ||
| 18-65 | 1.21 (0.639-2.28) | 0.56 | |
| 66-79 | 2.44 (1.28-4.65) | 0.0068 | |
| ≥80 | 3.35 (1.73-6.49) | <0.001 | |
| Race | |||
| White | 1.00 | ||
| Black | 1.01 (0.805-1.27) | 0.92 | |
| Other | 0.856 (0.69-1.06) | 0.16 | |
| Laterality | |||
| Left | 1.00 | ||
| Right | 1.09 (0.992-1.21) | 0.072 | |
| Not a paired site | 1.19 (0.873-1.63) | 0.27 | |
| Site | |||
| Frontal lobe | 1.00 | ||
| Temporal lobe | 1.21 (1.07-1.36) | 0.002 | |
| Parietal lobe | 1.17 (1.02-1.33) | 0.022 | |
| Occipital lobe | 1.03 (0.822-1.28) | 0.82 | |
| Overlapping lesion | 1.13 (0.844-1.52) | 0.41 | |
| Histological | |||
| Mixed glioma | 1.00 | ||
| Astrocytoma | 1.23 (0.923-1.63) | 0.16 | |
| Glioblastoma | 3.52 (2.65-4.66) | <0.001 | |
| Oligodendroglioma | 0.718 (0.524-0.983) | 0.039 | |
| Surgery | |||
| Yes | 1.00 | ||
| No | 1.87 (1.66-2.11) | <0.001 | |
| Chemotherapy | |||
| Yes | 1.00 | ||
| No | 2.08 (1.86-2.32) | <0.001 | |
| Marital | |||
| Married | 1.00 | ||
| Single | 0.735 (0.634-0.851) | <0.001 | |
| Separated/Divorced | 1.14 (0.977-1.33) | 0.096 | |
| Widowed | 1.2 (1.02-1.41) | 0.027 | |
| Grade | |||
| Grade I+II | 1.00 | ||
| Grade III+IV | 2.99 (2.36-3.79) | <0.001 | |
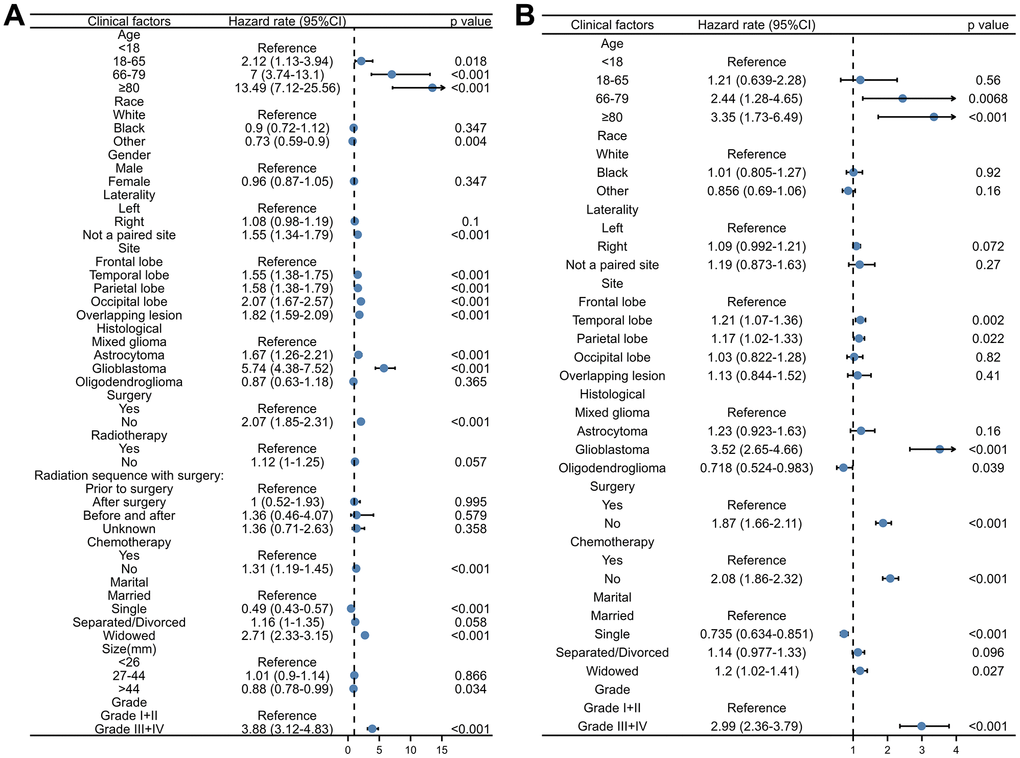
Figure 2. The forest plot of the univariate and multivariate Cox regression analysis of OS in the training cohort. (A) Univariate Cox regression analysis. (B) Multivariate Cox regression analysis.
Construction and validation of the nomogram
We created a nomogram based on each of the aforementioned independent OS-related factors from the univariate and multivariate Cox regression analysis in order to forecast the OS of glioma patients. Age, primary site, histological type, surgery, chemotherapy, marital status, and grade are among the independent factors. Every independent prognostic factor was given a final score via the nomogram. A weighted total score derived from each variable was used to determine the 1-, 3-, and 5-year OS prognosis of glioma patients. As illustrated in Figure 3, protective variables for glioma patients include younger age, frontal lobe primary site, histological type of oligodendroglioma, receiving surgery, receiving chemotherapy, and marital status of single and low-grade gliomas. Older age, the primary site of an overlapping lesion, the histological type of glioblastoma, not undergoing chemotherapy or surgery, being separated from their spouse, and high-grade glioma were all associated with a poor prognosis for glioma patients.
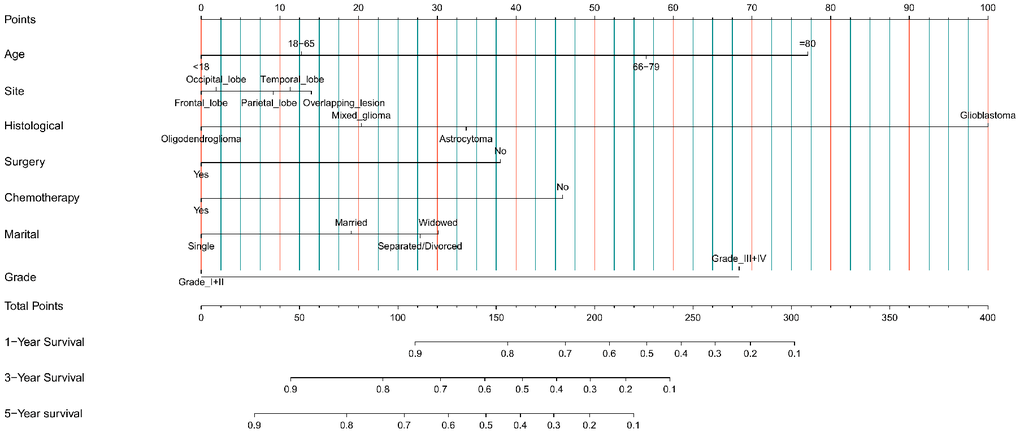
Figure 3. Nomogram prediction model of 1-year, 3-year, and 5-year OS rates in the training cohort.
Discrimination and calibration techniques were used to internally validate the performance of this predictive model. Glioma patients’ C-index values in the training cohort were 0.779 (95% CI=0.769-0.789). The nomogram showed a higher prediction accuracy for OS, as demonstrated by the AUCs of each independent prognostic predictor of OS in the training set at 1-, 3-, and 5-year ROC curves, as shown in Figure 4A–4C. The training cohort predicted by the nomogram was represented by the 1-, 3-, and 5-year AUCs, which were, respectively, 0.850, 0.881, and 0.930. A strong connection was found between the observed OS and the nomogram prediction of 1-, 3-, and 5-year survival, as shown by the calibration plots of the nomogram based on age, primary site, histological type, surgery, chemotherapy, marital status, and grade (Figure 4D–4F). The C-index values in the validation cohort were 0.776 (95% CI=0.760-0.792). The validation set’s ROC curve showed AUCs for OS at1,3, and 5 years to be 0.853, 0.886, and 0.902, respectively (Figure 5A–5C). These values suggest that the nomogram exhibited good accuracy and dependability. Furthermore, the 1-, 3-, and 5-year calibration curves demonstrated remarkable agreement between the expected outcomes and the actual survival rate of patients with gliomas (Figure 5D–5F). Better clinical applications for the risk-scoring model were also highlighted by the DCA curves (Figure 6).
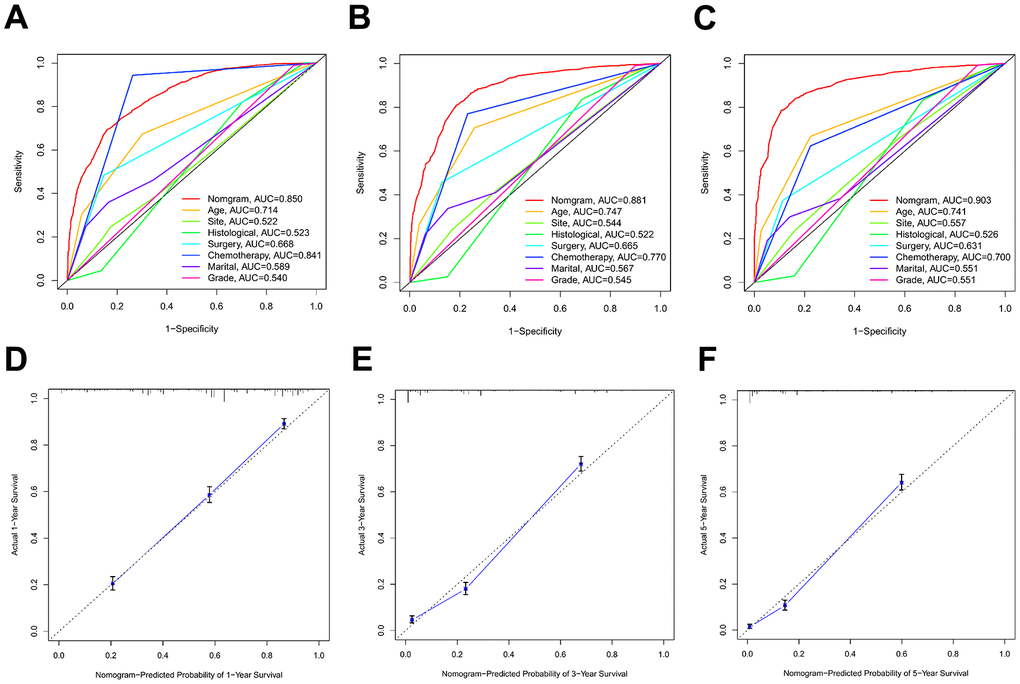
Figure 4. The ROC curves and calibration plots in the training cohort. (A–C) ROC curves of 1-year, 3-year, and 5-year OS rates in the training cohort. (D–F) Calibration plots of 1-year, 3-year, and 5-year OS rates in the training cohort.
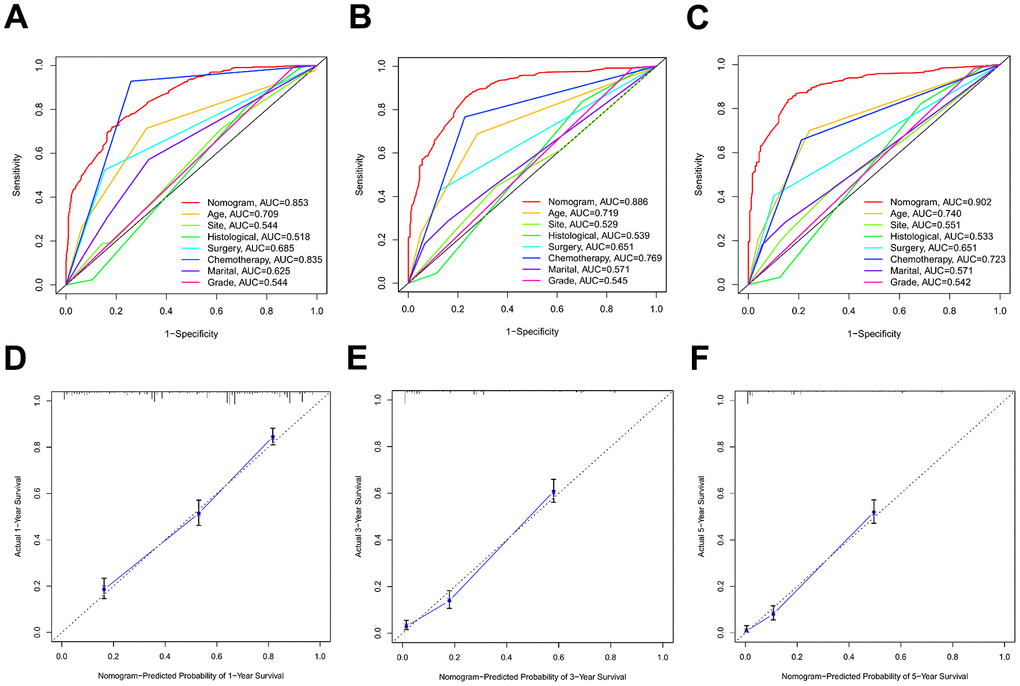
Figure 5. The ROC curves and calibration plots in the validation cohort. (A–C) ROC curves of 1-year, 3-year, and 5-year OS rates in the validation cohort. (D–F) Calibration plots of 1-year, 3-year, and 5-year OS rates in the validation cohort.
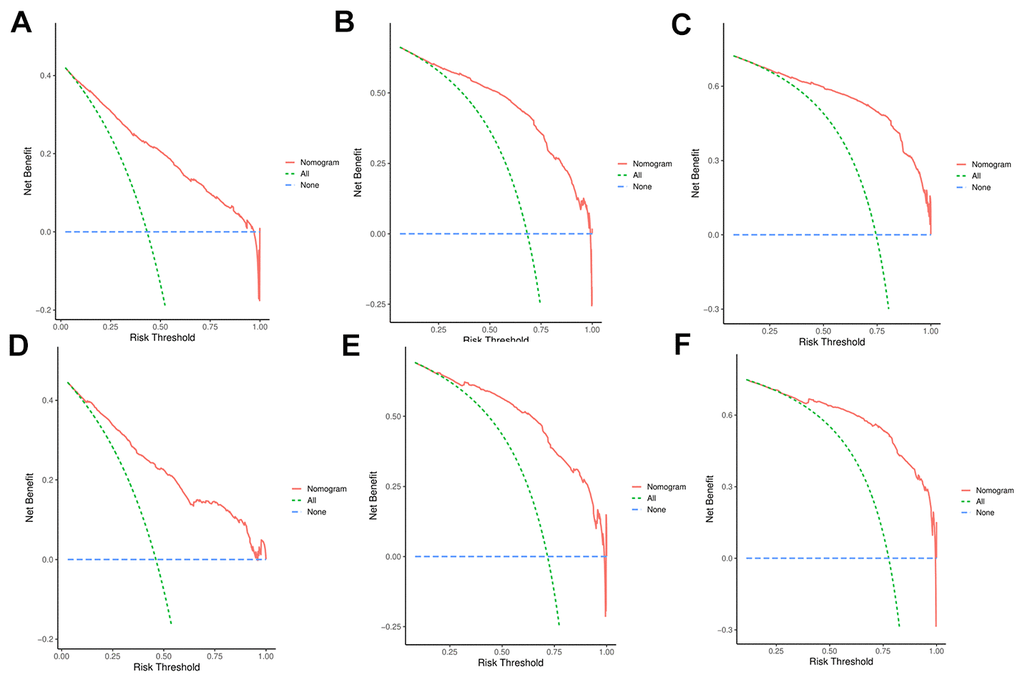
Figure 6. (A–C) DCA analysis predicting 1-, 3-, and 5-year overall survival (OS) in the training cohort; (D–F) DCA analysis predicting 1-, 3-, and 5-year overall survival (OS) in the validation cohort.
Survival analyses
The risk scores of the patients were calculated by summing up the scores from the single items. The patients were then split into low-risk and high-risk groups based on the median. Kaplan-Meier plots were utilized for survival analysis, and the results indicated that patients in the low-risk group had a much better prognosis (P<0.001) than those in the high-risk group (Figure 7).
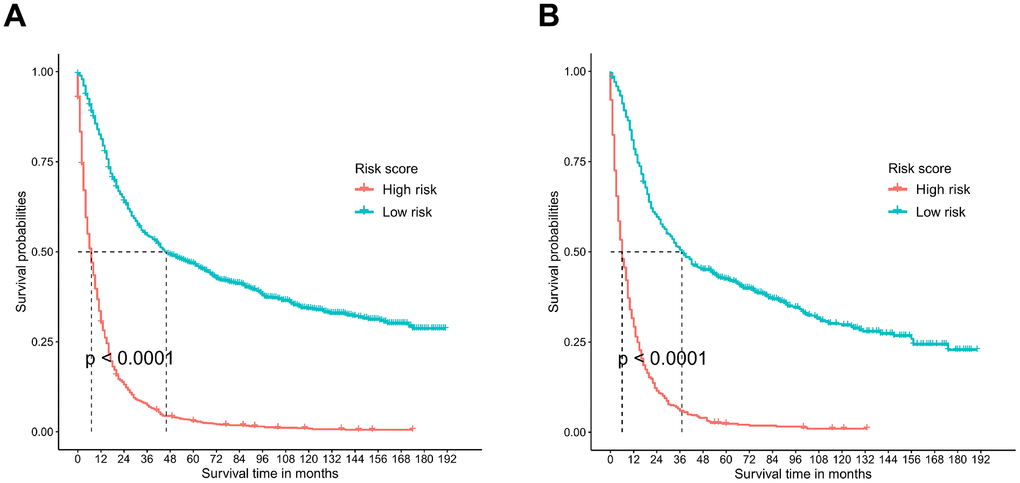
Figure 7. Survival analysis performed by Kaplan-Meier analysis. (A) Training cohort. (B) Validation cohort.
Discussion
Eighty-one percent of brain tumors that were malignant were gliomas, the most frequent primary intracranial tumor [14–16]. Because of its aggression, the prognosis was dismal and substantial mortality occurred. Currently, the outcome of glioma treatment is unsatisfactory, with an overall 5-year survival rate of less than 5% [17]. Gliomas have a high recurrence rate and recurrence can occur at any time after surgery, up to 36.7% at 6 months after surgery [18–20]. For this reason, it’s critical to precisely identify the variables affecting glioma patients’ prognosis in order to direct further care. Therefore, a nomogram was utilized to combine several clinical parameters in order to evaluate the patient prognosis and measure the survival of glioma patients in a more thorough manner. Glioma cases were taken from the SEER database for this investigation [21]. Seventy percent of the participants were utilized as the test set, and the remaining thirty percent were used to investigate the relationship between several characteristics that could have an impact on the patients’ overall survival. Age, primary site, histological type, surgery, chemotherapy, marital status, and grade were found to be independent prognostic factors influencing individuals with gliomas [22].
For glioma patients, age is a significant prognostic factor, particularly for those 65 years of age or older, meaning that an older patient has a higher chance of a poor prognosis. The preceding research have generally indicated that age and tumor survival are related. For instance, age was determined to be one of the most significant prognostic factors in Zhang’s study, which created and assessed a predictive nomogram model for adult ventricular glioma patients [23]. An additional finding of a Li et al. predictive model for patients with cerebellar glioma is that the age at diagnosis has a significant impact on overall survival outcomes [24]. In addition, we found that the prognosis of glioma patients varied among the different primary sites. The primary site of overlapping lesion patients had a relatively poor prognosis. This could be because glioma excision in overlapping lesions is challenging and more likely to result in poor surgical outcomes and recurrence [25]. As to histological type, glioblastoma is identified as the most prognostic type. It is well-known that glioblastoma, as a grade IV glioma, is one of the most malignant and intractable central nervous system tumors with high recurrence, low survival rate, and poor prognosis [26]. Surgical resection is the mainstay of treatment for glioma, where complete removal of the tumor as much as possible is the key to treatment [27]. The results of this study showed that surgical treatment was beneficial in improving the prognosis of patients. A study by Nsir et al. reported eight cases of ventricular glioblastoma. Compared with patients without tumor resection, three patients with total tumor resection had better prognosis [27]. Moreover, chemotherapy is also recognized as one of the prognostic factors in our study. Chemotherapy is an important tool in the treatment of glioma, especially for patients unable to undergo surgery. Chemotherapy can kill the tumor cells that remain after surgery, thus prolonging the progression-free survival and overall survival of patients [28–30]. Moreover, glioma patients’ poor prognosis was independently associated with both divorce and widowhood. This is in line with earlier research by Xie et al.l [31]. So, it is suggested that the healthcare system should be aware that patients with an aborted marriage need more social and physiological support. Compared with low-grade glioma, HRs of high-grade glioma are higher. The degree of interstitial change of the tumor tissue, which includes the local infiltration of cancer cells and the degree of differentiation, organization, and number of nuclear divisions, is used to establish the tumor grade. It can serve as a guide for prognosis and clinical treatment.
The shortcomings of our study need to be mentioned. Firstly, we only selected partial histologic types and representative sites of gliomas, so the data on rare histologic types and special sites of gliomas were not included. Secondly, detailed and comprehensive information on patients’ treatment, such as treatment modality, radiotherapy dose, and use of alternative therapies, is not available in the SEER database, which leads to an inability to fully and objectively interpret our results. In addition, patients’ disease histories are not well documented, which may affect mortality. Moreover, the nomogram calibration plot analyses of relapse-free survival could not be performed because of the lack of relevant data. Additionally, limitations in access, compatibility, and representativeness of other databases posed significant challenges. Future studies are indeed planned to incorporate additional databases for validation purposes, which we believe will strengthen the robustness and applicability of our model. Finally, because this is a retrospective study, selection bias may have occurred during the patient selection procedure. Despite the above-mentioned limitations, the distinct advantages of our study were also listed. First of all, enough sample data of cancer patients are stored in the SEER database, which may guarantee the validity of the study’s conclusions. Second, after building the prediction model, we tested it using an internal test set. The validation results point to the model’s stability and dependability.
To sum up, this study comprehensively summarized and analyzed the clinical characteristics and independent prognostic factors of glioma patients, and further constructed the nomogram prediction model of OS. The prediction model has reliable prediction efficiency, which is helpful for clinicians to assess the survival probability of glioma patients easily.
Materials and Methods
Retrieve data
The clinical and survival data of glioma patients were extracted and retrieved using SEER*Stat 8.3.6 software from the SEER (http://seer.cancer.gov/) database. This database collected data from 18 registries, representing roughly 30% of the US population. Site codes and histology codes were utilized for data screening, following the guidelines provided by the third edition of the International Classification of Diseases for Oncology (ICD-O-3). Glioma patients who were diagnosed between 1975 and 2019 were retrieved based on the selection criteria. Our study’s inclusion criteria were as follows: (1) We only include the frontal lobe, temporal lobe, parietal lobe, occipital lobe, and overlapping brain lesions (C71.1, C71.2, C71.3, C71.4, and C71.8) as main primary sites of gliomas. The four main histological kinds of gliomas are oligodendroglioma (M9382, M9440, M9400, and M9450), glioblastoma, mixed glioma, and astrocytoma. Also, exclusion criteria were listed: (1) Missing data on age, race, survival time, grade, marital status, tumor size, and laterality. (2) Missing data on treatment information, including surgery, chemotherapy, and radiotherapy.
The demographics of glioma patients (age, race, gender, and marital status), disease characteristics (histological type, laterality, primary site, tumor size, and tumor grade), and treatment details (radiation, surgery, chemotherapy, and radiation sequence with surgery) were the variables that were chosen for our study. Our primary endpoint was overall survival (OS), which is measured from the time of diagnosis to death or the conclusion of the last inquiry.
Construction and verification of nomogram
Patients were categorized into training and test groups using a 7:3 ratio. Using univariate and multivariate Cox regression analysis, independent prognostic indicators for OS in the training set were found, and the nomogram was subsequently created. The covariates in the subsequent multivariate Cox regression analysis were included if their p-value was less than 0.05 in the univariate analysis. The survival nomogram was created using the components in the multivariate analysis whose p-value was less than 0.05.
The training and validation sets were used to test the nomogram, and the ROC curves, C-index values, and calibration plots were used to assess it. To examine the degree of difference between the actual value and the anticipated value, calibration plots were employed. The discrimination was represented by the estimated C-index. Additionally, to display the sensitivity and specificity, ROC curves were plotted. Ultimately, a decision curve analysis was run to assess the clinical advantages. The R4.1.1 version was used to construct the nomogram, calibration plots, ROC curves, and DCA plots. Adobe Illustrator CS6 was used to mix and rearrange the later images.
Statistical analysis
Age was originally classified as a continuous variable, but it was later modified to an ordered one. The χ2 test or Fisher’s exact test were used to examine the following factors: gender, ethnicity, laterality, primary site, histological type, primary, surgery, radiation, radiation sequence with surgery, chemotherapy, and marital status. These variables are classified as disordered classification variables. The Mann-Whitney U test was also used to examine ordered classification variables, such as age, tumor size, and grade. The Kaplan-Meier method was used to visually assess the differences in survival rates between the high-risk and low-risk groups. At the p <0.05 level, statistical significance was acknowledged.
Author Contributions
Dr. Xiaokang Wang designed the whole research study. Xiaokang Wang and Wei Huang performed research. Yuhe Lei, Gengrui Xu and Xiongbin Cao collated the data and carried out data analyses. Xiaokang Wang contributed to drafting the manuscript. All authors have read and approved the final submitted manuscript.
Conflicts of Interest
The authors declare that they have no conflicts of interest.
Funding
This study was supported by the Guangdong Basic and Applied Basic Research Foundation (No. 2023A1515111116), the Guangdong Provincial Hospital Pharmaceutical Research Foundation (No. 2023KJ07), the Shenzhen Foundation of Science and Technology (No. JCYJ20230807151308018), the Futian Healthcare Research Project (No. FTWS2022027, FTWS2022059), Medical Scientific Research Foundation of Guangdong Province (A2023310), Shenzhen Longhua District Science and Technology Innovation Fund Projects (2022045, 2020036, and 2022056) and Research Foundation of Shenzhen Longhua District Central Hospital (202203).
References
- 1. Wang Z, Chen G. Insights about circadian clock in glioma: From molecular pathways to therapeutic drugs. CNS Neurosci Ther. 2022; 28:1930–41. https://doi.org/10.1111/cns.13966 [PubMed]
- 2. van den Bent MJ, Geurts M, French PJ, Smits M, Capper D, Bromberg JEC, Chang SM. Primary brain tumours in adults. Lancet. 2023; 402:1564–79. https://doi.org/10.1016/S0140-6736(23)01054-1 [PubMed]
- 3. Louis DN, Ohgaki H, Wiestler OD, Cavenee WK, Burger PC, Jouvet A, Scheithauer BW, Kleihues P. The 2007 WHO classification of tumours of the central nervous system. Acta Neuropathol. 2007; 114:97–109. https://doi.org/10.1007/s00401-007-0243-4 [PubMed]
- 4. Brat DJ, Scheithauer BW, Fuller GN, Tihan T. Newly codified glial neoplasms of the 2007 WHO Classification of Tumours of the Central Nervous System: angiocentric glioma, pilomyxoid astrocytoma and pituicytoma. Brain Pathol. 2007; 17:319–24. https://doi.org/10.1111/j.1750-3639.2007.00082.x [PubMed]
- 5. Muscas G, Orlandini S, Becattini E, Battista F, Staartjes VE, Serra C, Della Puppa A. Radiomic Features Associated with Extent of Resection in Glioma Surgery. Acta Neurochir Suppl. 2022; 134:341–7. https://doi.org/10.1007/978-3-030-85292-4_38 [PubMed]
- 6. Fakhoury KR, Ney DE, Ormond DR, Rusthoven CG. Immunotherapy and radiation for high-grade glioma: a narrative review. Transl Cancer Res. 2021; 10:2537–70. https://doi.org/10.21037/tcr-20-1933 [PubMed]
- 7. Hanna C, Lawrie TA, Rogozińska E, Kernohan A, Jefferies S, Bulbeck H, Ali UM, Robinson T, Grant R. Treatment of newly diagnosed glioblastoma in the elderly: a network meta-analysis. Cochrane Database Syst Rev. 2020; 3:CD013261. https://doi.org/10.1002/14651858.CD013261.pub2 [PubMed]
- 8. Fangusaro J, Jones DT, Packer RJ, Gutmann DH, Milde T, Witt O, Mueller S, Fisher MJ, Hansford JR, Tabori U, Hargrave D, Bandopadhayay P. Pediatric low-grade glioma: State-of-the-art and ongoing challenges. Neuro Oncol. 2024; 26:25–37. https://doi.org/10.1093/neuonc/noad195 [PubMed]
- 9. Gogos AJ, Young JS, Morshed RA, Hervey-Jumper SL, Berger MS. Awake glioma surgery: technical evolution and nuances. J Neurooncol. 2020; 147:515–24. https://doi.org/10.1007/s11060-020-03482-z [PubMed]
- 10. Doll KM, Rademaker A, Sosa JA. Practical Guide to Surgical Data Sets: Surveillance, Epidemiology, and End Results (SEER) Database. JAMA Surg. 2018; 153:588–9. https://doi.org/10.1001/jamasurg.2018.0501 [PubMed]
- 11. Wang X, Xu K, Liao X, Rao J, Huang K, Gao J, Xu G, Wang D. Construction of a survival nomogram for gastric cancer based on the cancer genome atlas of m6A-related genes. Front Genet. 2022; 13:936658. https://doi.org/10.3389/fgene.2022.936658 [PubMed]
- 12. Balachandran VP, Gonen M, Smith JJ, DeMatteo RP. Nomograms in oncology: more than meets the eye. Lancet Oncol. 2015; 16:e173–80. https://doi.org/10.1016/S1470-2045(14)71116-7 [PubMed]
- 13. Iasonos A, Schrag D, Raj GV, Panageas KS. How to build and interpret a nomogram for cancer prognosis. J Clin Oncol. 2008; 26:1364–70. https://doi.org/10.1200/JCO.2007.12.9791 [PubMed]
- 14. Ostrom QT, Bauchet L, Davis FG, Deltour I, Fisher JL, Langer CE, Pekmezci M, Schwartzbaum JA, Turner MC, Walsh KM, Wrensch MR, Barnholtz-Sloan JS. The epidemiology of glioma in adults: a “state of the science” review. Neuro Oncol. 2014; 16:896–913. https://doi.org/10.1093/neuonc/nou087 [PubMed]
- 15. Hou X, Du H, Deng Y, Wang H, Liu J, Qiao J, Liu W, Shu X, Sun B, Liu Y. Gut microbiota mediated the individualized efficacy of Temozolomide via immunomodulation in glioma. J Transl Med. 2023; 21:198. https://doi.org/10.1186/s12967-023-04042-5 [PubMed]
- 16. Chen Y, Miao L, Lin H, Zhuo Z, He J. The role of m6A modification in pediatric cancer. Biochim Biophys Acta Rev Cancer. 2022; 1877:188691. https://doi.org/10.1016/j.bbcan.2022.188691 [PubMed]
- 17. Ulasov IV, Borovjagin AV, Schroeder BA, Baryshnikov AY. Oncolytic adenoviruses: A thorny path to glioma cure. Genes Dis. 2014; 1:214–26. https://doi.org/10.1016/j.gendis.2014.09.009 [PubMed]
- 18. Zikou A, Sioka C, Alexiou GA, Fotopoulos A, Voulgaris S, Argyropoulou MI. Radiation Necrosis, Pseudoprogression, Pseudoresponse, and Tumor Recurrence: Imaging Challenges for the Evaluation of Treated Gliomas. Contrast Media Mol Imaging. 2018; 2018:6828396. https://doi.org/10.1155/2018/6828396 [PubMed]
- 19. Nussbaumer G, Benesch M, Grabovska Y, Mackay A, Castel D, Grill J, Alonso MM, Antonelli M, Bailey S, Baugh JN, Biassoni V, Blattner Johnson M, Broniscer A, et al. Gliomatosis cerebri in children: A poor prognostic phenotype of diffuse gliomas with a distinct molecular profile. Neuro Oncol. 2024; 8:noae080. [Epub ahead of print]. https://doi.org/10.1093/neuonc/noae080 [PubMed]
- 20. Ren X, Deng D, Xiang S, Feng J. Promoter hypomethylated PDZK1 acts as a tumorigenic gene in glioma by interacting with AKT1. Aging (Albany NY). 2024; 16:7174–87. https://doi.org/10.18632/aging.205750 [PubMed]
- 21. Nie GL, Luo W, Yan J, Wang HP, Li X. Construction of Predictive and Prognostic Nomograms for Distant Metastases in Hepatocellular Carcinoma Based on SEER Database. Cancer Screening and Prevention. 2022; 1:11–24. https://doi.org/10.14218/csp.2022.00006
- 22. Chen Y, Liao Y, Jia X, Lin H, Miao L, Yuan L, Huang X, Zhou J, Bian J, Zhuo Z. Association of ERCC1 and XPF polymorphisms with pediatric glioma susceptibility. Chin Med J (Engl). 2023; 136:746–8. https://doi.org/10.1097/CM9.0000000000002126 [PubMed]
- 23. Zhang HD, Niu XD, Zhou XW, Yang Y, Li JM, Gan YJ, Wang X, Liu YH, Mao Q. [Development and Evaluation of Prognostic Nomogram Model for Adult Ventricle Glioma Patients]. Sichuan Da Xue Xue Bao Yi Xue Ban. 2022; 53:588–96. https://doi.org/10.12182/20220760203 [PubMed]
- 24. Li J, Huang W, Chen J, Li Z, Liu B, Wang P, Zhang J. Nomograms for predicting the overall survival of patients with cerebellar glioma: an analysis of the surveillance epidemiology and end results (SEER) database. Sci Rep. 2021; 11:19348. https://doi.org/10.1038/s41598-021-98960-3 [PubMed]
- 25. Wang J, Hu G, Quan X. Analysis of the Factors Affecting the Prognosis of Glioma Patients. Open Med (Wars). 2019; 14:331–5. https://doi.org/10.1515/med-2019-0031 [PubMed]
- 26. Kabir F, Apu MNH. Multi-omics analysis predicts fibronectin 1 as a prognostic biomarker in glioblastoma multiforme. Genomics. 2022; 114:110378. https://doi.org/10.1016/j.ygeno.2022.110378 [PubMed]
- 27. Price M, Neff C, Nagarajan N, Kruchko C, Waite KA, Cioffi G, Cordeiro BB, Willmarth N, Penas-Prado M, Gilbert MR, Armstrong TS, Barnholtz-Sloan JS, Ostrom QT. CBTRUS Statistical Report: American Brain Tumor Association & NCI Neuro-Oncology Branch Adolescent and Young Adult Primary Brain and Other Central Nervous System Tumors Diagnosed in the United States in 2016-2020. Neuro Oncol. 2024 (Supplement_3); 26:iii1–53. https://doi.org/10.1093/neuonc/noae047 [PubMed]
- 28. Bjorland LS, Fluge O, Gilje B, Mahesparan R, Farbu E. Treatment approach and survival from glioblastoma: results from a population-based retrospective cohort study from Western Norway. BMJ Open. 2021; 11:e043208. https://doi.org/10.1136/bmjopen-2020-043208 [PubMed]
- 29. Wang J, Wei J, Inuzuka H. Aging and cancer hallmarks as therapeutic targets. Acta Materia Medica. 2023; 2:281–4. https://doi.org/10.15212/amm-2023-0018
- 30. Guo J, Wang MF, Zhu Y, Watari F, Xu YH, Chen X. Exploitation of platelets for antitumor drug delivery and modulation of the tumor immune microenvironment. Acta Materia Medica. 2023; 2:172–90. https://doi.org/10.15212/amm-2023-0005
- 31. Xie JC, Yang S, Liu XY, Zhao YX. Marital status is associated with survival of patients with astrocytoma. J Clin Neurosci. 2018; 56:79–87. https://doi.org/10.1016/j.jocn.2018.07.005 [PubMed]