Submit an Article
Navigate
Home
Editorial Board
Editorial Policies
Current Volume
Archive
Scientific Integrity
Publication Ethics Statements
Interviews with Outstanding Authors
Newsroom
Sponsored Conferences
Podcast
Contact
Special Collections
Submit an Article
Online ISSN: 1945-4589
Research Paper
|
Volume 16, Issue 13
|
pp. 10905–10917
Development and validation of a nomogram to predict overall survival in patients with glioma: a population-based study
Back to article
Figure 1
(1 of 7)
−
100%
+
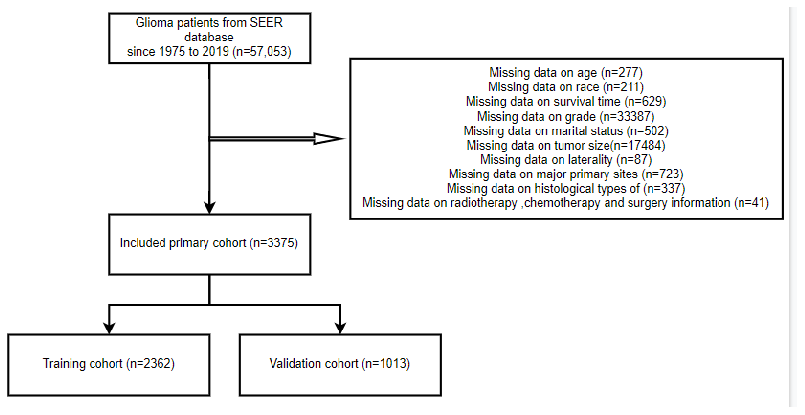
Figure 1.
The flow diagram of how cases were selected from the SEER database.
Figure 1 — Development and validation of a nomogram to predict overall survival in patients with glioma: a population-based study | Aging