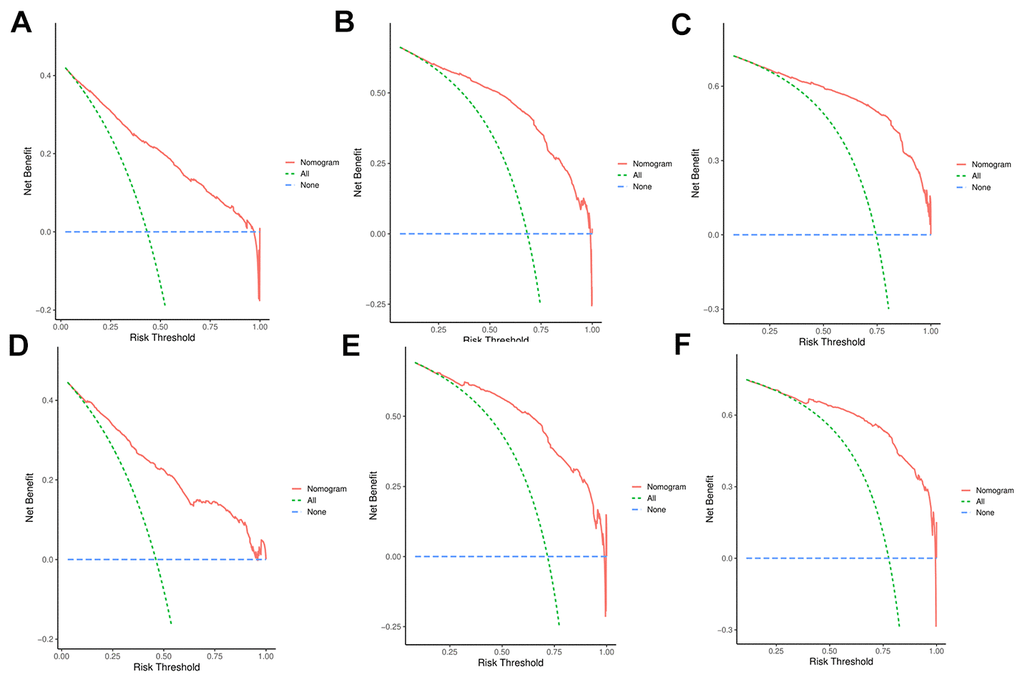
Figure 6.(A–C) DCA analysis predicting 1-, 3-, and 5-year overall survival (OS) in the training cohort; (D–F) DCA analysis predicting 1-, 3-, and 5-year overall survival (OS) in the validation cohort.
Figure 6 — Development and validation of a nomogram to predict overall survival in patients with glioma: a population-based study | Aging