


Introduction
Lung cancer (LUCA) is one of the most common malignant diseases around the world, which results in the predominant cancer deaths [1, 2]. It was estimated that there were 116,300 and 112,520 new LUCA and bronchus cancer cases among males and females in the United States by 2020, respectively [3]. The estimated deaths of them were 72,500 and 63,220, respectively. LUCA is mainly composed of small cell lung carcinoma (15–20%) and non-small cell lung carcinoma (NSCLC) (80–85%), and LUSC is a pathological subtype of NSCLC, which accounts for approximately 40% of all LUCA [4, 5]. In recent years, although great progress has been made in the diagnosis and treatments for LUSC, the prognosis of LUSC patients was still unfavorable due to the lack of specific targets and effective targeted drugs compared to lung adenocarcinoma [6, 7]. The local recurrence and distant metastasis (e.g., brain, liver) were common in LUSC, even in early stage. Therefore, it is of great significance to identify more efficient and specific biomarkers for LUSC to prolong patients’ survival.
Thymus cell antigen 1 (THY1), also called as cluster of differentiation (CD90). THY1 is one of cell surface glycoproteins with a molecular weight of 25-37KDa. It is widely expressed in various parts of humans and mice (fibroblasts, neurons, murine T cells, etc.) [8, 9]. It is a key molecule of the interactions between cell and cell or cell and matrix [10]. THY1 was reported to play pivotal roles in a variety of malignant diseases, and the functions of THY1 had tissue heterogeneity, which indicated that it could be an oncogene or a tumor suppressor gene at different diseases. For example, THY1 was over-expressed in undifferentiated hepatocellular carcinoma, and was significantly correlated with poorer prognosis [11]. THY1 has also been confirmed to be highly expressed in prostate cancer and male breast cancer [12]. Nevertheless, THY1 played an opposite role in ovarian cancer [13, 14]. At present, there is still a wide gap in our understanding of how THY1 plays a role in LUSC.
The identification of novel biomarkers can provide a new perspective for the development of targeted drugs and the early diagnosis. Here, we aimed to explore the expression, prognostic significance, and functional mechanism of THY1 in LUSC using bioinformatics technology.
Results
Over-expression of THY1 in many malignant tumors
We firstly used the GEPIA to explore the expression of THY1 in tumors and normal tissues. As shown in Figure 1A, THY1 was widely expressed in a variety of malignant tumors (i.e., brain cancer, lung cancer, colon cancer) and normal organs (i.e., brain, kidney, breast). We further used the ONCOMINE to explore the full landscape of THY1 expression in different malignant tumors compared to normal tissues. As shown in Figure 1B, THY1 was significantly up-regulated in many human cancer (e.g., breast cancer, colorectal cancer, liver cancer, gastric cancer, lung cancer), and the down-regulated THY1 was occurred in brain and CNS cancer, kidney cancer, and ovarian cancer. We also evaluated the expression level of THY1 in many malignancies in TCGA using TIMER. Results indicated that THY1 was significantly upregulated in breast cancer, cholangiocarcinoma (CHOL), colon adenocarcinoma, esophageal carcinoma, head and neck squamous cell carcinoma, liver hepatocellular carcinoma, lung adenocarcinoma, LUSC, prostate adenocarcinoma, rectum adenocarcinoma, stomach adenocarcinoma, and thyroid carcinoma. Nevertheless, it was down-regulated in kidney chromophobe, kidney renal cell carcinoma, kidney renal papillary cell carcinoma, and uterine corpus endometrial carcinoma (Figure 1C).
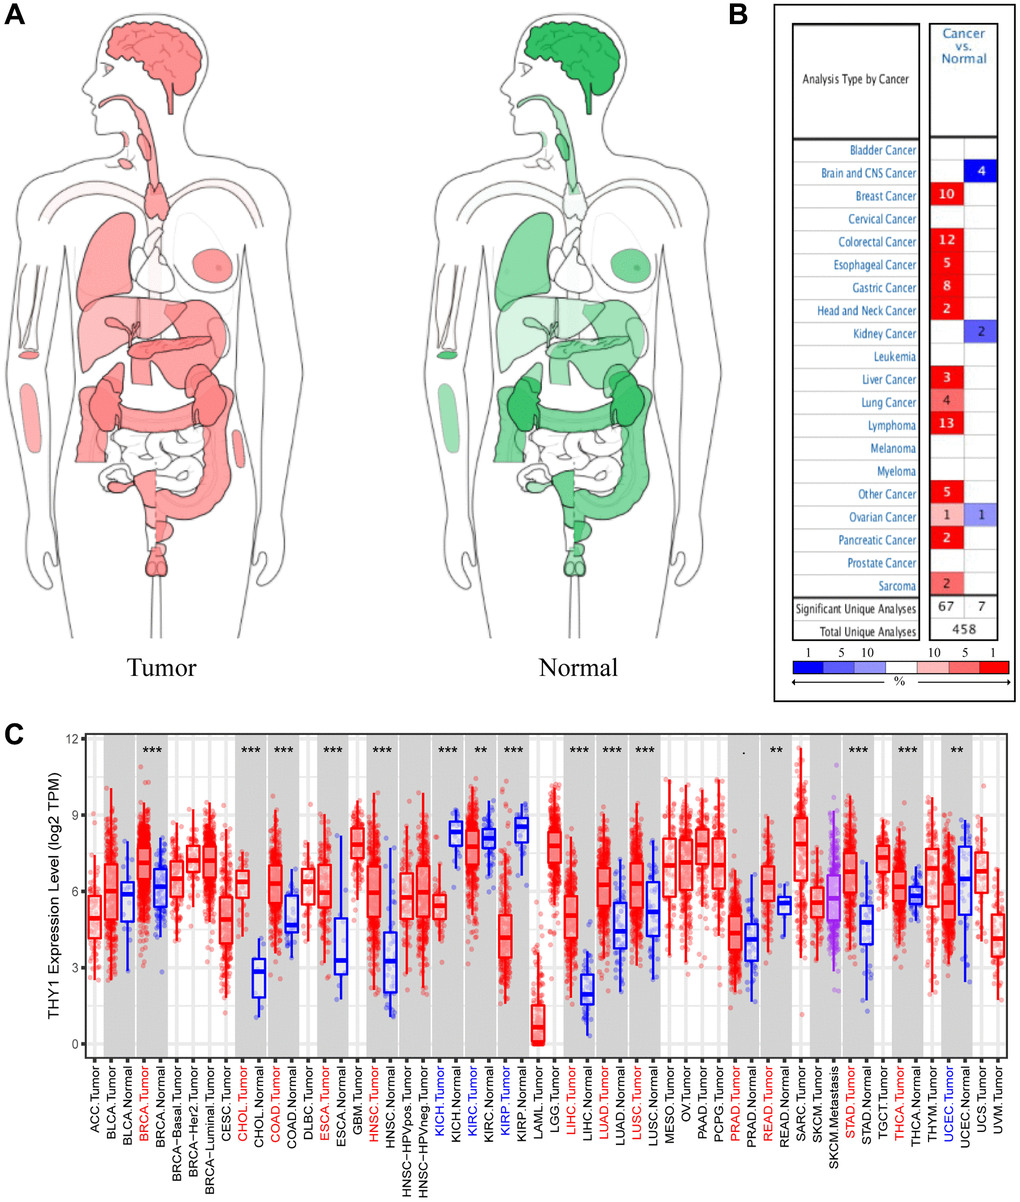
Figure 1. Differentially expressed THY1 in a variety of cancers and normal tissues. (A) The interactive body-map revealed the median expression of THY1 in tumor (red) and normal samples (green) using GEPIA (scale: Log2 (TPM+1)). (B) The expression levels of THY1 in different tumors compared to normal tissues from ONCOMINE database. (C) The expression levels of THY1 in 33 types of cancers compared to normal tissues from TCGA in TIMER database.
The prognostic significance of differentially expressed THY1 in many cancers
We then explored the prognostic significance of THY1 in LUSC using the PrognoScan database. As shown in Figure 2A–2O, up-regulated THY1 was significantly correlated with the poorer prognosis in many malignancies. However, over-expression of THY1 also favored a better prognosis in some cancers. We further used the GEPIA to measure the prognostic values of THY1 in 33 types of cancers from TCGA. As shown in Figure 2P and Supplementary Figure 1, elevated THY1 significantly correlated with poor overall survival (OS) in glioblastoma multiforme, kidney renal papillary cell carcinoma, LUSC, mesothelioma, ovarian cancer, skin cutaneous melanoma, and uveal melanoma. Meanwhile, over-expression of THY1 also predicted poor (DFS) in esophageal carcinoma, kidney renal papillary cell carcinoma, prostate adenocarcinoma, skin cutaneous melanoma, and uveal melanoma (Figure 2Q and Supplementary Figure 2). Results from the PrognoScan and GEPIA consistently demonstrated that up-regulated THY1 significantly predicted poorer survival in many malignant tumors, including LUSC.
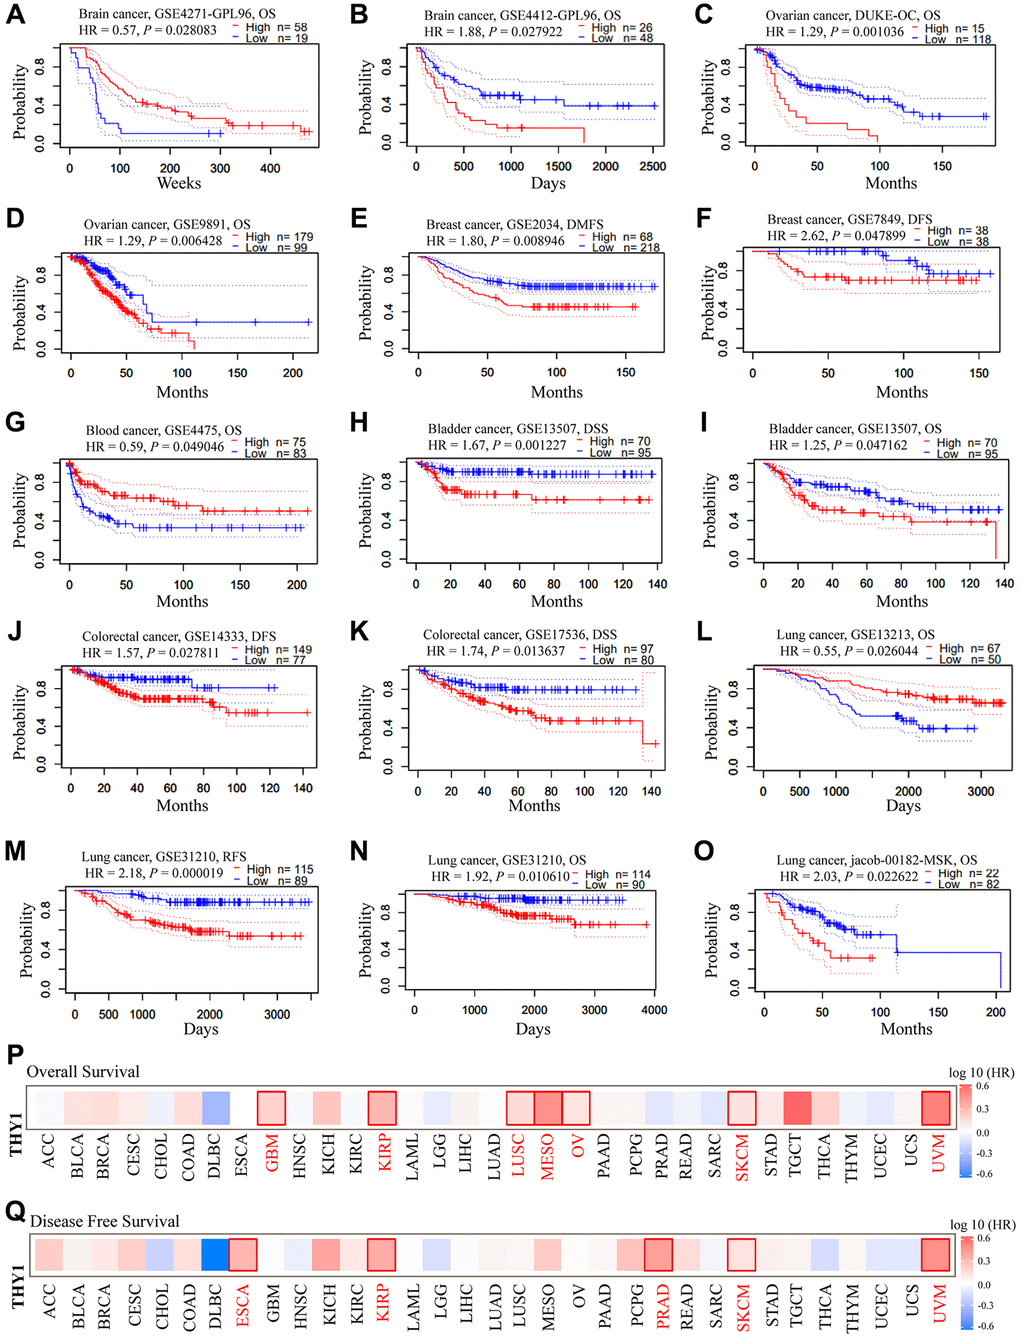
Figure 2. The prognostic significance of up-regulated THY1 in many types of cancers. (A–O) Relationships between higher expression of THY1 and prognosis in different types of cancers in PrognoScan database. (P) The prognostic value (OS) of differentially expressed THY1 in 33 types of cancer form TCGA in GEPIA database. (Q) The prognostic value (DFS) of differentially expressed THY1 in 33 types of cancer from TCGA in GEPIA database. Abbreviations: OS: overall survival; DFS: disease-free survival; DMFS: disease-metastasis free survival; DSS: disease specific survival; RFS: relapse free survival.
The relationships between THY1 expression and clinicopathological parameters in LUSC
Based on the above results, we found that THY1 was significantly up-regulated and correlated with poor prognosis in LUSC. We then further explored the relationships between THY1 expression level and clinicopathological parameters in LUSC using the UALCAN. As shown in Figure 3A–3F, THY1 was significantly correlated with smoking habits, age, TP53 mutation status, nodal metastasis status, gender, and individual cancer stages in LUSC. We also measured the relationships between THY1 expression and prognosis in LUSC under different clinicopathological parameters using the Kapan-Meier plotter. However, there is little correlation between THY1 expression and OS, first progression (FP), and post progression survival (PPS) under these restricted situations (Supplementary Table 1).
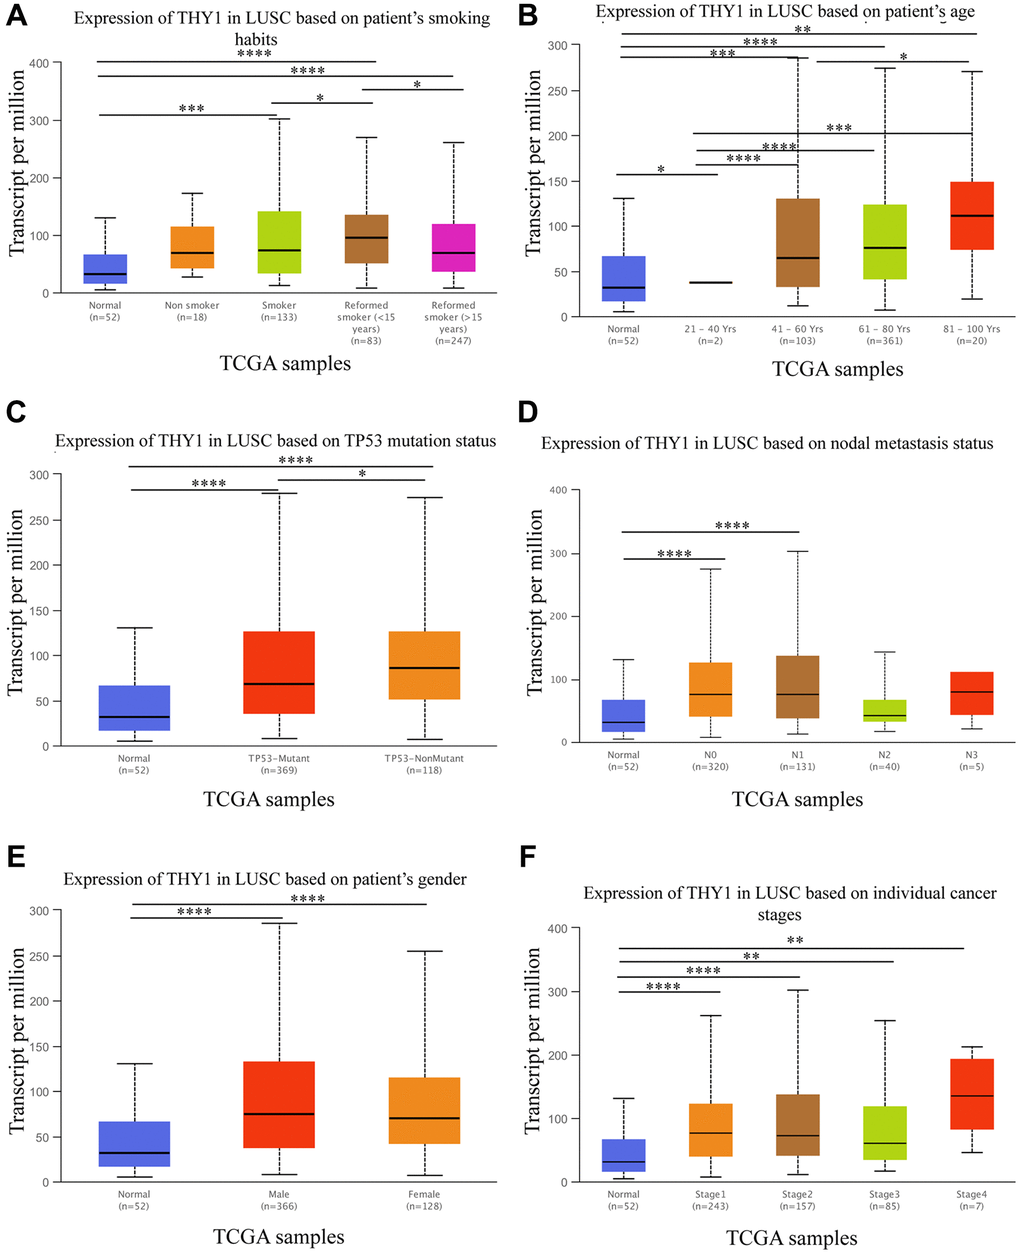
Figure 3. Relationships between THY1 expression and clinicopathological parameters in LUSC. (A–F) Relationships between THY1 expression and patient’s smoking habits, age, TP53 mutation status, nodal metastasis status, gender, and individual cancer stage in LUSC from UALCAN database. *P < 0.05; **P < 0.01; ***P < 0.001; ****P < 0.0001.
The methylation level of THY1 in LUSC and normal tissues
Many studies have confirmed that the dysregulation of oncogenes or tumor suppressor genes DNA methylation played pivotal roles in the occurrence and development of malignant tumors [15]. Here, we used some online databases to explore the methylation level of THY1 in LUSC and normal tissues. As shown in Figure 4A, 8 probes (8/20) indicated the methylation of THY1 in LUSC were lower than that in normal tissues using the TCGA Wander. The average promoter methylation of THY1 in LUSC was also lower compared to normal tissues (P = 1.041E-02) using the UALCAN (Figure 4B). Furthermore, the THY1 methylation level was negatively correlated with its mRNA expression (Cor = −0.25, FDR = 1.1E-06), and the THY1 was also significantly up-regulated in LUSC compared to normal tissues (Figure 4C, 4D). Finally, we also used the MEXPRESS to measure the relationships between different THY1 CpG islands methylation and THY1 expression level. As shown in Figure 4E, we identified 6 CpG islands among 16 CpG islands of THY1 that were significantly correlated with THY1 expression. In summary, these results consistently indicated that CpG islands methylation of THY1 played pivotal roles in over-expression of THY1 in LUSC.
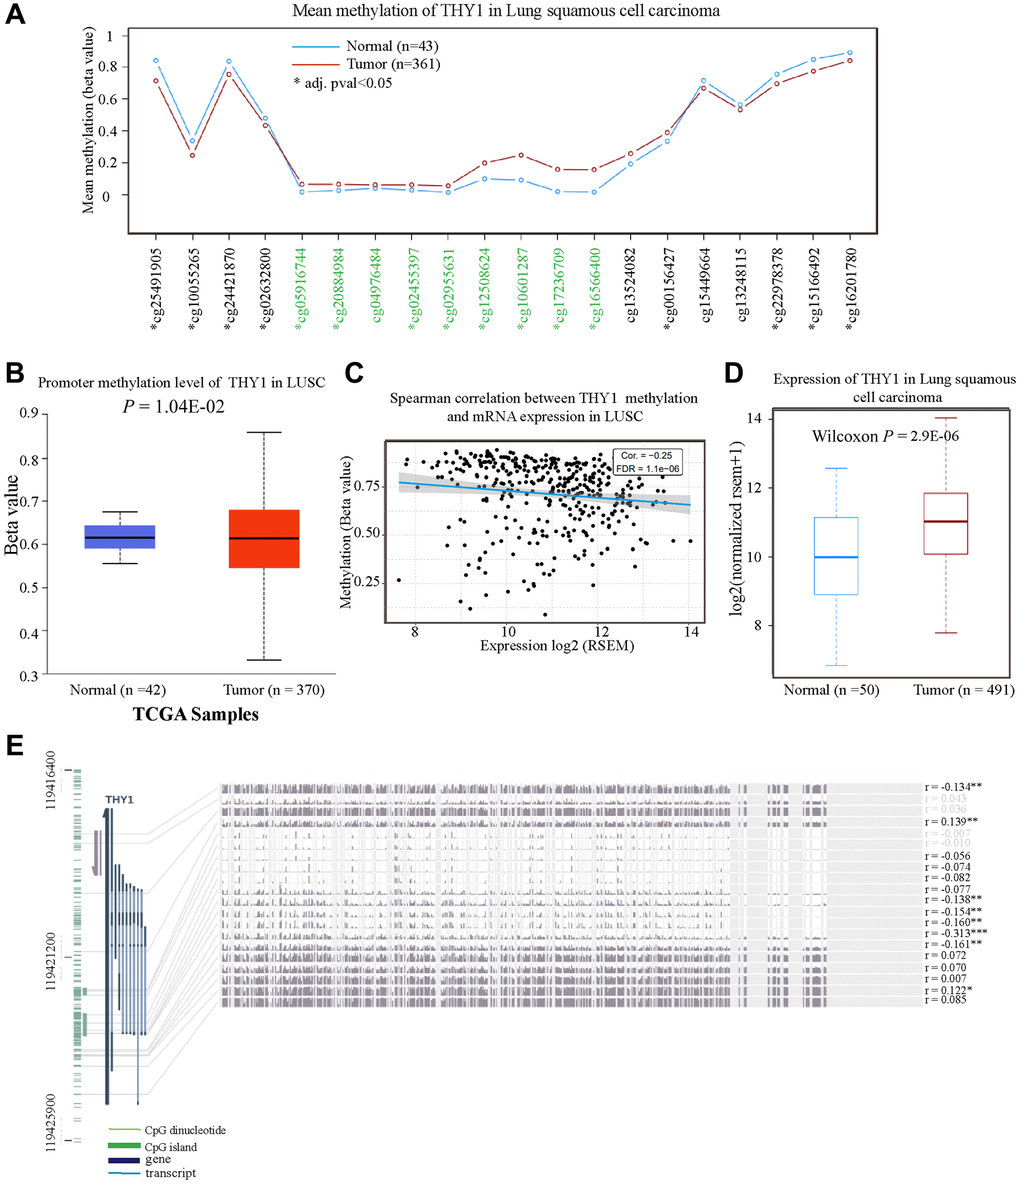
Figure 4. The methylation level of THY1 in LUSC and normal tissues. (A) Mean methylation level of THY1 in LUSC and normal tissues regarding different probes using the TCGA Wander. (B) Promoter methylation level of THY1 in LUSC using UALCAN. (C) Relationships between THY1 methylation and mRNA expression in LUSC using GSCA. (D) Expression level of THY1 in LUSC and normal tissues using TCGA Wander. (E) Relationships between different THY1 CpG islands methylation and THY1 expression using MEXPRESS. *P < 0.05; **P < 0.01; ***P < 0.001.
Functional enrichment analysis of identified differentially expressed genes correlated with THY1 in LUSC
We also aimed to further explore the potential mechanism mediated by THY1 in LUSC. We identified genes that were positively or negatively correlated with THY1 in LUSC using the LinkedOmics. As shown in Figure 5A, there were 10,495 positively correlated and 9,608 negatively correlated genes of THY1 in LUSC (P < 0.05). The top 50 positively and negatively correlated genes were displayed in Figure 5B, 5C. The protein- protein interaction network (PPI) network of these top genes was constructed using the STRING (Figure 5D). Functional enrichment analysis of these 100 correlated genes indicated that they were mainly correlated with the formation of ECM, and were got mainly involved in the process of EMT (Figure 5E).
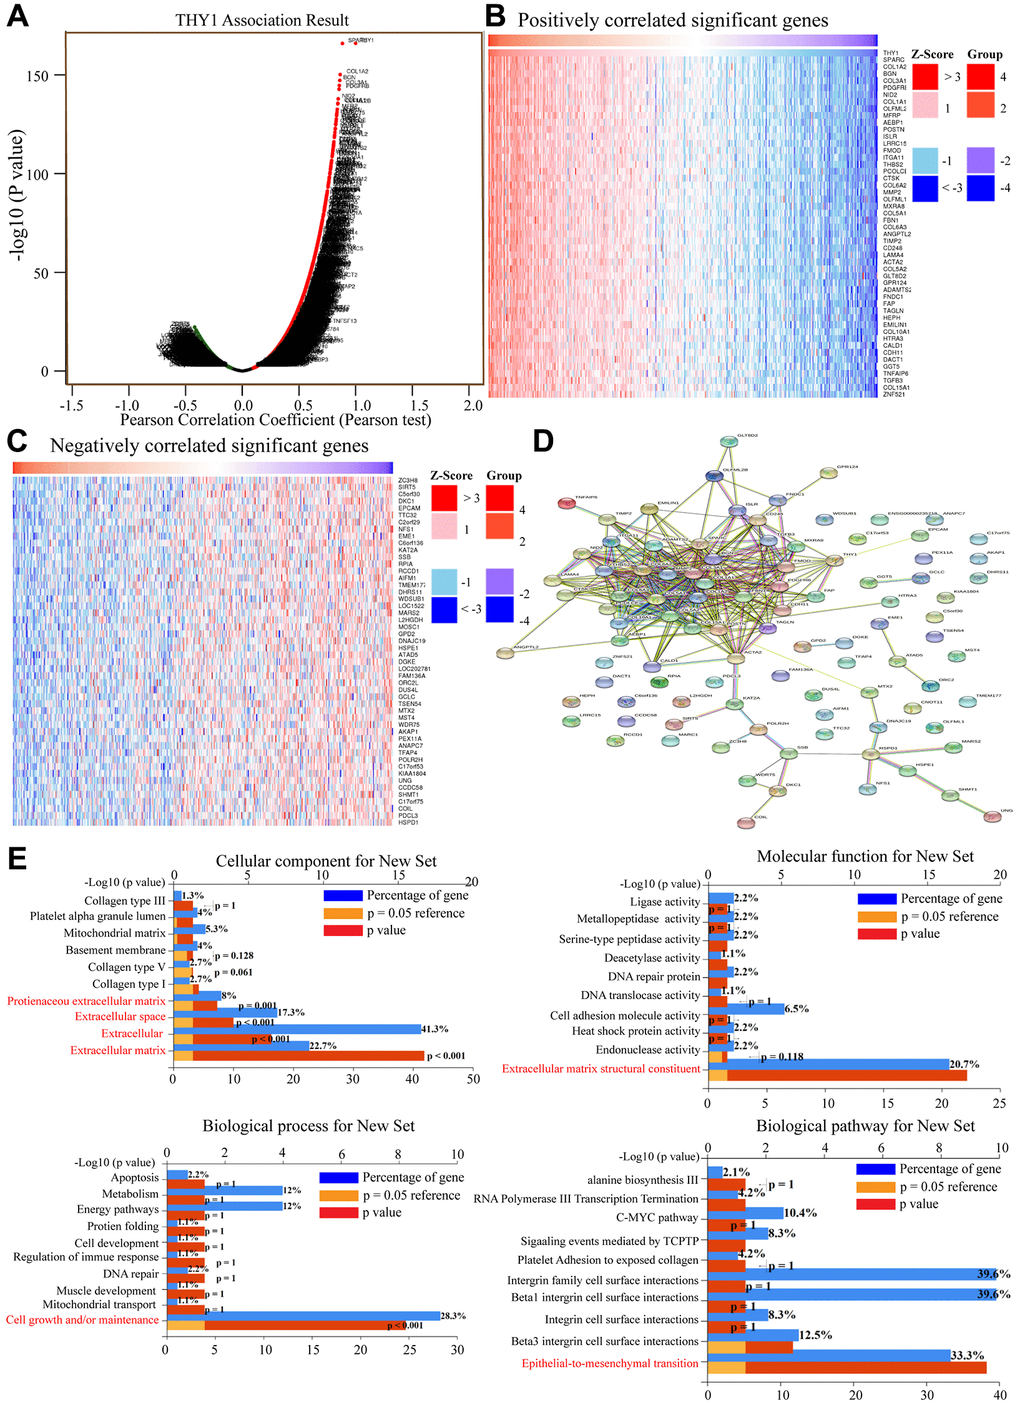
Figure 5. Functional enrichment analysis of correlated genes of THY1 in LUSC. (A) Genes that positively or negatively correlated with THY1 in LUSC measured by Pearson test in LinkedOmics. (B) Heatmap of positively correlated genes of THY1 in LUSC. (C) Heatmap of negatively correlated genes of THY1 in LUSC. (D) Protein-protein interactive network of top correlated genes constructed by STRING. (E) Functional enrichment analysis of these top correlated genes regarding cellular component, molecular function, biological process, and biological pathway using FunRich 3.v.13.
THY1 expression is correlated with immune cell abundance in LUSC
Studies had indicated that the tumor immune microenvironment was closely related to the prognosis of patients, and the abundance of tumor infiltrating immunocytes played a pivotal role [16, 17]. Hence, we further measured the relationships between THY1 expression and immune cell infiltrates in 39 types of cancer from TCGA. As shown in Figure 6A and Supplementary Figure 3, there was a significant correlation between THY1 expression and tumor purity in 26 types of cancers. Among them, THY1 expression was negatively correlated with tumor purity (cor = −0.38, P = 7.59E-28), and THY1 expression had a positive correlation with B cell (cor = 0.197, P = 1.70E-05), CD8+ cell (cor = 0.166, P = 2.70E-04), CD4+ cell (cor = 0.393, P = 5.11E-19), Macrophage (cor = 0.316, P = 1.49E-12), Neutrophil (cor = 0.412, P = 6.62E-21), and Dendritic cell (cor = 0.451, P = 4.22E-15) in LUSC. Nevertheless, there was no significant correlation between THY1 expression and tumor purity (cor = −0.311, P = 6.46e-02) and other immune lymphocytes (P > 0.05) in CHOL. CHOL was used as the control in the following analysis.
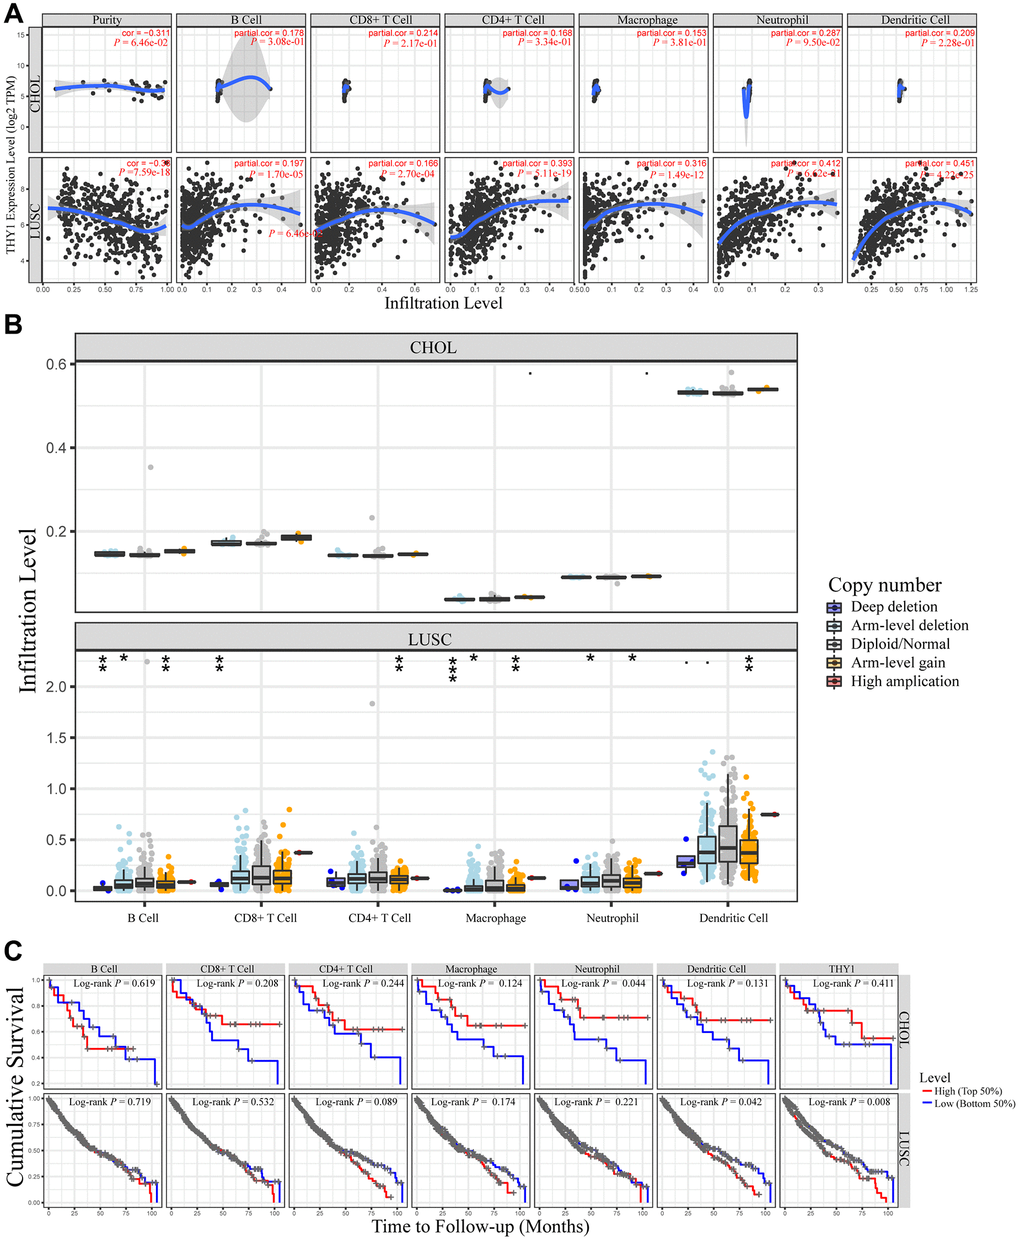
Figure 6. Relationships between THY1 expression and immune infiltration levels in lung squamous cell carcinoma (LUSC) and cholangiocarcinoma (CHOL). (A) Differentially expressed THY1 was significantly correlated with lymphocytes infiltration levels in LUSC, but not in CHOL. (B) Copy number alteration of different immune lymphocytes was significantly correlated with immune infiltration levels in LUSC, but not in CHOL. (C) Higher THY1 expression and dendritic cell infiltration level significantly correlated with poorer prognosis in LUSC.
We then further used the SCNA module of TIMER to explore the tumor infiltration levels under different somatic copy number alterations. As shown in Figure 6B, there were significant correlations between copy number alterations and tumor infiltration levels in LUSC. For example, there were significant correlations between infiltration levels and deep deletion, arm-level deletion, and arm level gain in B cell. However, there were no the same relationships in CHOL.
Meanwhile, the survival module of TIMER was used to measure the relationships between inflammatory infiltration and prognostic value and THY1 expression in LUSC. Although there were significant correlations between THY1 expression and the abundance of many immune lymphocytes, only higher dendritic cell infiltration (Log-rank P = 0.042) and THY1 expression (Log-rank P = 0.008) significantly correlated with shorter cumulative survival in THY1 in LUSC (Figure 6C). In summary, THY1 may play pivotal roles via mediating immune lymphocytes infiltration in LUSC, especially dendritic cell.
THY1 expression is significantly correlated with immune marker expression in LUSC
Next, we explored the relationships between the gene markers of immune lymphocytes and THY1 expression in order to further validate the function of differentially expressed THY1 on immunocytes infiltration levels in LUSC. The CHOL was used as the control, and the tumor purity was used to adjust these results. As shown in Table 1, THY1 was positively correlated with the most of the gene markers, which was consistent with the results of the previous results in LUSC. All these gene markers of dendritic cell (HLA-DPB1, HLA-DQB1, HLA-DRA, HLA-DPA1, BDCA-1, BDCA-4, and CD1c) were significantly correlated with THY1 expression in LUSC (Figure 7A–7G). However, NOS2 (M1 macrophages), IRF5 (M1 macrophages), CD66b (Neutrophils), KIR2DL4 (Natural killer cell), KIR3DL3 (Natural killer cell), STAT6 (TH2), and IL17A (TH17) were not significantly correlated with THY1 expression in LUSC, and BCL6 (Tfh) was negatively correlated with THY1 expression. On the contrary, there were few significant correlations between THY1 expression and lymphocytes gene markers in CHOL. Only NOS2 (M1 macrophages), CD163 (M2 macrophages), MS4A4A (M2 macrophages), CD66b (Neutrophils), TBX21 (Th1), TGFBA (Treg) were positively correlated with THY1 expression. Only CD66b of neutrophil gene markers were positively correlated with THY1 expression in CHOL (cor = 0.352, P < 0.05), which was not completely consistent with the previous prognostic analysis of neutrophil in CHOL. Finally, we further used GEPIA to explore the relationships between THY1 expression and the gene markers of dendritic cell gene in LUSC. As shown in Table 2, THY1 expression was positively correlated with these gene markers in LUSC. In summary, these results strongly proved that THY1 may play a key role in LUSC by regulating the infiltration of immune cells, especially for the infiltration abundance of dendritic cells.
Table 1. Correlation between THY1 and gene markers of immune infiltrates in LUSC and CHOL from TIMER database.
| Description | Gene markers | LUSC | CHOL | ||||||||||||||||||||||||||||||||||||||||||||||||||||||||||||||||||||||||||||||||||||||||||||||||
| None | Purity | None | Purity | ||||||||||||||||||||||||||||||||||||||||||||||||||||||||||||||||||||||||||||||||||||||||||||||||
| Cor | P | Cor | P | Cor | P | Cor | P | ||||||||||||||||||||||||||||||||||||||||||||||||||||||||||||||||||||||||||||||||||||||||||||
| CD8+ T cells | CD8A | 0.271 | **** | 0.17 | *** | 0.204 | 0.231 | 0.077 | 0.661 | ||||||||||||||||||||||||||||||||||||||||||||||||||||||||||||||||||||||||||||||||||||||||||
| CD8B | 0.22 | **** | 0.169 | *** | −0.082 | 0.633 | −0.213 | 0.22 | |||||||||||||||||||||||||||||||||||||||||||||||||||||||||||||||||||||||||||||||||||||||||||
| T cell (general) | CD3D | 0.355 | **** | 0.23 | **** | −0.368 | 0.0278 | 0.255 | 0.14 | ||||||||||||||||||||||||||||||||||||||||||||||||||||||||||||||||||||||||||||||||||||||||||
| CD3E | 0.43 | **** | 0.312 | **** | 0.274 | 0.105 | 0.119 | 0.497 | |||||||||||||||||||||||||||||||||||||||||||||||||||||||||||||||||||||||||||||||||||||||||||
| CD2 | 0.393 | **** | 0.273 | **** | 0.229 | 0.179 | 0.069 | 0.695 | |||||||||||||||||||||||||||||||||||||||||||||||||||||||||||||||||||||||||||||||||||||||||||
| B cell | CD19 | 0.34 | **** | 0.189 | **** | 0.278 | 0.1 | 0.147 | 0.398 | ||||||||||||||||||||||||||||||||||||||||||||||||||||||||||||||||||||||||||||||||||||||||||
| CD79A | 0.425 | **** | 0.295 | **** | 0.285 | 0.0926 | 0.162 | 0.352 | |||||||||||||||||||||||||||||||||||||||||||||||||||||||||||||||||||||||||||||||||||||||||||
| Monocyte | CD86 | 0.472 | **** | 0.36 | **** | 0.233 | 0.171 | 0.083 | 0.634 | ||||||||||||||||||||||||||||||||||||||||||||||||||||||||||||||||||||||||||||||||||||||||||
| CD115 (CSF1R) | 0.575 | **** | 0.488 | **** | 0.116 | 0.5 | −0.012 | 0.945 | |||||||||||||||||||||||||||||||||||||||||||||||||||||||||||||||||||||||||||||||||||||||||||
| TAM | CCL2 | 0.561 | **** | 0.504 | **** | 0.285 | 0.092 | 0.23 | 0.184 | ||||||||||||||||||||||||||||||||||||||||||||||||||||||||||||||||||||||||||||||||||||||||||
| CD68 | 0.409 | **** | 0.3 | **** | 0.09 | 0.6 | 0.003 | 0.989 | |||||||||||||||||||||||||||||||||||||||||||||||||||||||||||||||||||||||||||||||||||||||||||
| IL10 | 0.445 | **** | 0.379 | **** | 0.283 | 0.0941 | 0.104 | 0.551 | |||||||||||||||||||||||||||||||||||||||||||||||||||||||||||||||||||||||||||||||||||||||||||
| M1 macrophage | INOS (NOS2) | −0.016 | 0.723 | −0.006 | 0.899 | 0.335 | * | 0.35 | * | ||||||||||||||||||||||||||||||||||||||||||||||||||||||||||||||||||||||||||||||||||||||||||
| IRF5 | 0.071 | 0.111 | 0.03 | 0.515 | 0.007 | 0.97 | −0.074 | 0.673 | |||||||||||||||||||||||||||||||||||||||||||||||||||||||||||||||||||||||||||||||||||||||||||
| COX2 (PTGS2) | 0.222 | **** | 0.191 | **** | 0.322 | 0.0562 | 0.233 | 0.177 | |||||||||||||||||||||||||||||||||||||||||||||||||||||||||||||||||||||||||||||||||||||||||||
| M2 macrophage | CD163 | 0.461 | **** | 0.373 | **** | 0.43 | * | 0.335 | * | ||||||||||||||||||||||||||||||||||||||||||||||||||||||||||||||||||||||||||||||||||||||||||
| VSIG4 | 0.401 | **** | 0.302 | **** | 0.321 | 0.0566 | 0.215 | 0.215 | |||||||||||||||||||||||||||||||||||||||||||||||||||||||||||||||||||||||||||||||||||||||||||
| MS4A4A | 0.424 | **** | 0.321 | **** | 0.452 | * | 0.348 | * | |||||||||||||||||||||||||||||||||||||||||||||||||||||||||||||||||||||||||||||||||||||||||||
| Neutrophils | CD66b (CEACAM8) | 0.081 | 0.0698 | 0.054 | 0.237 | 0.352 | * | 0.363 | * | ||||||||||||||||||||||||||||||||||||||||||||||||||||||||||||||||||||||||||||||||||||||||||
| CD11b (ITGAM) | 0.523 | **** | 0.434 | **** | 0.165 | 0.335 | 0.095 | 0.587 | |||||||||||||||||||||||||||||||||||||||||||||||||||||||||||||||||||||||||||||||||||||||||||
| CCR7 | 0.385 | **** | 0.26 | **** | 0.212 | 0.213 | 0.043 | 0.808 | |||||||||||||||||||||||||||||||||||||||||||||||||||||||||||||||||||||||||||||||||||||||||||
| Natural killer cell | KIR2DL1 | 0.108 | * | 0.052 | 0.259 | −0.001 | 0.995 | −0.05 | 0.777 | ||||||||||||||||||||||||||||||||||||||||||||||||||||||||||||||||||||||||||||||||||||||||||
| KIR2DL3 | 0.091 | * | 0.031 | 0.495 | −0.042 | 0.81 | −0.083 | 0.636 | |||||||||||||||||||||||||||||||||||||||||||||||||||||||||||||||||||||||||||||||||||||||||||
| KIR2DL4 | 0.045 | 0.32 | -0.042 | 0.363 | −0.117 | 0.497 | −0.202 | 0.245 | |||||||||||||||||||||||||||||||||||||||||||||||||||||||||||||||||||||||||||||||||||||||||||
| KIR3DL1 | 0.182 | **** | 0.108 | * | 0.018 | 0.918 | −0.029 | 0.869 | |||||||||||||||||||||||||||||||||||||||||||||||||||||||||||||||||||||||||||||||||||||||||||
| KIR3DL2 | 0.117 | * | 0.029 | 0.531 | −0.113 | 0.512 | −0.128 | 0.462 | |||||||||||||||||||||||||||||||||||||||||||||||||||||||||||||||||||||||||||||||||||||||||||
| KIR3DL3 | 0.029 | 0.518 | -0.049 | 0.29 | −0.083 | 0.632 | −0.133 | 0.446 | |||||||||||||||||||||||||||||||||||||||||||||||||||||||||||||||||||||||||||||||||||||||||||
| KIR2DS4 | 0.126 | ** | 0.071 | 0.121 | −0.034 | 0.384 | 0.015 | 0.932 | |||||||||||||||||||||||||||||||||||||||||||||||||||||||||||||||||||||||||||||||||||||||||||
| Dendritic cell | HLA-DPB1 | 0.461 | **** | 0.349 | **** | 0.197 | 0.249 | 0.066 | 0.706 | ||||||||||||||||||||||||||||||||||||||||||||||||||||||||||||||||||||||||||||||||||||||||||
| HLA-DQB1 | 0.385 | **** | 0.295 | **** | 0.06 | 0.725 | −0.032 | 0.854 | |||||||||||||||||||||||||||||||||||||||||||||||||||||||||||||||||||||||||||||||||||||||||||
| HLA-DRA | 0.421 | **** | 0.31 | **** | 0.119 | 0.487 | −0.04 | 0.82 | |||||||||||||||||||||||||||||||||||||||||||||||||||||||||||||||||||||||||||||||||||||||||||
| HLA-DPA1 | 0.436 | **** | 0.329 | **** | 0.134 | 0.433 | −0.019 | 0.913 | |||||||||||||||||||||||||||||||||||||||||||||||||||||||||||||||||||||||||||||||||||||||||||
| BDCA-1 (CD1C) | 0.266 | **** | 0.082 | 0.074 | 0.195 | 0.255 | 0.065 | 0.712 | |||||||||||||||||||||||||||||||||||||||||||||||||||||||||||||||||||||||||||||||||||||||||||
| BDCA-4 (NRP1) | 0.535 | **** | 0.466 | **** | 0.314 | 0.0628 | 0.235 | 0.174 | |||||||||||||||||||||||||||||||||||||||||||||||||||||||||||||||||||||||||||||||||||||||||||
| CD11c (ITGAX) | 0.484 | **** | 0.357 | **** | 0.168 | 0.327 | 0.012 | 0.947 | |||||||||||||||||||||||||||||||||||||||||||||||||||||||||||||||||||||||||||||||||||||||||||
| Th1 | T-bet (TBX21) | 0.327 | **** | 0.21 | **** | 0.338 | * | 0.199 | 0.251 | ||||||||||||||||||||||||||||||||||||||||||||||||||||||||||||||||||||||||||||||||||||||||||
| STAT4 | 0.429 | **** | 0.32 | **** | 0.208 | 0.223 | 0.125 | 0.476 | |||||||||||||||||||||||||||||||||||||||||||||||||||||||||||||||||||||||||||||||||||||||||||
| STAT1 | 0.189 | **** | 0.125 | ** | 0.118 | 0.493 | 0.069 | 0.693 | |||||||||||||||||||||||||||||||||||||||||||||||||||||||||||||||||||||||||||||||||||||||||||
| IFN-y (IFNG) | 0.113 | * | 0.038 | 0.408 | 0.12 | 0.485 | −0.031 | 0.861 | |||||||||||||||||||||||||||||||||||||||||||||||||||||||||||||||||||||||||||||||||||||||||||
| TNF-a (TNF) | 0.383 | **** | 0.296 | **** | 0.205 | 0.229 | 0.161 | 0.356 | |||||||||||||||||||||||||||||||||||||||||||||||||||||||||||||||||||||||||||||||||||||||||||
| TH2 | GATA3 | 0.399 | **** | 0.339 | **** | 0.313 | 0.0633 | 0.177 | 0.309 | ||||||||||||||||||||||||||||||||||||||||||||||||||||||||||||||||||||||||||||||||||||||||||
| STAT6 | 0.024 | 0.588 | 0.024 | 0.603 | 0.224 | 0.189 | 0.247 | 0.152 | |||||||||||||||||||||||||||||||||||||||||||||||||||||||||||||||||||||||||||||||||||||||||||
| STAT5A | 0.411 | **** | 0.317 | **** | 0.232 | 0.173 | 0.185 | 0.288 | |||||||||||||||||||||||||||||||||||||||||||||||||||||||||||||||||||||||||||||||||||||||||||
| IL13 | 0.089 | * | 0.026 | 0.57 | −0.026 | 0.878 | −0.113 | 0.519 | |||||||||||||||||||||||||||||||||||||||||||||||||||||||||||||||||||||||||||||||||||||||||||
| Tfh | BCL6 | −0.142 | ** | −0.114 | * | 0.266 | 0.116 | 0.254 | 0.141 | ||||||||||||||||||||||||||||||||||||||||||||||||||||||||||||||||||||||||||||||||||||||||||
| IL21 | 0.124 | ** | 0.045 | 0.327 | 0.099 | 0.567 | 0.013 | 0.94 | |||||||||||||||||||||||||||||||||||||||||||||||||||||||||||||||||||||||||||||||||||||||||||
| Th17 | STAT3 | 0.261 | **** | 0.254 | **** | 0.153 | 0.371 | 0.158 | 0.366 | ||||||||||||||||||||||||||||||||||||||||||||||||||||||||||||||||||||||||||||||||||||||||||
| IL17A | 0.017 | 0.699 | -0.048 | 0.295 | 0.106 | 0.539 | 0.033 | 0.849 | |||||||||||||||||||||||||||||||||||||||||||||||||||||||||||||||||||||||||||||||||||||||||||
| Treg | FOXP3 | 0.52 | **** | 0.602 | **** | 0.224 | 0.188 | 0.075 | 0.667 | ||||||||||||||||||||||||||||||||||||||||||||||||||||||||||||||||||||||||||||||||||||||||||
| CCR8 | 0.553 | **** | 0.466 | **** | 0.151 | 0.38 | 0.028 | 0.873 | |||||||||||||||||||||||||||||||||||||||||||||||||||||||||||||||||||||||||||||||||||||||||||
| STAT5B | 0.153 | *** | 0.164 | *** | 0.247 | 0.147 | 0.225 | 0.193 | |||||||||||||||||||||||||||||||||||||||||||||||||||||||||||||||||||||||||||||||||||||||||||
| TGFB (TGFB1) | 0.451 | **** | 0.389 | **** | 0.501 | ** | 0.451 | * | |||||||||||||||||||||||||||||||||||||||||||||||||||||||||||||||||||||||||||||||||||||||||||
| T-cell exhaustion | PD-1 (PDCD1) | 0.33 | **** | 0.216 | **** | 0.232 | 0.173 | 0.16 | 0.358 | ||||||||||||||||||||||||||||||||||||||||||||||||||||||||||||||||||||||||||||||||||||||||||
| CTLA4 | 0.442 | **** | 0.326 | **** | 0.092 | 0.594 | −0.012 | 0.945 | |||||||||||||||||||||||||||||||||||||||||||||||||||||||||||||||||||||||||||||||||||||||||||
| LAG3 | 0.264 | **** | 0.179 | **** | 0.087 | 0.613 | −0.033 | 0.85 | |||||||||||||||||||||||||||||||||||||||||||||||||||||||||||||||||||||||||||||||||||||||||||
| TIM-3 (HAVCR2) | 0.454 | **** | 0.347 | **** | 0.197 | 0.249 | 0.061 | 0.728 | |||||||||||||||||||||||||||||||||||||||||||||||||||||||||||||||||||||||||||||||||||||||||||
| GZMB | 0.236 | **** | 0.113 | * | 0.143 | 0.404 | 0.006 | 0.971 | |||||||||||||||||||||||||||||||||||||||||||||||||||||||||||||||||||||||||||||||||||||||||||
| Abbreviations: LUSC: Lung Squamous Cell carcinoma; CHOL: Cholangiocarcinoma; TAM: Tumor-associated Macrophage. *P < 0.05; **P < 0.01; ***P < 0.001; ****P < 0.0001. | |||||||||||||||||||||||||||||||||||||||||||||||||||||||||||||||||||||||||||||||||||||||||||||||||||
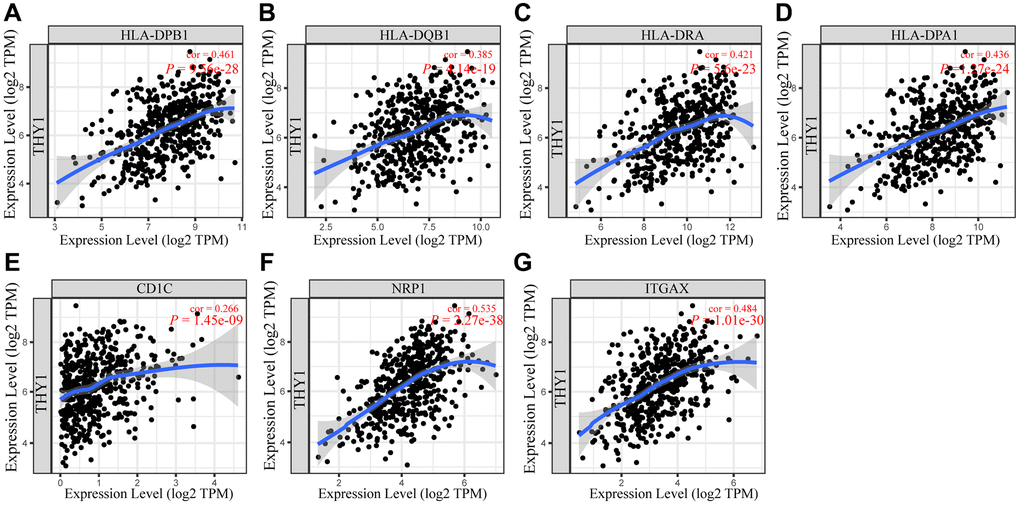
Figure 7. Associations between THY1 expression and gene markers of dendritic cells. (A–G) The relationships between THY1 expression and HLA-DPB1, HLA-DQB1, HLA-DRA, HLA-DPA1, CD1C, NRP1, and ITGAX in LUSC from TIMER database.
Table 2. Correlation between THY1 expression and gene markers of dendritic cell in LUSC.
| Cancer type | Description | Gene markers | Tumor | Normal | |||||||||||||||||||||||||||||||||||||||||||||||||||||||||||||||||||||||||||||||||||||||||||||||
| R | P | R | P | ||||||||||||||||||||||||||||||||||||||||||||||||||||||||||||||||||||||||||||||||||||||||||||||||
| LUSC | Dendritic cell | HLA-DPB1 | 0.35 | **** | 0.12 | 0.42 | |||||||||||||||||||||||||||||||||||||||||||||||||||||||||||||||||||||||||||||||||||||||||||||
| HLA-DQB1 | 0.23 | **** | 0.084 | 0.56 | |||||||||||||||||||||||||||||||||||||||||||||||||||||||||||||||||||||||||||||||||||||||||||||||
| HLA-DRA | 0.34 | **** | −0.059 | 0.69 | |||||||||||||||||||||||||||||||||||||||||||||||||||||||||||||||||||||||||||||||||||||||||||||||
| HLA-DPA1 | 0.37 | 0 | 0.074 | 0.61 | |||||||||||||||||||||||||||||||||||||||||||||||||||||||||||||||||||||||||||||||||||||||||||||||
| BDCA-1 (CD1C) | 0.2 | **** | 0.1 | 0.48 | |||||||||||||||||||||||||||||||||||||||||||||||||||||||||||||||||||||||||||||||||||||||||||||||
| BDCA-4 (NRP1) | 0.45 | 0 | 0.48 | *** | |||||||||||||||||||||||||||||||||||||||||||||||||||||||||||||||||||||||||||||||||||||||||||||||
| CD11c (ITGAX) | 0.27 | **** | 0.27 | 0.057 | |||||||||||||||||||||||||||||||||||||||||||||||||||||||||||||||||||||||||||||||||||||||||||||||
| Abbreviation: LUSC: Lung Squamous Cell Carcinoma; ****P < 0.0001. | |||||||||||||||||||||||||||||||||||||||||||||||||||||||||||||||||||||||||||||||||||||||||||||||||||
Discussion
Nowadays, LUCA is still a leading cause of death not only in developing countries but also in developed countries. Approximately 70% of patients were advanced stage or have distant metastases at the time of diagnosis for the atypical early symptoms and lack of specific early screening biomarkers [18]. A variety of cytotoxic drugs (e.g., platinum, taxane), targeted drugs (e.g., gefitinib, erlotinib) and immune checkpoint inhibitors (e.g., PD1/PDL-1 inhibitors) have been used in the treatment of non-small cell lung cancer, and have achieved certain some curative effect [18–22]. However, the overall prognosis of LUCA was un-satisfactory for the inherent or acquired drug resistance. Therefore, it is important to put great efforts to identify more specific biomarkers of LUCA.
Recent years, molecular biology technology and bioinformatics have been widely developed, which provide a new insight to explore the functional mechanism and identify novel biomarkers for human cancers. In our study, we mainly used some online public databases (e.g., ONCOMINE, GEPIA, UALCAN, TIMER) to comprehensively explore the expression level and prognostic significance of THY1 in LUSC. In summary, we confirmed that THY1 was significantly up-regulated at the level of mRNA in LUSC. Furthermore, over-expression of THY1 was significantly correlated with poor survival in (e.g., OS, DFS) in LUSC. Further analysis revealed that CpG islands methylation of THY1 was negatively correlated with THY1 mRNA expression in LUSC. We also attempted to explore the molecular mechanism of THY1 in LUSC. Functional enrichment analysis of correlated genes of THY1 revealed that it may get involved in the process of ECM organization and EMT, which were reported to play pivotal roles in the occurrence and development of human diseases [23–26]. Studies have proved that the increased expression of key molecules of EMT signaling pathway (e.g., TWIST1, MMPs) was often accompanied by the increase of immune cell infiltration abundance in tumor microenvironment in breast cancer, which contributed to the immune escape of tumor cells [27]. Furthermore, many studies have confirmed that in a variety of cancers, the process of EMT was often accompanied by desensitization of immunotherapy drugs [28–30]. Our study indicated that differentially expressed THY1 not only got involved in the process of EMT, but also significantly correlated with the immune infiltration levels in LUSC. It provides us with a new therapeutic strategy for LUSC by blocking THY1 to remolding ECM and tumor microenvironment.
The development of immunotherapy has brought hope for the treatment of lung cancer, especially for advanced or recurrent patients [31, 32]. However, only a small portion of patients can benefit from immunotherapy. The commonly used biomarkers for efficacy prediction in lung cancer include the expression of PD-L1, tumor mutational burden, specific genomic alterations, and circulating tumor DNA [31, 33]. These biomarkers can help predict the response to immune checkpoint inhibitors and other cancer therapies, and may also be used to guide treatment decisions. Therefore, it is crucial to identify more biomarkers that can predict or improve the effectiveness of immunotherapy. In our study, we found that THY1 was positively correlated with the infiltration levels of certain immunocytes (e.g., B cell, CD8+ T cell, CD4+ T cell, macrophage, neutrophil and dendritic) in LUSC, which indicates that THY1 may play pivotal roles in immune microenvironment remodeling. Developing effective inhibitors targeting THY1 may be beneficial for improving immunotherapy and is worth exploring in the future.
It is no doubt that there are some limitations in our study. Firstly, our results were mainly derived from public databases, which need to be further verified in near future. Cell or animal models of LUSC overexpressing THY1 would be helpful to further confirm our results. Secondly, we can use the DNA methylation agonists to further verify the relationships between THY1 CpG islands methylation and mRNA expression. Finally, the mechanism of differentially expressed THY1, EMT, and immune infiltration require further experiments to verify in future.
Materials and Methods
GEPIA analysis
GEPIA (http://gepia.cancer-pku.cn/) contains the TCGA samples, which can provide key interactive information and customized functions, including tumor/normal differential expression profile analysis, profile drawing, pathological staging, patient survival analysis, similar gene detection analysis, etc. In this study, we used the GEPIA to explore the THY1 expression landscape in human cancers and normal organs [34]. We also used it to explore the prognostic values of THY1 on 33 types of cancer in TCGA. Finally, we used it to further validate the relationships between THY1 expression and gene markers.
TIMER analysis
TIMER (https://cistrome.shinyapps.io/timer/) is an online database, which mainly uses RNA SEQ expression profile data to detect the infiltration of immune cells in tumor tissues. It provides the infiltration of six types of immune cells (B cells, CD4+ T cells, CD8+ T cells, neutrophils, macrophages, and dendritic cells) [35]. Here, we firstly used it to measure the THY1 expression levels in 33 types of cancer from TCGA. We then used it and explored the relationships between THY1 expression and immune lymphocytes infiltration levels. The prognostic values of THY1 expression and immune lymphocytes, and the relationships between THY1 expression and immune lymphocytes gene markers were also measured by TIMER.
ONCOMINE analysis
ONCOMINE (http://www.oncomine.org/resource/login.html) database integrates RNA and DNA-seq data from sources such as GEO, TCGA, and published literature, and contains a wealth of oncogene chips and integrated data to facilitate relevant analysis by researchers [36, 37]. Here, we mainly used it to explore the expression level of THY1 in many types of cancers.
PrognoScan analysis
PrognoScan (http://dna00.bio.kyutech.ac.jp/PrognoScan/) integrates large number of microarray data sets with prognostic information. The site basically includes most of the tumor data, which can be used to analyze the relationship between gene expression and patient prognosis, such as OS and DFS [38]. Here, we also used it to measure the prognostic values of differentially expressed THY1 in many malignant tumors.
UALCAN analysis
UALCAN (https://ualcan.path.uab.edu/analysis.html) is a website for online analysis and mining of cancer data from the TCGA database. It helps preliminary research on whether relevant genes can be used as biomarkers, expression profiling, survival analysis, etc., [39]. In our study, the UACLAN was mainly used to further explore the relationships between the expression of THY1 and clinicopathological parameters (individual cancer stage, age, smoking habits, nodal metastasis status, and TP53 mutation status) in LUSC.
Kapan-Meier plotter analysis
Kaplan-Meier plotter (https://kmplot.com/analysis/) is an online database which can measure the prognostic significance of interesting genes on 21 types of human cancer at the level of mRNA, miRNA, and protein [40]. In this study, we mainly used it to assess the prognostic values of THY1 expression under restricted clinicopathological parameters in LUSC.
MEXPRESS analysis
MEXPRESS (https://mexpress.ugent.be/) is an online database containing 33 kinds of cancer multi omics data from TCGA. Users can easily view the relationships between the interested genes expression, DNA methylation and clinical characteristics [41]. Here, we used it to explore the relationships of different CpG islands methylation and THY1 expression in LUSC.
TCGA wander analysis
TCGA Wander (http://maplab.imppc.org/wanderer/) is an online database based on TCGA data, and users can use it to intuitively explore the relationship between DNA methylation and gene expression [42]. We used it to explore the mean THY1 methylation and THY1 mRNA expression of LUSC and normal lung tissues.
Gene set cancer analysis (GSCA) analysis
GSCA (https://guolab.wchscu.cn/GSCA/#/) is an online database that contains TCGA data and can perform integrated genomic and immunogenomic analysis. It is a multifunctional database composed of 4 modules: differential expression analysis, immune infiltration analysis, gene mutation analysis and drug screening. Here, we used it to explore the relationships between THY1 methylation level and mRNA expression in LUSC from TCGA [43].
LinkedOmics analysis
LinkedOmics (https://linkedomics.org/login.php) is a friendly and easy-to-operate online database which contains 32 types of human cancer multi-omics data from the TCGA database and a database of mass spectrometry-based proteomics data generated by the Clinical Proteomics Tumor Analysis Association (CPTAC) [44]. Here, we used the LinkedOmics to identify positively and negatively correlated genes of THY1 in LUSC.
STRING analysis
SRTING (https://cn.string-db.org/) is an online database for searching known protein interaction relationships. It stores 2031 species, 9,643,763 proteins, and 1,380,838,440 interaction information [45]. We mainly used it to construct the PPI of correlated genes of THY1 identified by LinkedOmics.
FunRich3.1.3 analysis
FunRich is an independent software tool, mainly used for gene and protein function enrichment and interaction network analysis. In addition, the analysis results can be graphically described in the form of Venn, bar, column, pie, and donut charts [46]. In this study, we mainly performed enrichment analysis of THY1 correlated genes to identify potential functional mechanism.
Availability of data and materials
The data used in our study are available from the ONCOMINE (http://www.oncomine.org/), UALCAN (https://ualcan.path.uab.edu/analysis.html), LinkedOmics (http://www.linkedomics.org/login.php), Gene Expression Profiling Interactive Analysis (http://gepia.cancer-pku.cn/detail.php), Kaplan-Meier plotter (http://www.kmplot.com), TIMER (http://cistrome.shinyapps.io/timer/), STRING (http://string-db.org), PrognoScan (http://dna00.bio.kyutech.ac.jp/PrognoScan/), GSCA (http://bioinfo.life.hust.edu.cn/GSCA/#/), TCGA Wander (http://maplab.imppc.org/wanderer/doc.html), MEXPRESS (https://mexpress.be/).
Author Contributions
Fang Ren and Limin Gao were responsible for the study concept and design; Changsheng Yi and Nan Zang were involved in data collection, data screening, statistical analysis and wrote the manuscript. The final manuscript was approved by all the authors above.
Conflicts of Interest
The authors declare no conflicts of interest related to this study.
Funding
No funding was used for this paper.
References
- 1. Reck M, Rabe KF. Precision Diagnosis and Treatment for Advanced Non-Small-Cell Lung Cancer. N Engl J Med. 2017; 377:849–61. https://doi.org/10.1056/NEJMra1703413 [PubMed]
- 2. Ettinger DS, Akerley W, Borghaei H, Chang AC, Cheney RT, Chirieac LR, D'Amico TA, Demmy TL, Govindan R, Grannis FW
Jr , Grant SC, Horn L, Jahan TM, et al, and National comprehensive cancer network. Non-small cell lung cancer, version 2.2013. J Natl Compr Canc Netw. 2013; 11:645–53. https://doi.org/10.6004/jnccn.2013.0084 [PubMed] - 3. Hirsch FR, Scagliotti GV, Mulshine JL, Kwon R, Curran WJ
Jr , Wu YL, Paz-Ares L. Lung cancer: current therapies and new targeted treatments. Lancet. 2017; 389:299–311. https://doi.org/10.1016/S0140-6736(16)30958-8 [PubMed] - 4. Kulasingam V, Diamandis EP. Strategies for discovering novel cancer biomarkers through utilization of emerging technologies. Nat Clin Pract Oncol. 2008; 5:588–99. https://doi.org/10.1038/ncponc1187 [PubMed]
- 5. Lung HL, Cheung AK, Cheng Y, Kwong FM, Lo PH, Law EW, Chua D, Zabarovsky ER, Wang N, Tsao SW, Stanbridge EJ, Lung ML. Functional characterization of THY1 as a tumor suppressor gene with antiinvasive activity in nasopharyngeal carcinoma. Int J Cancer. 2010; 127:304–12. https://doi.org/10.1002/ijc.25047 [PubMed]
- 6. Barda-Saad M, Rozenszajn LA, Ashush H, Shav-Tal Y, Ben Nun A, Zipori D. Adhesion molecules involved in the interactions between early T cells and mesenchymal bone marrow stromal cells. Exp Hematol. 1999; 27:834–44. https://doi.org/10.1016/s0301-472x(99)00010-7 [PubMed]
- 7. Rege TA, Hagood JS. Thy-1 as a regulator of cell-cell and cell-matrix interactions in axon regeneration, apoptosis, adhesion, migration, cancer, and fibrosis. FASEB J. 2006; 20:1045–54. https://doi.org/10.1096/fj.05-5460rev [PubMed]
- 8. Sukowati CH, Anfuso B, Torre G, Francalanci P, Crocè LS, Tiribelli C. The expression of CD90/Thy-1 in hepatocellular carcinoma: an in vivo and in vitro study. PLoS One. 2013; 8:e76830. https://doi.org/10.1371/journal.pone.0076830 [PubMed]
- 9. True LD, Zhang H, Ye M, Huang CY, Nelson PS, von Haller PD, Tjoelker LW, Kim JS, Qian WJ, Smith RD, Ellis WJ, Liebeskind ES, Liu AY. CD90/THY1 is overexpressed in prostate cancer-associated fibroblasts and could serve as a cancer biomarker. Mod Pathol. 2010; 23:1346–56. https://doi.org/10.1038/modpathol.2010.122 [PubMed]
- 10. Abeysinghe HR, Cao Q, Xu J, Pollock S, Veyberman Y, Guckert NL, Keng P, Wang N. THY1 expression is associated with tumor suppression of human ovarian cancer. Cancer Genet Cytogenet. 2003; 143:125–32. https://doi.org/10.1016/s0165-4608(02)00855-5 [PubMed]
- 11. Abeysinghe HR, Pollock SJ, Guckert NL, Veyberman Y, Keng P, Halterman M, Federoff HJ, Rosenblatt JP, Wang N. The role of the THY1 gene in human ovarian cancer suppression based on transfection studies. Cancer Genet Cytogenet. 2004; 149:1–10. https://doi.org/10.1016/S0165-4608(03)00234-6 [PubMed]
- 12. Klutstein M, Nejman D, Greenfield R, Cedar H. DNA Methylation in Cancer and Aging. Cancer Res. 2016; 76:3446–50. https://doi.org/10.1158/0008-5472.CAN-15-3278 [PubMed]
- 13. De Palma M, Lewis CE. Macrophage regulation of tumor responses to anticancer therapies. Cancer Cell. 2013; 23:277–86. https://doi.org/10.1016/j.ccr.2013.02.013 [PubMed]
- 14. Hanahan D, Coussens LM. Accessories to the crime: functions of cells recruited to the tumor microenvironment. Cancer Cell. 2012; 21:309–22. https://doi.org/10.1016/j.ccr.2012.02.022 [PubMed]
- 15. Molina JR, Yang P, Cassivi SD, Schild SE, Adjei AA. Non-small cell lung cancer: epidemiology, risk factors, treatment, and survivorship. Mayo Clin Proc. 2008; 83:584–94. https://doi.org/10.4065/83.5.584 [PubMed]
- 16. Arriagada R, Bergman B, Dunant A, Le Chevalier T, Pignon JP, Vansteenkiste J, and International Adjuvant Lung Cancer Trial Collaborative Group. Cisplatin-based adjuvant chemotherapy in patients with completely resected non-small-cell lung cancer. N Engl J Med. 2004; 350:351–60. https://doi.org/10.1056/NEJMoa031644 [PubMed]
- 17. Maemondo M, Inoue A, Kobayashi K, Sugawara S, Oizumi S, Isobe H, Gemma A, Harada M, Yoshizawa H, Kinoshita I, Fujita Y, Okinaga S, Hirano H, et al, and North-East Japan Study Group. Gefitinib or chemotherapy for non-small-cell lung cancer with mutated EGFR. N Engl J Med. 2010; 362:2380–8. https://doi.org/10.1056/NEJMoa0909530 [PubMed]
- 18. Soria JC, Ohe Y, Vansteenkiste J, Reungwetwattana T, Chewaskulyong B, Lee KH, Dechaphunkul A, Imamura F, Nogami N, Kurata T, Okamoto I, Zhou C, Cho BC, et al, and FLAURA Investigators. Osimertinib in Untreated EGFR-Mutated Advanced Non-Small-Cell Lung Cancer. N Engl J Med. 2018; 378:113–25. https://doi.org/10.1056/NEJMoa1713137 [PubMed]
- 19. Rittmeyer A, Barlesi F, Waterkamp D, Park K, Ciardiello F, von Pawel J, Gadgeel SM, Hida T, Kowalski DM, Dols MC, Cortinovis DL, Leach J, Polikoff J, et al, and OAK Study Group. Atezolizumab versus docetaxel in patients with previously treated non-small-cell lung cancer (OAK): a phase 3, open-label, multicentre randomised controlled trial. Lancet. 2017; 389:255–65. https://doi.org/10.1016/S0140-6736(16)32517-X [PubMed]
- 20. Pickup MW, Mouw JK, Weaver VM. The extracellular matrix modulates the hallmarks of cancer. EMBO Rep. 2014; 15:1243–53. https://doi.org/10.15252/embr.201439246 [PubMed]
- 21. Hou W, Liu PX, Zheng M. Modeling of connective tissue damage for blunt dissection of brain tumor in neurosurgery simulation. Comput Biol Med. 2020; 120:103696. https://doi.org/10.1016/j.compbiomed.2020.103696 [PubMed]
- 22. Vasiliev JM. Reorganization of molecular morphology of epitheliocytes and connective-tissue cells in morphogenesis and carcinogenesis. Biochemistry (Mosc). 2008; 73:528–31. https://doi.org/10.1134/s0006297908050052 [PubMed]
- 23. Paszek MJ, Weaver VM. The tension mounts: mechanics meets morphogenesis and malignancy. J Mammary Gland Biol Neoplasia. 2004; 9:325–42. https://doi.org/10.1007/s10911-004-1404-x [PubMed]
- 24. Singh S, Chakrabarti R. Consequences of EMT-Driven Changes in the Immune Microenvironment of Breast Cancer and Therapeutic Response of Cancer Cells. J Clin Med. 2019; 8:642. https://doi.org/10.3390/jcm8050642 [PubMed]
- 25. Swartz MA, Iida N, Roberts EW, Sangaletti S, Wong MH, Yull FE, Coussens LM, DeClerck YA. Tumor microenvironment complexity: emerging roles in cancer therapy. Cancer Res. 2012; 72:2473–80. https://doi.org/10.1158/0008-5472.CAN-12-0122 [PubMed]
- 26. Taube JM, Klein A, Brahmer JR, Xu H, Pan X, Kim JH, Chen L, Pardoll DM, Topalian SL, Anders RA. Association of PD-1, PD-1 ligands, and other features of the tumor immune microenvironment with response to anti-PD-1 therapy. Clin Cancer Res. 2014; 20:5064–74. https://doi.org/10.1158/1078-0432.CCR-13-3271 [PubMed]
- 27. Quail DF, Joyce JA. Microenvironmental regulation of tumor progression and metastasis. Nat Med. 2013; 19:1423–37. https://doi.org/10.1038/nm.3394 [PubMed]
- 28. Lahiri A, Maji A, Potdar PD, Singh N, Parikh P, Bisht B, Mukherjee A, Paul MK. Lung cancer immunotherapy: progress, pitfalls, and promises. Mol Cancer. 2023; 22:40. https://doi.org/10.1186/s12943-023-01740-y [PubMed]
- 29. Li Y, Yan B, He S. Advances and challenges in the treatment of lung cancer. Biomed Pharmacother. 2023; 169:115891. https://doi.org/10.1016/j.biopha.2023.115891 [PubMed]
- 30. Mamdani H, Matosevic S, Khalid AB, Durm G, Jalal SI. Immunotherapy in Lung Cancer: Current Landscape and Future Directions. Front Immunol. 2022; 13:823618. https://doi.org/10.3389/fimmu.2022.823618 [PubMed]
- 31. Siegel RL, Miller KD, Jemal A. Cancer statistics, 2019. CA Cancer J Clin. 2019; 69:7–34. https://doi.org/10.3322/caac.21551 [PubMed]
- 32. Tan WL, Jain A, Takano A, Newell EW, Iyer NG, Lim WT, Tan EH, Zhai W, Hillmer AM, Tam WL, Tan DSW. Novel therapeutic targets on the horizon for lung cancer. Lancet Oncol. 2016; 17:e347–62. https://doi.org/10.1016/S1470-2045(16)30123-1 [PubMed]
- 33. Siegel RL, Miller KD, Jemal A. Cancer statistics, 2020. CA Cancer J Clin. 2020; 70:7–30. https://doi.org/10.3322/caac.21590 [PubMed]
- 34. Tang Z, Li C, Kang B, Gao G, Li C, Zhang Z. GEPIA: a web server for cancer and normal gene expression profiling and interactive analyses. Nucleic Acids Res. 2017; 45:W98–102. https://doi.org/10.1093/nar/gkx247 [PubMed]
- 35. Li T, Fan J, Wang B, Traugh N, Chen Q, Liu JS, Li B, Liu XS. TIMER: A Web Server for Comprehensive Analysis of Tumor-Infiltrating Immune Cells. Cancer Res. 2017; 77:e108–10. https://doi.org/10.1158/0008-5472.CAN-17-0307 [PubMed]
- 36. Rhodes DR, Kalyana-Sundaram S, Mahavisno V, Varambally R, Yu J, Briggs BB, Barrette TR, Anstet MJ, Kincead-Beal C, Kulkarni P, Varambally S, Ghosh D, Chinnaiyan AM. Oncomine 3.0: genes, pathways, and networks in a collection of 18,000 cancer gene expression profiles. Neoplasia. 2007; 9:166–80. https://doi.org/10.1593/neo.07112 [PubMed]
- 37. Rhodes DR, Yu J, Shanker K, Deshpande N, Varambally R, Ghosh D, Barrette T, Pandey A, Chinnaiyan AM. ONCOMINE: a cancer microarray database and integrated data-mining platform. Neoplasia. 2004; 6:1–6. https://doi.org/10.1016/s1476-5586(04)80047-2 [PubMed]
- 38. Mizuno H, Kitada K, Nakai K, Sarai A. PrognoScan: a new database for meta-analysis of the prognostic value of genes. BMC Med Genomics. 2009; 2:18. https://doi.org/10.1186/1755-8794-2-18 [PubMed]
- 39. Chandrashekar DS, Bashel B, Balasubramanya SAH, Creighton CJ, Ponce-Rodriguez I, Chakravarthi BVS, Varambally S. UALCAN: A Portal for Facilitating Tumor Subgroup Gene Expression and Survival Analyses. Neoplasia. 2017; 19:649–58. https://doi.org/10.1016/j.neo.2017.05.002 [PubMed]
- 40. Győrffy B, Surowiak P, Budczies J, Lánczky A. Online survival analysis software to assess the prognostic value of biomarkers using transcriptomic data in non-small-cell lung cancer. PLoS One. 2013; 8:e82241. https://doi.org/10.1371/journal.pone.0082241 [PubMed]
- 41. Koch A, Jeschke J, Van Criekinge W, van Engeland M, De Meyer T. MEXPRESS update 2019. Nucleic Acids Res. 2019; 47:W561–5. https://doi.org/10.1093/nar/gkz445 [PubMed]
- 42. Díez-Villanueva A, Mallona I, Peinado MA. Wanderer, an interactive viewer to explore DNA methylation and gene expression data in human cancer. Epigenetics Chromatin. 2015; 8:22. https://doi.org/10.1186/s13072-015-0014-8 [PubMed]
- 43. Liu CJ, Hu FF, Xia MX, Han L, Zhang Q, Guo AY. GSCALite: a web server for gene set cancer analysis. Bioinformatics. 2018; 34:3771–2. https://doi.org/10.1093/bioinformatics/bty411 [PubMed]
- 44. Vasaikar SV, Straub P, Wang J, Zhang B. LinkedOmics: analyzing multi-omics data within and across 32 cancer types. Nucleic Acids Res. 2018; 46:D956–63. https://doi.org/10.1093/nar/gkx1090 [PubMed]
- 45. Szklarczyk D, Morris JH, Cook H, Kuhn M, Wyder S, Simonovic M, Santos A, Doncheva NT, Roth A, Bork P, Jensen LJ, von Mering C. The STRING database in 2017: quality-controlled protein-protein association networks, made broadly accessible. Nucleic Acids Res. 2017; 45:D362–8. https://doi.org/10.1093/nar/gkw937 [PubMed]
- 46. Pathan M, Keerthikumar S, Ang CS, Gangoda L, Quek CY, Williamson NA, Mouradov D, Sieber OM, Simpson RJ, Salim A, Bacic A, Hill AF, Stroud DA, et al. FunRich: An open access standalone functional enrichment and interaction network analysis tool. Proteomics. 2015; 15:2597–601. https://doi.org/10.1002/pmic.201400515 [PubMed]