


This article has been corrected: The authors noticed an error in Figure 2. As a result of its misplacement, the graph in panel 2A, which should show the gene expression data for 14-3-3 zeta, was the same as the graph in panel 2A, which shows the gene expression data for 14-3-3 theta. The authors corrected panel 2A for 14-3-3 zeta in Figure 2 by using the correct graph from the original sets of experiments. The authors stated that this alteration does not affect the results or conclusions of this work and apologized for any inconvenience caused.
New Figure 2 is presented below.
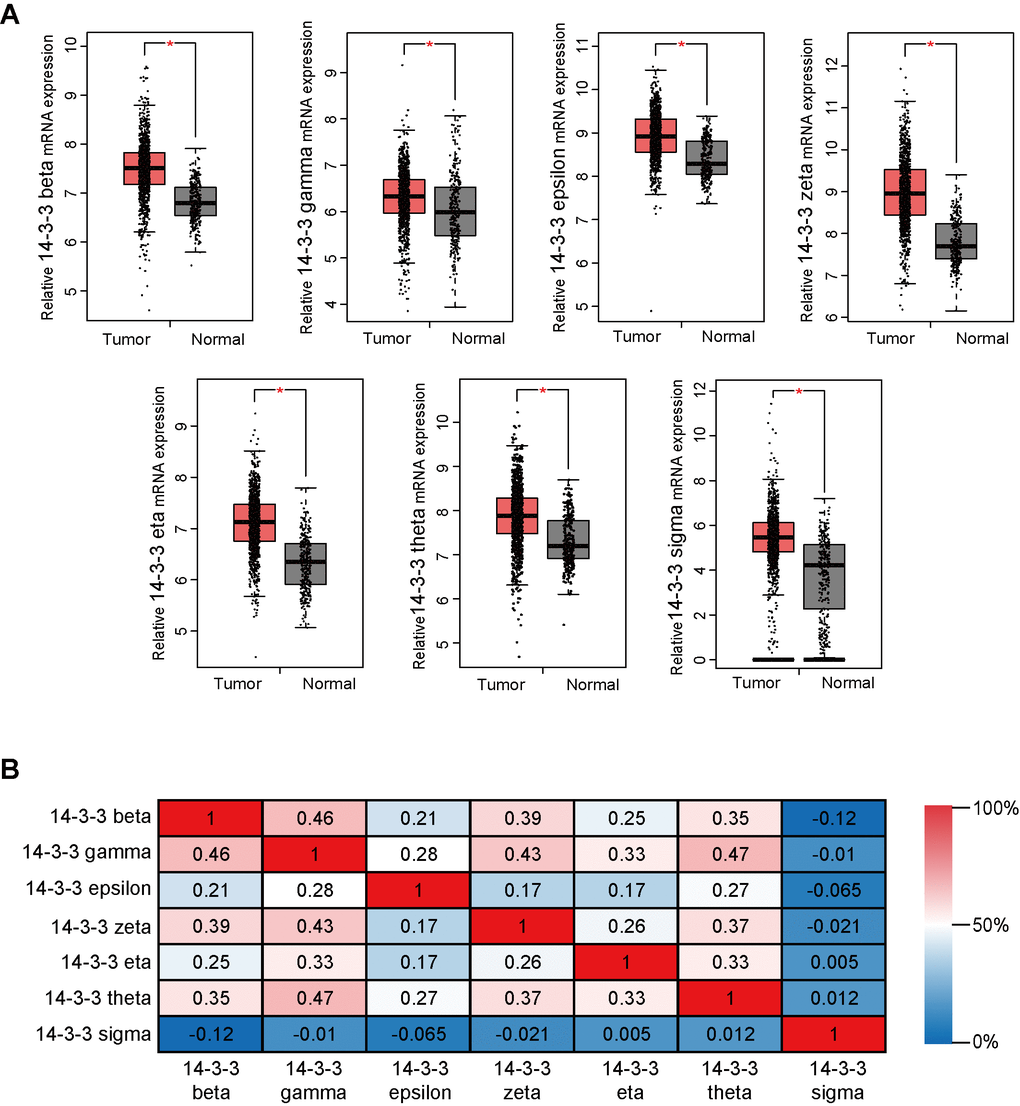
Figure 2. Transcriptional levels of 14-3-3 in BrCa tissues. (A) Box plots derived from gene expression data in GEPIA comparing the expression of 14-3-3 in BrCa and normal tissues. The p-value was set up at 0.05. (B) The Pearson correlation coefficients between 14-3-3 isoforms.