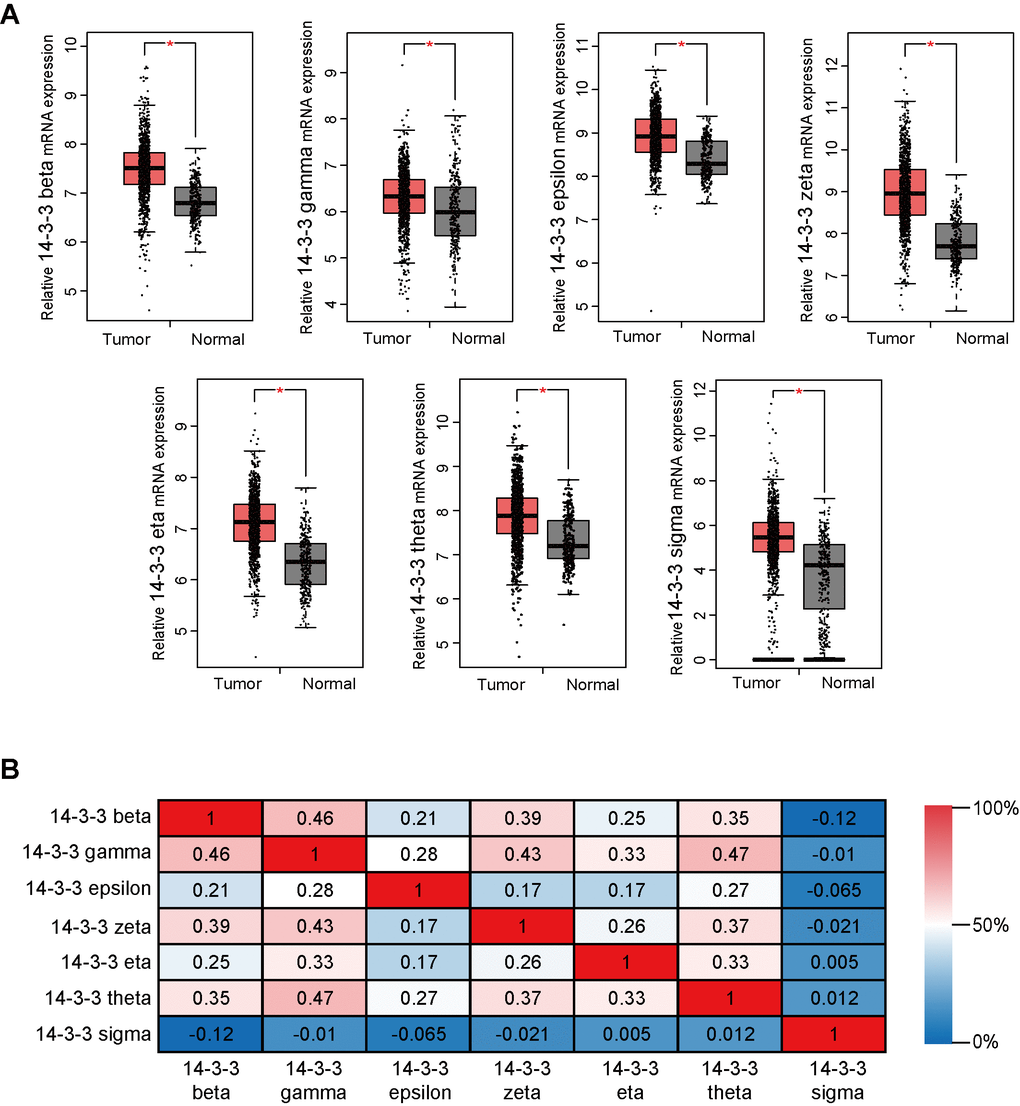
Figure 2.Transcriptional levels of 14-3-3 in BrCa tissues. (A) Box plots derived from gene expression data in GEPIA comparing the expression of 14-3-3 in BrCa and normal tissues. The p-value was set up at 0.05. (B) The Pearson correlation coefficients between 14-3-3 isoforms.