


Introduction
Gastric cancer (GC), as the fifth most common malignancy, leads to the fourth-highest cancer death worldwide [1]. Over one million people are diagnosed with GC every year, which entails a major burden on mobility, mortality, comorbidities, and costs [2]. Although clinical therapy choices such as surgery and systemic chemotherapy advance continuously, the prognosis of advanced GC patients is still very poor [3]. Up to now, traditional evaluation indicators, such as Lauren/WHO classification and tumor-node-metastasis (TNM) staging, are the main methods to evaluate the prognosis of GC patients [4], while the prognostic prediction ability of these indicators is always limited due to the uncharacterized genetic alterations. Therefore, a novel biomarker with reliability and effectiveness is needed for the clinical treatment of GC patients.
Long non-coding RNAs (lncRNAs) are defined as non-coding RNAs with at least 200 bp in length, which are proved to be key regulators in the occurrence and development of malignancies [5, 6]. Aberrant expression of lncRNAs could affect the initiation and progression in a spectrum of malignancies, such as lung cancer [7], breast cancer [8] and colon cancer [9]. Meanwhile, many studies have demonstrated that abnormal expression of lncRNAs like MALAT1 [10], ARHGAP27P1 [11], PANDAR [12] and PTAR [13] would affect the development and progression of GC. In addition, competing endogenous RNAs (ceRNAs) network composed of lncRNAs and mRNAs could influence drug response and contribute to drug resistance in cancer therapy [14]. Currently, the prognosis evaluation of cancer patients receives more and more attention, because it directly affects the choice of treatment to a certain extent. Compared with traditional standard for evaluating cancer prognosis, lncRNA-based signatures demonstrate higher predictive accuracy and better universality, which are increasingly used in clinical work [15].
The past decade has witnessed an outbreak of ferroptosis-associated researches. Ferroptosis, featured in intracellular accumulation of the massive lipid peroxidation, is a kind of regulated necrosis in iron-dependent form, which is distinct from apoptosis, necroptosis, and autophagy [16]. Excessive or defective ferroptosis is proved to be a risk factor for promoting tumorigenesis and as well accelerating malignant processes [17]. Meanwhile, ferroptosis could induce inflammation and immunity response, which would affect cancer progression [18]. For example, Wang et al. [19] found that CD8+ T cells activated by cancer immunotherapy could promote tumor cell lipid peroxidation and ferroptosis, thus contributing to the potential anti-tumor approach of immunotherapy. Several drugs, such as sorafenib, statins and artemisinin, might exert therapeutic effects by inducing ferroptosis [20]. Sun et al. [21] reported that the compound extracted from Chinese liverworts Jungermannia tetragona Lindenb could induce apoptosis and ferroptosis to sensitize cancer cells which were resistant to cisplatin.
Previous studies reported that specific lncRNAs could induce or inhibit ferroptosis in GC cells under different circumstance. LncRNA-PMAN was upregulated in GC cells and inhibited Erastin- and RSL3-induced ferroptosis, leading to poor prognosis and peritoneal metastasis [22]. A hypoxia-induced lncRNA-CBSLR could protect GC cells from ferroptosis, which could contribute to chem-resistance in GC patients [23]. Considering the tight relationship among ferroptosis, lncRNA, and GC, we constructed a molecular signature based on the ferroptosis-related lncRNAs (FRLs) for GC patients in this study, aiming to help the prognosis prediction of GC.
Methods
Data collection
Transcriptome data of GC patients and corresponding clinical information were derived from the TCGA data portal (https://portal.gdc.cancer.gov/, accessed on Aug 3, 2021), and a total of 375 GC samples and 32 non-tumor tissues were obtained. Samples without complete clinical data and the OS < 30 days were extracted to maintain statistical power and reduce bias. Ultimately, a total of 334 GC patients were included and utilized for subsequent analyses.
Identification of FRLs
The list of ferroptosis-related genes (FRGs) was obtained from FerrDb [24], which was an online database containing a comprehensive list of genes and proteins associated with ferroptosis. Differentially expressed lncRNAs (| log2 fold change (FC) | > 1 and FDR < 0.05) between the GC tissue and normal tissue were identified with “limma” R package. Then Pearson correlation analysis was applied to assess the relationship between the FRGs and differentially expressed lncRNAs. LncRNAs with correlation coefficient R2 > 0.3 and P value < 0.001 were considered to be tightly associated with ferroptosis, which were regarded as FRLs.
Construction of FRLSG and evaluation of prognosis prediction ability
First, identified FRLs were subjected to univariable Cox regression to select the lncRNAs associated with prognosis of GC patients. Then these prognostic FRLs were further screened using the LASSO penalty analysis located in the “glmnet” package in R [25]. Finally, multivariable Cox regression analysis was conducted to construct the Ferroptosis-Related LncRNAs Signature for GC patients (FRLSG). The formula of FRLSG was as follows:
GC patients were separated into the high- and low-FRLSG groups based on the median FRLSG score. Kaplan–Meier curve analysis was conducted to assess the survival difference between the high- and low-FRLSG groups with Log-rank P test. The sensitivity and specificity of the FRLSG in predicting prognosis were compared with other clinical features using the receiver operating characteristic (ROC) analysis, and the result was visualized by the “survivalROC” R package. Moreover, principal component analysis (PCA) and t-distribution random neighbor embedding (t-SNE) were conducted based on five FRLs using R packages “stats” and “Rtsne”, respectively.
Construction of the FRLSG-integrated nomogram and gene set enrichment analysis
Univariate and multivariate analyses were conducted on FRLSG and clinicopathological manifestations for the identification of independent prognostic factors. Based on the identified independent prognostic factors, the FRLSG-integrated nomogram was constructed for predicting of 1/3/5-year overall survival of GC patients, which was validated by the calibration curves. Gene Set Enrichment Analysis (GSEA) was applied to detect the different functional phenotypes between the low-FRLSG subgroup and high-FRLSG subgroup in the enrichment of pathways in Kyoto Encyclopedia of Genes and Genomes (KEGG). 1000 random gene set permutations were performed. In addition, Gene Set Variation Analysis (GSVA) was performed to investigate the difference of enrichment score in certain pathway between the high- and low-FRLSG groups.
Immune infiltration analyses
With CIBERSORT algorism, the infiltration of 22 different immune cells was evaluated for each GC patients [26]. To assess the relationship between FRLSG and immune cell infiltration, the Wilcox Test correlation analyses were conducted between the high- and low-FRLSG groups. Furthermore, Single sample Gene Set Enrichment Analysis (ssGESA) and The Estimation of STromal and Immune cells in MAlignant Tumors using Expression data (ESTIMATE) algorithm were performed to evaluate the enrichment level of 24 kinds of immune cells [27] and the immune infiltration score for each GC patient using the “GSVA” and “estimate” R package, respectively [28, 29].
Drug sensitivity analysis
Using the R package “pRRophetic”, transcriptome data of hundreds of cancer cell lines and drug sensitivity data obtained from three large pharmacogenomic projects, including the Cancer Therapeutics Response Portal (CTRP), Repurposing dataset PRISM (PRISM) and the Genomics of Drug Sensitivity in Cancer (GDSC) were integrated to predict transcriptome data-based drug response with the ridge regression model [30]. Moreover, the efficacy of immunotherapy for two groups was predicted based on the available data from melanoma patients who received anti-programmed cell death protein-1 (PD-1) inhibitor and anti-cytotoxic T-lymphocyte-associated protein-4 (CTLA4) inhibitor by the module named “SubMap” in GenePattern [31].
Cell culture and quantitative real-time PCR
The human gastric epithelial cell (GES-1) and GC cell lines (AGS and HGC27) were purchased from the Shanghai Institute of Biochemistry and Cell Biology, Chinese Academy of Sciences, Shanghai, China. All cell lines were cultured in RPMI-1640 medium (Gibco BRL, Grand Island, NY, USA) supplemented with 10% fetal bovine serum (Invitrogen, Camarillo, CA, USA) and 1% penicillin/streptomycin (BasalMedia), at 37°C in a 5% CO2 atmosphere.
Total RNA from GC cells was isolated with TRIZOL reagent (EZBioscience, B004DP) according to the manufacturer protocol. The RNA samples were reversely transcribed to extract corresponding cDNA using Reverse Transcription Kit (EZBioscience, A0010CGQ), and the Quantitative Real-time PCR (qPCR) was performed using SYBR® Green qPCR Master Mix (EZBioscience, A0012-R2). The amplification protocol was as follows: 95°C for 10 mins followed by 40 cycles of 95°C for 15 s and 60°C for 30 s. The internal reference 18s rRNA was utilized as an endogenous control to normalize the expression of each target lncRNAs, and the relative expression quantity was calculated by the following formula: 2 −ΔΔCt (ΔCt = ΔCt target –ΔCt β-actin). Indicated lncRNA expression was measured by qPCR methods with the LightCycler® 480 System (Roche, Basel, Switzerland). Sequences of primers and 18s rRNA were listed as follows:
AL049840.4: F:AAAACAGACGCCGAGGTGAT; R:ACATGACAGTGGCAAGCTGA
AC005532.1: F:GAGTGGGGAGTTCTTGGGAA; R:GGCCACAGATAACTGCTGCT
AC004816.1: F:CGCCTGGTTGCAGAGTGA; R:CTGGACGGAAAGGCTTGGAC
LINC01357: F:CAGTTCAGTGACCTCGGGAA; R:GGCAAGTTGCATGGGTTCTC
AL355574.1: F:TGCTTTCCTCAGGCTCTAAGG; R:CCTGTCCACCTCGTGTTCTT
18 s rRNA: F:GTAACCCGTTGAACCCCATT; R:CCATCCAATCGGTAGTAGCG
Statistical analysis
Unless otherwise specified, all statistical analyses were conducted with R software (version 4.1.3). P-value < 0.05 was considered statistically significant.
Data availability
All data are publicly available. The transcriptome data in this paper are derived from TCGA database (http://www.tcga.org).
Results
Identification of FRLs
Annotation files from the “GENCODE” website were utilized to identify lncRNAs, and 15074 lncRNAs were obtained. Differential expression analysis was performed between tumor tissue and normal tissue, and 326 differentially expressed lncRNAs were finally selected. A total of 259 FRGs (Driver: 108; marker: 111; suppressor: 69) were extracted from the FerrDb (Supplementary Table 1). Moreover, Pearson correlation analysis was carried out between differentially expressed lncRNAs and FRGs, and 296 FRLs were identified (Supplementary Table 2).
Establishment of FRLSG
Univariate Cox regression analysis identified 28 prognosis-associated FRLs, which were included into the LASSO regression analysis (Figure 1A, 1B). 5 FRLs (LINC01357, AC004816.1, AC005532.1, AL049840.4 and AL355574.1) were identified for the construction of the risk model using multivariate Cox regression analysis (Figure 1C). Sankey diagram was utilized to demonstrate the relationships among mRNA, FRLs and risk type (Figure 1D). The formula of FRLSG was as follows: FRLSG = (−0.482537 × expressionLINC01357) + (0.143597 × expressionAC004816.1) + (0.108552 × expressionAC005532.1) + (−0.448995 × expressionAL049840.4) + (0.150565 × expressionAL355574.1).
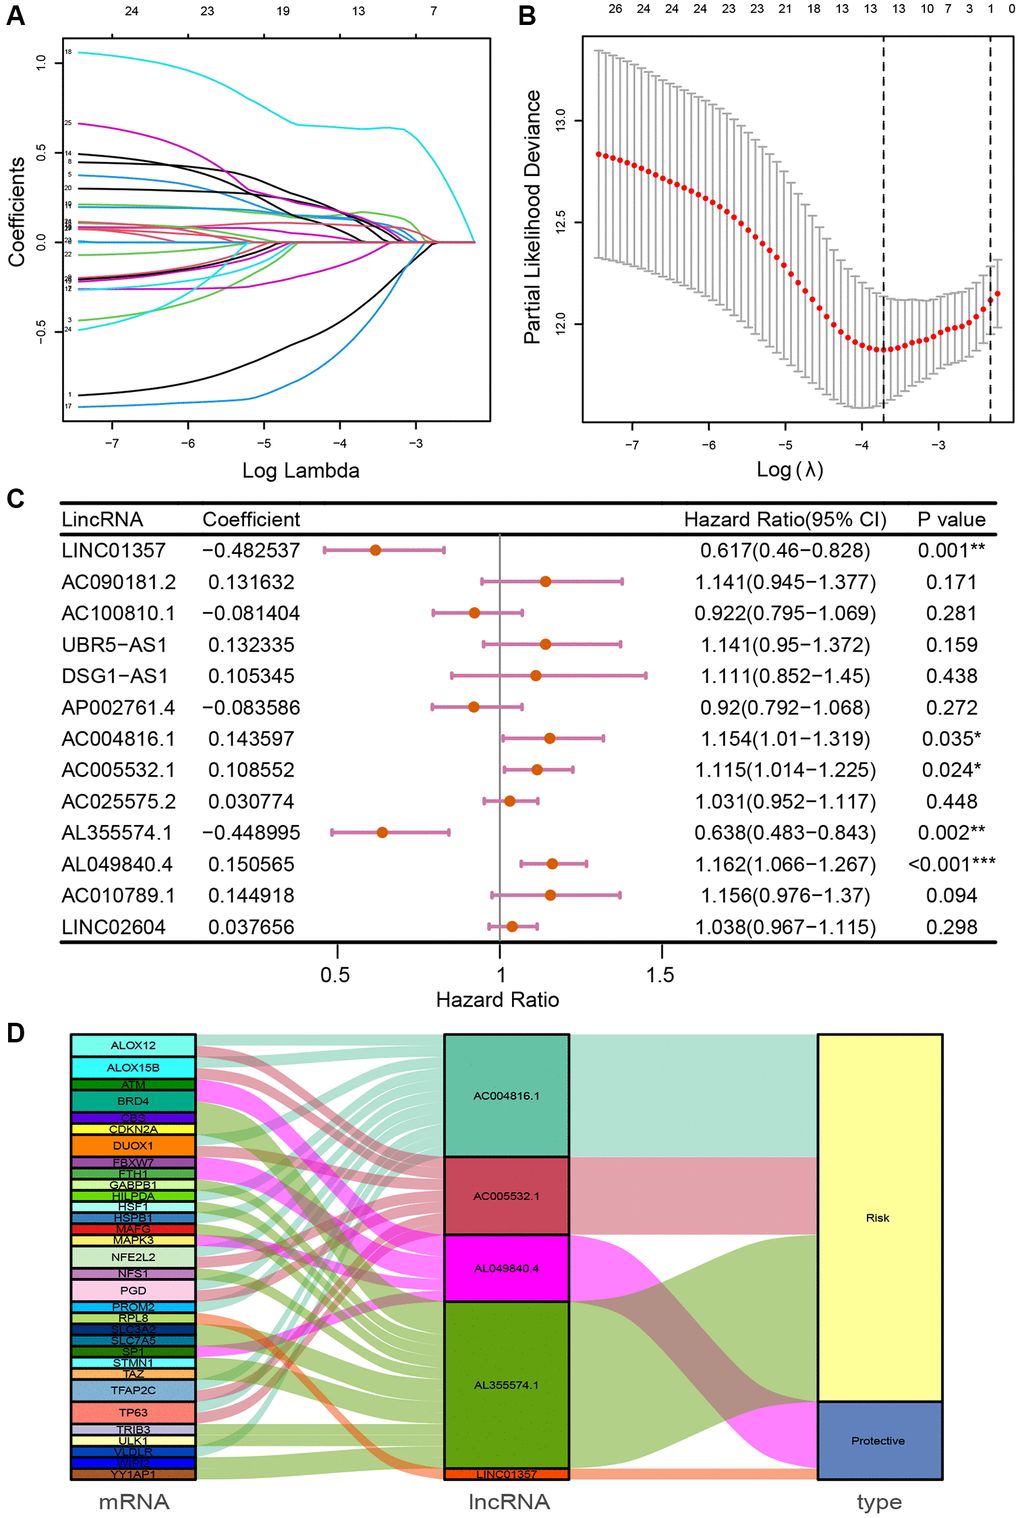
Figure 1. Identification of prognosis-related FRLs and establishment of FRLSG. (A, B) The LASSO regression model for the identification of the most robust FRLs. (C) Forest plot demonstrating FRLs associated with GC survival, analyzed by multivariate Cox regression. *P < 0.05, **P < 0.01, and ***P < 0.001. (D) Sankey diagram showing the relationships among FRGs, FRLs and risk type.
FRLSG shows great prognostic prediction ability
The patient risk survival status plot showed FRLSG was proportional to the number of deceased GC patients (Figure 2A). Kaplan–Meier curve indicated that patients in the high-FRLSG group had worse survival in comparison with those of the low-FRLSG group (P = 2.66E-6, Figure 2B). ROC analysis was utilized to evaluate the prognostic accuracy of FRLSG, and the area under curve (AUC) showed that FRLSG had a reliable ability in predicting survival times for GC patients (1 year AUC = 0.752, 3 years AUC = 0.716, 5 years AUC = 0.711; Figure 2C). In addition, the result of PCA and t-SNE showed distinct division between the high- and low-FRLSG groups based on 5 FRLs (Figure 2D, 2E).
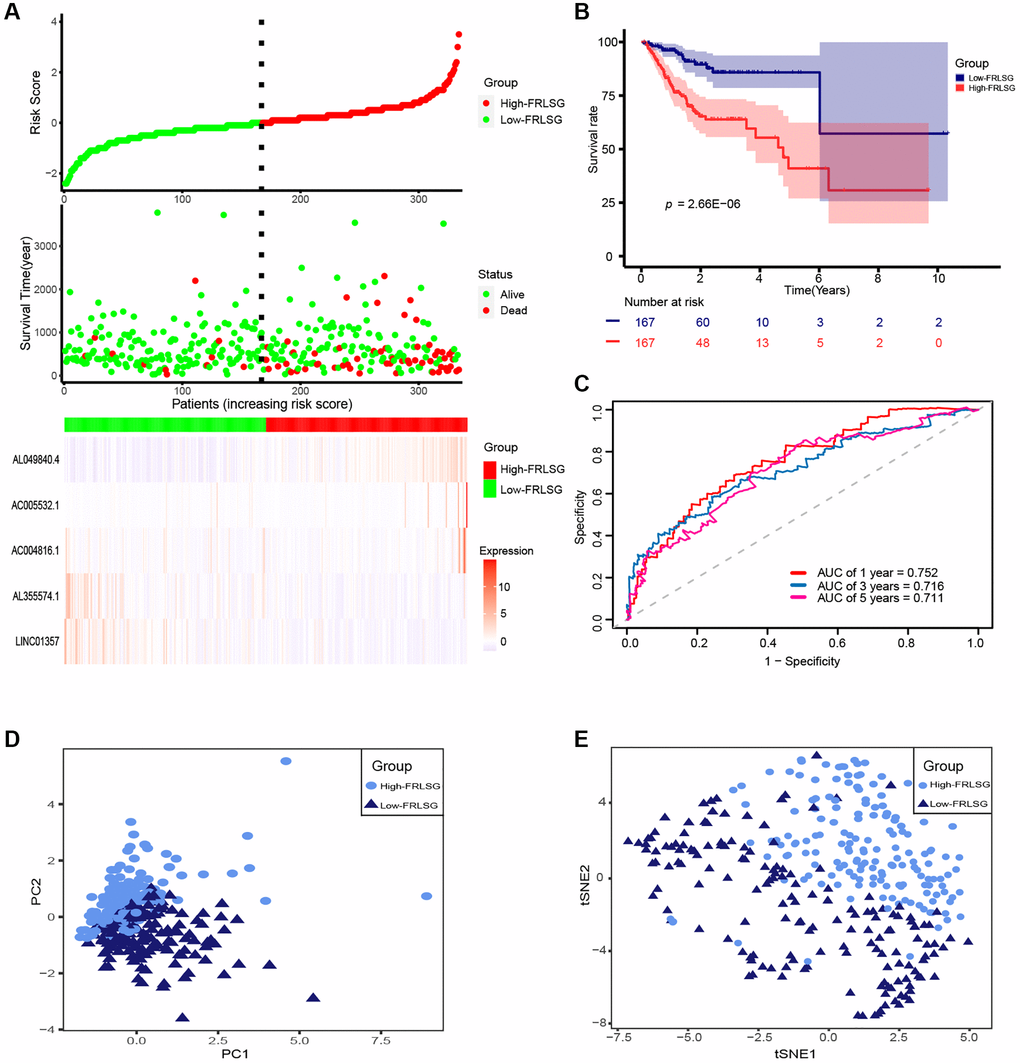
Figure 2. Evaluation of prognosis predicting power for FRLSG. (A) Risk survival status plot (FRLSG score distribution, scatter plots for survival status, and heatmap displaying the expression of 5 FRLs). (B) Kaplan-Meier curve showing the difference of prognosis between the high- and low-FRLSG groups. (C) ROC curves demonstrating the predicting power of FRLSG in predicting 1/3/5-year survival for GC patients. (D) PCA plot and (E) t-SNE plot for the clustering of GC patients based on 5 FRLs.
FRLSG was an independent prognostic factor for GC patients
Univariate analysis showed that FRLSG (P < 0.001), gender (P = 0.013), stage (P < 0.001), N-Stage (P = 0.009) and M-Stage (P = 0.003) were independent risk factors for GC patients (Figure 3A). In addition, multivariate analysis further proved that FRLSG (HR = 2.572, 95% CI = 1.899–3.484, P < 0.001), age (HR = 1.038, 95% CI = 1.008–1.069, P = 0.013) and grade (HR = 2.047, 95% CI = 1.069–3.918, P = 0.031) were independent prognostic indicators for GC patients (Figure 3B). Meanwhile, Multi-parameter ROC curve revealed that the AUC value of FRLSG (0.762) was significantly higher than other clinical indicators, indicating that FRLSG had better ability in prognostic prediction (Figure 3C). Furthermore, the heatmap demonstrated the expression of 5 FRLs in the high- and low-FRLSG groups (Figure 3D). Notably, the FRLSG was proved to be tightly associated with gender based on Fisher’s exact probability test (Figure 3D).
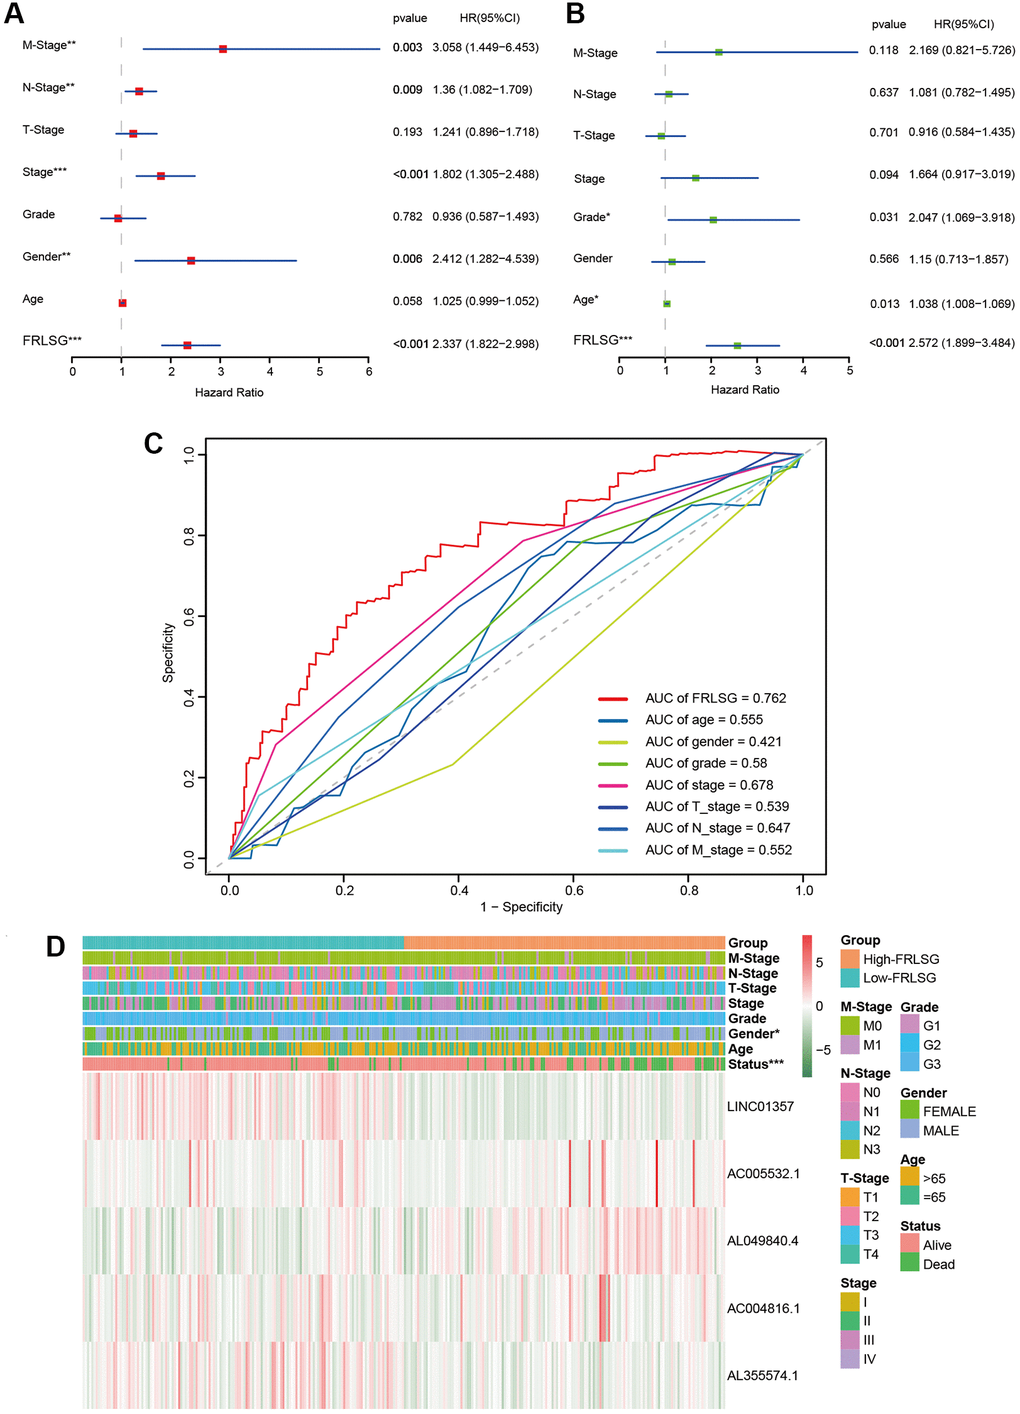
Figure 3. Comparison between FRLSG and clinicopathological characteristics in prognosis predicting power. (A, B) Forest plots demonstrating the FRLSG was an independent prognostic factor for GC. (C) Multi-parameter ROC curve showing the AUC of FRLSG (0.762) was higher than other clinicopathological manifestations. (D) Heatmap showing the clinicopathological characteristics and expression of 5 FRLs in the high- and low-FRLSG groups. *P < 0.05, **P < 0.01, and ***P < 0.001.
The FRLSG-integrated nomogram further enhances prognostic prediction power
Several clinic-pathological factors and FRLSG were used to construct a hybrid nomogram to improve the prognostic prediction power (Figure 4A). The total points of all factors for each patient could be calculated according to the nomogram, which might provide a novel quantitative tool for clinical practice. The calibration curves showed good performance for the nomogram, suggesting that the nomogram was accurate and reliable in predicting the prognosis for patients with GC (Figure 4B–4D).
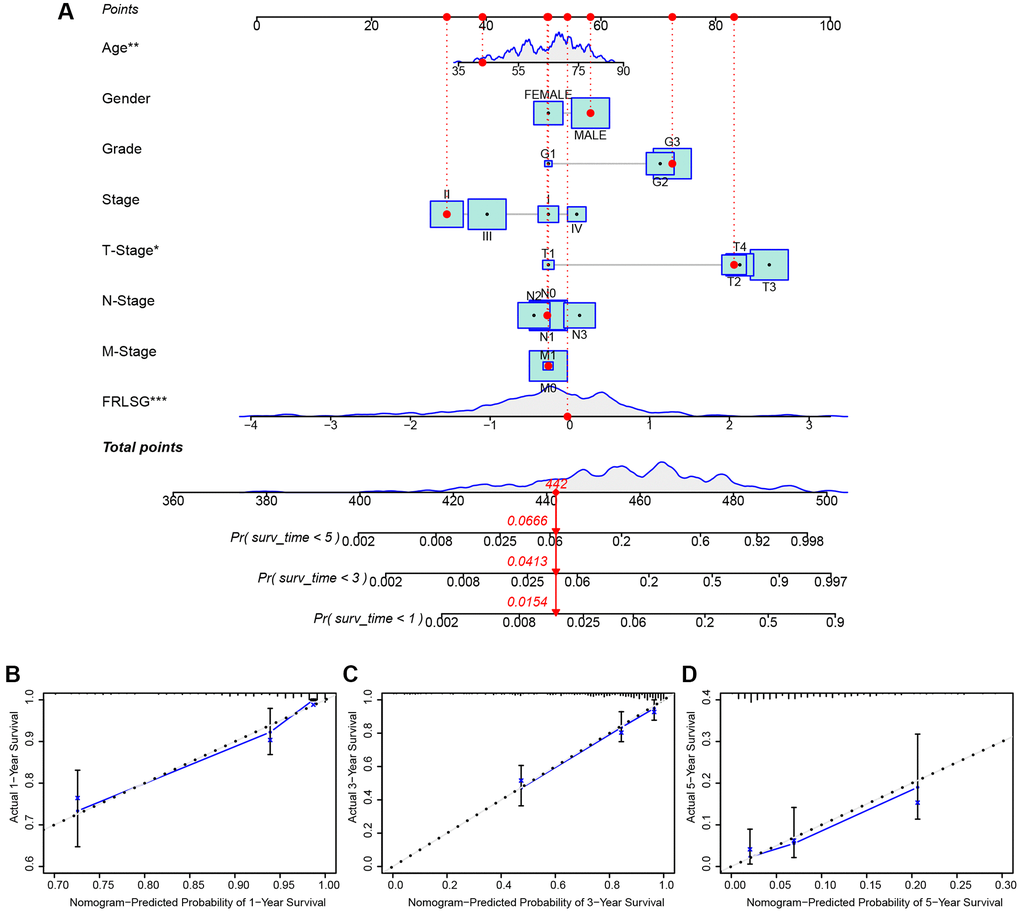
Figure 4. FRLSG-integrated nomogram improving the prognostic prediction power. (A) nomogram plot based on clinic-pathological factors and FRLSG (B–D) Calibration curves for the predictive accuracy (1-, 3-, and 5-year survival) of the FRLSG-integrated nomogram.
Enrichment analyses and immune infiltration analysis demonstrate high immune infiltration status of patients in the high-FRLSG group
To investigate the pathways associated with FRLSG, we employed GSEA software to conduct KEGG enrichment analysis between the high- and the low-FRLSG groups. The result revealed that a total of 17 pathways (Supplementary Table 3) were significantly enriched in the high-FRLSG group. To our surprise, KEGG analysis demonstrated several immune-related pathways such as natural killer cell mediated cytotoxicity, Fc epsilon RI signaling pathway, leukocyte transendothelial migration and chemokine signaling pathway were enriched in the high-FRLSG group, indicating high immune infiltration status of GC patients with high-FRLSG (Figure 5A–5D). Furthermore, GSVA analysis showed that the high-FRLSG group enriched in many immune-related pathways, such as B cell receptor signaling and chemokine signaling, and CTLA4 associated pathways, such as cell adhesion molecules cams and T cell receptor signaling, which suggested GC patients with high-FRLSG might benefit from immunotherapy and anti-CTLA4 therapy (Figure 5E).
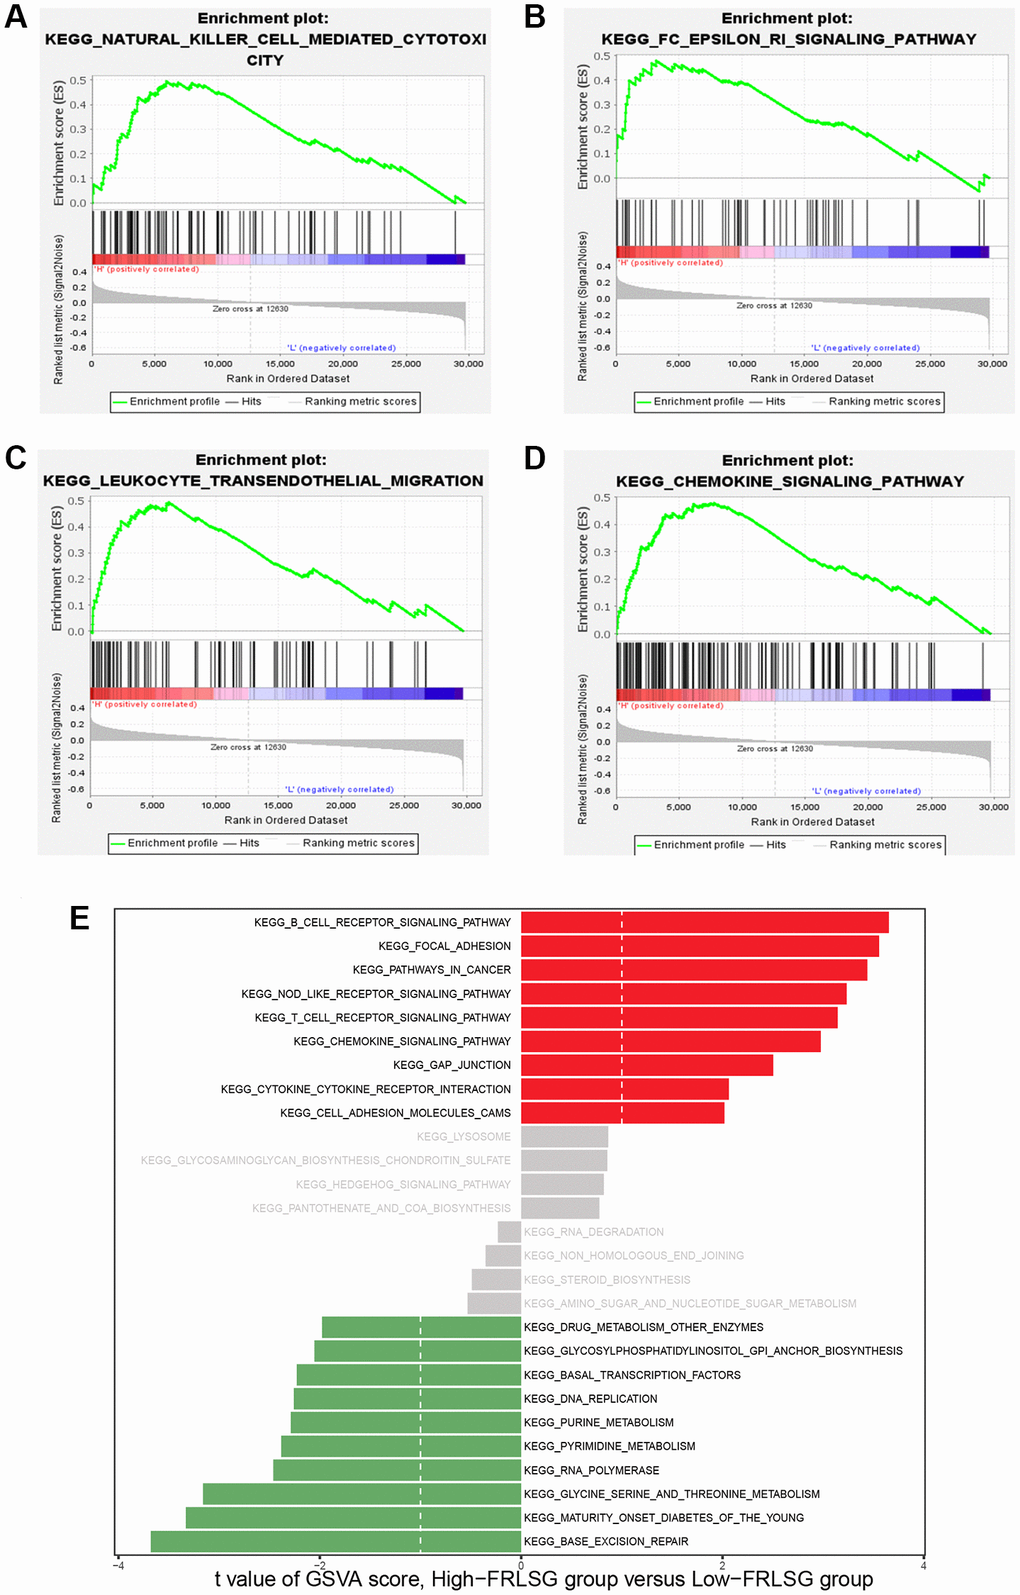
Figure 5. GSEA and GSVA demonstrating the immune-related pathways enriched in the high-FRLSG group. (A–D) Immune-related pathways enriched in the high-FRLSG group through GSEA. (E) GSVA demonstrating the enriched pathways associated with FRLSG. Blue bars indicated the high-FRLSG group associated pathway, while green bars indicated the low-FRLSG group associated pathways.
We further constructed an immune landscape to analyze the 22 kinds of immune cells infiltration in GC patients (Figure 6A). Except for monocytes, gamma delta T cells and mast cell activated, 19 kinds of the immune cells showed significant difference between the high- and low-FRLSG groups. Compared with the low-FRLSG group, the high-FRLSG group had a higher percentage of 14 kinds of immune cells, such as CD8+ T cells, naive CD4+ T cells and activated memory CD4+ T cells, which was consistent with the results of enrichment analyses (Figure 6B). The result of ESTIMATE algorism showed that GC patients with high-FRLSG tended to exhibit high immune score and ESTIMATE score (Figure 6C). In addition, ssGSEA indicated that T helper cells, central memory T cells, T effector memory cells, T follicular helper cells, plasmacytoid dendritic cells and mast cells were evaluated in high-FRLSG patients, which further validated the high immune infiltration status of high-FRLSG patients (Figure 6C).
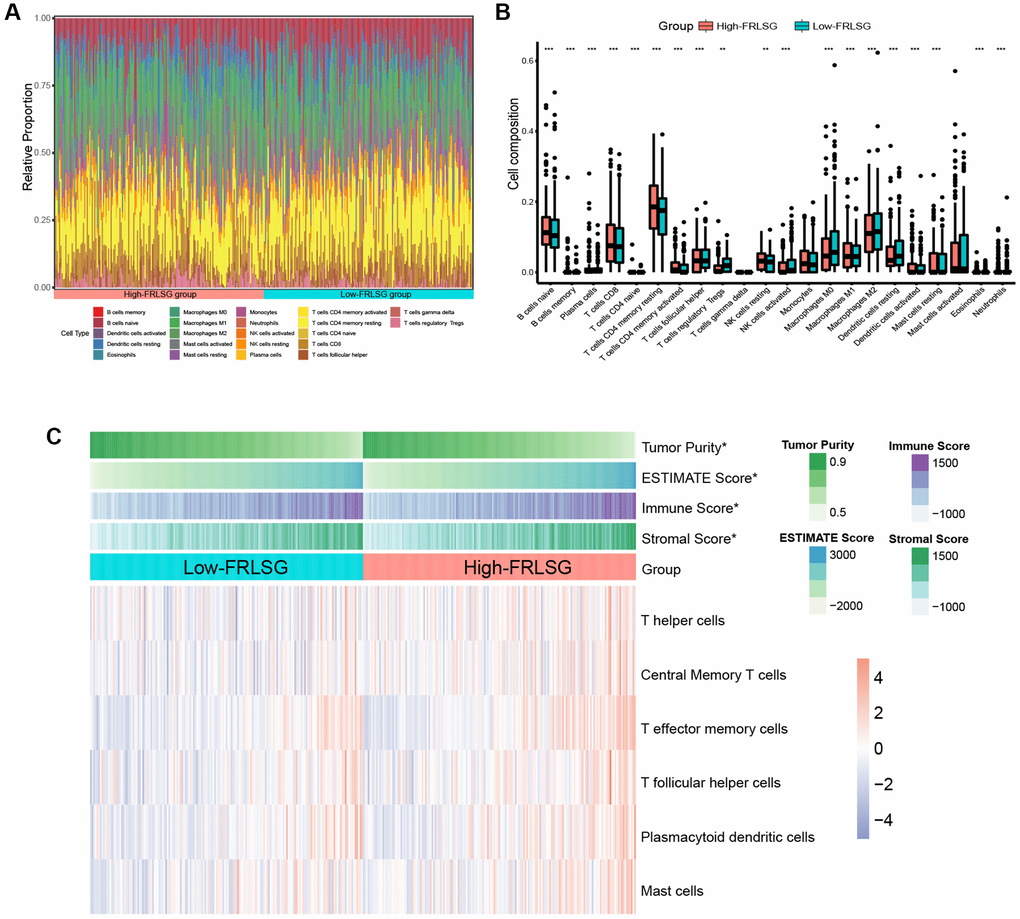
Figure 6. Immune infiltration analyses indicating the high immune infiltration status of high-FRLSG patients. (A) Stacked histogram demonstrated 22 different specific immune cells infiltration in each GC patient. (B) boxplot showed the difference of immune cell infiltration between the high- and low-FRLSG patients. *P < 0.05, **P < 0.01, and ***P < 0.001. (C) Heatmap illustrated the estimated scores of immune signatures calculated by ssGSEA and ESTIMATE algorism in the high- and low-FRLSG patients.
Distinct sensitivity to immunotherapy and targeted therapies prediction
Three pharmacogenomic datasets (CTRP, GDSC and PRISM) containing drug response data and transcriptome profiles of multiple cancer cell lines were used to establish prediction model of drug response. The Venn plot showed the number of drugs of the datasets mentioned above and their intersection (Figure 7A). Differential analysis was performed on computed drug response data between the high- and low-FRLSG patients, and compounds with lower estimated AUC values (log2FC > 0.30, P < 0.05) were considered to be effective. 19 kinds of compounds (3 CTRP-derived compounds, 1 GDSC-derived compounds and 15 PRISM-derived compound) were identified to be potential targeted therapies for the high-FRLSG group (Figure 7B, Supplementary Table 4). Some of these compounds, such as atorvastatin [36] and Palbociclib [37], had been proved to be able to suppress the proliferation and migration of GC cells, which further validated the candidate drug prediction. Besides, GC patients with low FRLSG might be sensitive to 25 different compounds (Supplementary Table 5), which were presented in a scatter plot (Figure 7C).
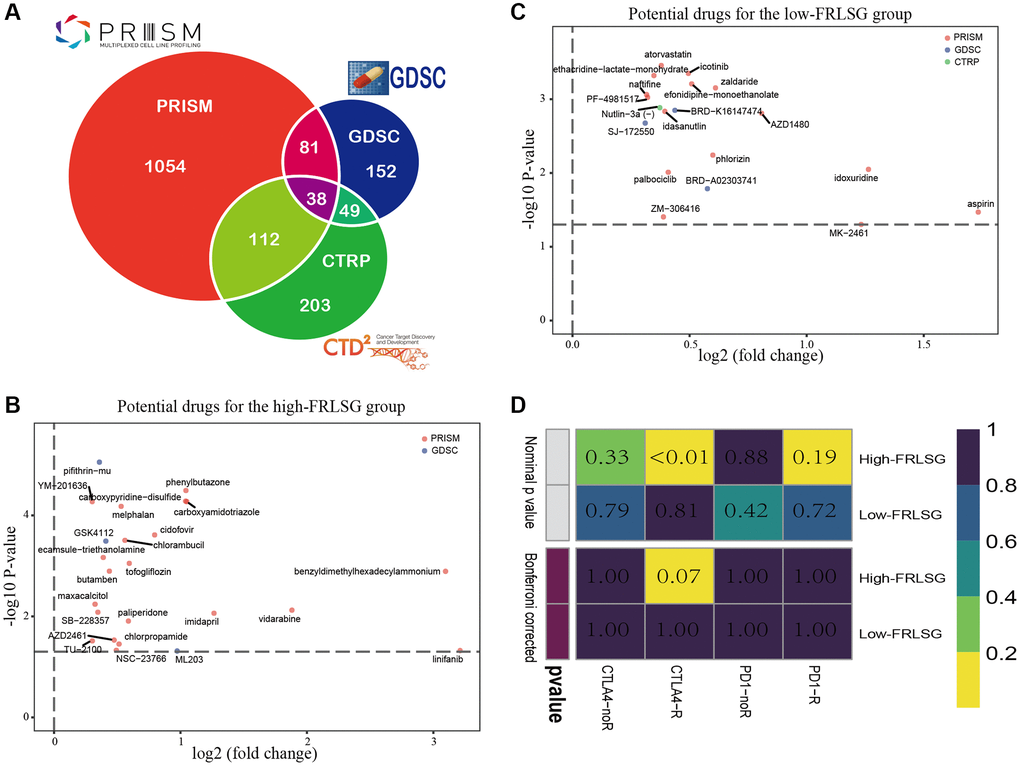
Figure 7. Drug prediction and immunotherapy prediction uncover potential clinical treatment associated with FRLSG. (A) Venn plot for summarizing available compounds in CTRP, GDSC and PRISM projects. (B) Scatter diagram demonstrating candidate drugs with potential therapeutic effect for (B) high-FRLSG patients and (C) low-FRLSG patients (D) Prediction of the response to anti-PD-1 therapy and anti-CTLA4 therapy for the high- and low-FRLSG GC patients.
Using subclass mapping, we compared the transcriptome profiles of two GC subclasses separated by FRLSG with another published dataset containing 47 patients with melanoma who received anti-PD-1 and anti-CTLA4 immunotherapy treatment. The result of SubMap analysis suggested that the high-FRLSG patients had higher drug sensitivity to anti-CTLA4 therapy (p < 0.05), which was consistent with the immune- and CTLA4-related pathways enriched in the high-FRLSG group (Figure 7D).
GC cell lines showing high expression of 5 FRLs
The result of qRT-PCR assay showed AC004816.1, AC005532.1, LINC01357, AL355574.1 and AL049840.4 were overexpressed in HGC27 and AGS compared with GES1, which was consistent with the bioinformatic analyses in our study (Figure 8A–8E). In addition, compared with other four published ferroptosis-related lncRNAs signatures for GC patients, FRLSG demonstrated the highest AUC value, suggesting the priority of FRLSG in prognosis prediction (Figure 8F).
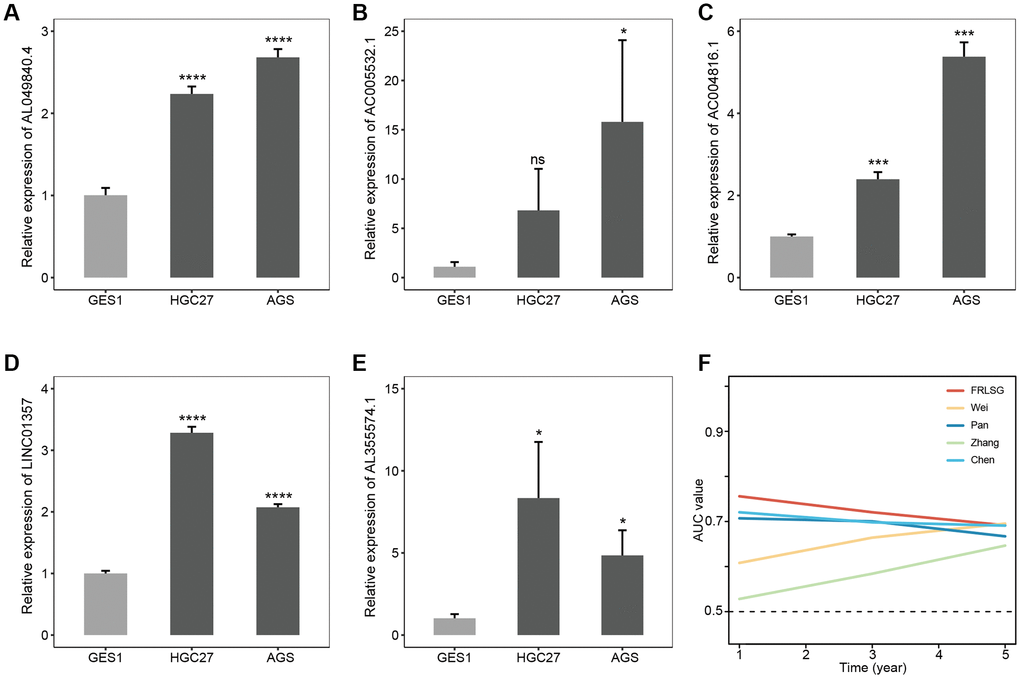
Figure 8. Experimental validation and parallel comparison of FRLSG. The expression level of (A) AL049840.4, (B) AC005532.1, (C) AC004816.1, (D) LINC01357, (E) AL355574.1 in the GES1, HGC27 and AGS. *P < 0.05, **P < 0.01, ***P < 0.001, and ****P < 0.0001. (F) Time-dependent AUC for the comparison of FRLSG with other four previously published ferroptosis-related lncRNAs signatures for GC.
Discussion
The 5-year survival rate of GC ranges from 5% to 69%, which attributes to complex disease heterogeneity, late diagnosis, and suboptimal therapies [38, 39]. With the development of high throughput sequencing, multiple molecular biomarkers are proposed to assess the prognosis and choose therapies for GC patients, which even be more effective than TNM staging and histopathological diagnosis to some extent [40, 41]. However, to date, some molecular signatures are proved to be not stable and universal due to the heterogeneity of GC patients [42]. Therefore, a reliable and applicable signature is needed for customizing the diagnoses and treatments of GC patients.
Compared with protein-coding genes, lncRNAs are proved to regulate fewer targets through simpler pathways [43]. Recently, several studies show that lncRNAs have critical functions in regulating diverse biological processes in GC [44]. Chen et al. [45] reported that lncRNA-SNHG15 could promote proliferation, migration, invasion and apoptosis of GC cells by regulating the expression of miR-506-5p. Overexpression of lncRNA-UCA1 could down-regulate the expression of PD-L1 via repressing the expression of miR-193a and miR-214, resulting in the proliferation, distant migration and immune evasion of GC cells [46]. Further, lncRNA-DLEU2 activated by STAT1 could promote malignant progression of GC through modulating miR-23b-3p/NOTCH2 axis and Notch signaling pathway [47]. Meanwhile, previous studies indicated that ferroptosis was closely related to GC. For example, Apatinib was proved to down-regulate the expression of GPX4 by inhibiting SREBP-1a, which could induce ferroptosis in the GC cells and contribute to the multi-drug-resistant GC cells [48].
In this study, we proposed FRLSG composed of 5 FRLs (AC004816.1, AC005532.1, LINC01357, AL355574.1 and AL049840.4). Among these 5 FRLs, AC004816.1, AC005532.1 and AL049840.4 were risk genes, while LINC01357 and AL355574.1 were protective genes. The result of qRT-PCR assay verified the high expression level of these 5 FRLs in GC cell lines, which were first reported in GC. A recent study showed that AC004816.1, as one of the immune-related lncRNAs, could guide the treatment of prostate cancer [49]. AL049840.4 was reported to be a protective factor in colorectal cancer. Moreover, Miao et al. [50] reported that a seven prognostic lncRNAs signature which contained AC005532.1 could be regarded as a potential prognostic indicator and might have significant clinical value in the treatment of oral squamous cell carcinoma. However, the other 2 lncRNAs have not been reported before and needed further research. Predictive power evaluation, including ROC curve analysis, Kaplan-Meier survival analysis, and risk score plot indicated the high specificity and sensitivity of FRLSG, which was further validated by the AUC value comparison with other previously reported ferroptosis-related lncRNAs signatures for GC. In addition, the FRLSG-integrated nomogram further improved the prognosis predictive power, which might be better applied in clinical practice.
Recently, ferroptosis in tumor tissues was reported to be tightly correlated to immune cell infiltration. Aberrant ferroptosis in tumor tissue could contribute to abnormal increase of granulocyte ratio [51]. To our surprise, the result of GSEA demonstrated several immune-associated pathways were enriched in the high-FRLSG group. Meanwhile, ferroptotic cancer cells were proved to release special signals to induce phagocytosis and promote antigen presentation of dendritic cells [52]. In this study, CIBERSORT algorism demonstrated that the high-FRLSG group had a higher percentage of 14 kinds of high immunoreactive cells, suggesting that FRLSG could reveal immune infiltration to some extent. Based on the result of SubMap analysis, we found the high-FRLSG group might be sensitive to anti-CTLA4 checkpoint inhibitor. Since the screening of the target population becomes a big challenge in immunotherapy, our study might help to screen the benefited population and prolong the prognosis of GC patients. Actually, previous researches have proved ferroptosis could enhance the effectiveness of immunotherapy [53]. For example, Jiang et al. [54] reported that the inhibition of TYRO3 induced tumor ferroptosis and made drug-resistant tumors sensitive to anti-PD-1 therapy. Wan et al. [55] found that radiation-induced bystander effect accompanied by radiotherapy could achieve broad antitumor effects and contribute to immunogenic death mainly by inducing ferroptosis. Interestingly, the microenvironment of hyper-inflamed tumors was enriched in iron, which could result in cancer development and immune escape (T cell dysfunction) [56]. Therefore, inducing ferroptosis rationally to trigger stronger immune response for anti-tumor therapy remains a significant problem to be solved. Drug sensitivity analysis uncovered 19 kinds of compounds for high-FRLSG patients, which might achieve better therapeutic effect in combination with immunotherapy. Besides, 24 kinds of compounds might help to improve the treatment of the low-FRLSG patients, and some compounds have been shown to be effective on GC cells in in vitro experiment. For example, GSK4112, as an agonist of Rev-erbα, was proved to be able to decrease proliferation, glycolytic flux and the pentose phosphate pathway in human GC cells.
Although FRLSG is proved to be reliable and effective, there are still two limitations. First, without external cohort verification, the universality of FRLSG needs to be further validated. Second, the underlying regulatory mechanisms of 5 lncRNAs in ferroptosis remain unclear. Therefore, comprehensive in vivo and in vitro experiments were needed to uncover more convincing evidences for the validation and development of FRLSG.
In conclusion, we proposed FRLSG composed of 5 FRLs, which demonstrated high prognosis predicting power for GC patients. FRLSG could also help the clinical decision-making of immunotherapy, offering an innovative route for the individualized treatment of GC patients.
Author Contributions
H.G., R.Q. and L.Z designed the study and performed the computational analyses. C.Y., X.X. and G.Z. helped with data visualization. H.G. and R.Q. wrote the manuscript. X. X. and Z.Z provided guidance on manuscript preparation. G.Z. and C.Z. were responsible for the supervision and manuscript revision. All authors read and approved the final manuscript.
Acknowledgments
We would like to thank TCGA database for providing their platforms and contributors for uploading their meaningful datasets.
Conflicts of Interest
The authors declare that the research was conducted in the absence of any commercial or financial relationships that could be construed as a potential conflict of interest.
Funding
This work was supported by The National Natural Science Foundation of China (32070878 and 31872740), Shanghai Municipal Education Commission—Gaofeng Clinical Medicine Grant Support (20191905) and Natural Science Foundation of Shanghai (22ZR1438800).
References
- 1. Sung H, Ferlay J, Siegel RL, Laversanne M, Soerjomataram I, Jemal A, Bray F. Global Cancer Statistics 2020: GLOBOCAN Estimates of Incidence and Mortality Worldwide for 36 Cancers in 185 Countries. CA Cancer J Clin. 2021; 71:209–49. https://doi.org/10.3322/caac.21660 [PubMed]
- 2. Bray F, Ferlay J, Soerjomataram I, Siegel RL, Torre LA, Jemal A. Global cancer statistics 2018: GLOBOCAN estimates of incidence and mortality worldwide for 36 cancers in 185 countries. CA Cancer J Clin. 2018; 68:394–424. https://doi.org/10.3322/caac.21492 [PubMed]
- 3. Joshi SS, Badgwell BD. Current treatment and recent progress in gastric cancer. CA Cancer J Clin. 2021; 71:264–79. https://doi.org/10.3322/caac.21657 [PubMed]
- 4. Fu M, Gu J, Jiang P, Qian H, Xu W, Zhang X. Exosomes in gastric cancer: roles, mechanisms, and applications. Mol Cancer. 2019; 18:41. https://doi.org/10.1186/s12943-019-1001-7 [PubMed]
- 5. Zhou M, Guo M, He D, Wang X, Cui Y, Yang H, Hao D, Sun J. A potential signature of eight long non-coding RNAs predicts survival in patients with non-small cell lung cancer. J Transl Med. 2015; 13:231. https://doi.org/10.1186/s12967-015-0556-3 [PubMed]
- 6. Martens-Uzunova ES, Böttcher R, Croce CM, Jenster G, Visakorpi T, Calin GA. Long noncoding RNA in prostate, bladder, and kidney cancer. Eur Urol. 2014; 65:1140–51. https://doi.org/10.1016/j.eururo.2013.12.003 [PubMed]
- 7. Sun CC, Zhu W, Li SJ, Hu W, Zhang J, Zhuo Y, Zhang H, Wang J, Zhang Y, Huang SX, He QQ, Li DJ. FOXC1-mediated LINC00301 facilitates tumor progression and triggers an immune-suppressing microenvironment in non-small cell lung cancer by regulating the HIF1α pathway. Genome Med. 2020; 12:77. https://doi.org/10.1186/s13073-020-00773-y [PubMed]
- 8. Wang L, Luan T, Zhou S, Lin J, Yang Y, Liu W, Tong X, Jiang W. LncRNA HCP5 promotes triple negative breast cancer progression as a ceRNA to regulate BIRC3 by sponging miR-219a-5p. Cancer Med. 2019; 8:4389–403. https://doi.org/10.1002/cam4.2335 [PubMed]
- 9. Yue B, Liu C, Sun H, Liu M, Song C, Cui R, Qiu S, Zhong M. A Positive Feed-Forward Loop between LncRNA-CYTOR and Wnt/β-Catenin Signaling Promotes Metastasis of Colon Cancer. Mol Ther. 2018; 26:1287–98. https://doi.org/10.1016/j.ymthe.2018.02.024 [PubMed]
- 10. Syllaios A, Moris D, Karachaliou GS, Sakellariou S, Karavokyros I, Gazouli M, Schizas D. Pathways and role of MALAT1 in esophageal and gastric cancer. Oncol Lett. 2021; 21:343. https://doi.org/10.3892/ol.2021.12604 [PubMed]
- 11. Zhang G, Xu Y, Zou C, Tang Y, Lu J, Gong Z, Ma G, Zhang W, Jiang P. Long noncoding RNA ARHGAP27P1 inhibits gastric cancer cell proliferation and cell cycle progression through epigenetically regulating p15 and p16. Aging (Albany NY). 2019; 11:9090–110. https://doi.org/10.18632/aging.102377 [PubMed]
- 12. Liu J, Ben Q, Lu E, He X, Yang X, Ma J, Zhang W, Wang Z, Liu T, Zhang J, Wang H. Long noncoding RNA PANDAR blocks CDKN1A gene transcription by competitive interaction with p53 protein in gastric cancer. Cell Death Dis. 2018; 9:168. https://doi.org/10.1038/s41419-017-0246-6 [PubMed]
- 13. Liang H, Yu T, Han Y, Jiang H, Wang C, You T, Zhao X, Shan H, Yang R, Yang L, Shan H, Gu Y. Correction to: LncRNA PTAR promotes EMT and invasionmetastasis in serous ovarian cancer by competitively binding miR-101-3p to regulate ZEB1 expression. Mol Cancer. 2021; 20:64. https://doi.org/10.1186/s12943-021-01344-4 [PubMed]
- 14. Liu H, Wang S, Zhou S, Meng Q, Ma X, Song X, Wang L, Jiang W. Drug Resistance-Related Competing Interactions of lncRNA and mRNA across 19 Cancer Types. Mol Ther Nucleic Acids. 2019; 16:442–51. https://doi.org/10.1016/j.omtn.2019.03.011 [PubMed]
- 15. Zhu X, Tian X, Yu C, Shen C, Yan T, Hong J, Wang Z, Fang JY, Chen H. A long non-coding RNA signature to improve prognosis prediction of gastric cancer. Mol Cancer. 2016; 15:60. https://doi.org/10.1186/s12943-016-0544-0 [PubMed]
- 16. Lei G, Mao C, Yan Y, Zhuang L, Gan B. Ferroptosis, radiotherapy, and combination therapeutic strategies. Protein Cell. 2021; 12:836–57. https://doi.org/10.1007/s13238-021-00841-y [PubMed]
- 17. Stockwell BR, Friedmann Angeli JP, Bayir H, Bush AI, Conrad M, Dixon SJ, Fulda S, Gascón S, Hatzios SK, Kagan VE, Noel K, Jiang X, Linkermann A, et al. Ferroptosis: A Regulated Cell Death Nexus Linking Metabolism, Redox Biology, and Disease. Cell. 2017; 171:273–85. https://doi.org/10.1016/j.cell.2017.09.021 [PubMed]
- 18. Tang D, Chen X, Kang R, Kroemer G. Ferroptosis: molecular mechanisms and health implications. Cell Res. 2021; 31:107–25. https://doi.org/10.1038/s41422-020-00441-1 [PubMed]
- 19. Wang W, Green M, Choi JE, Gijón M, Kennedy PD, Johnson JK, Liao P, Lang X, Kryczek I, Sell A, Xia H, Zhou J, Li G, et al. CD8+ T cells regulate tumour ferroptosis during cancer immunotherapy. Nature. 2019; 569:270–4. https://doi.org/10.1038/s41586-019-1170-y [PubMed]
- 20. Chen X, Kang R, Kroemer G, Tang D. Broadening horizons: the role of ferroptosis in cancer. Nat Rev Clin Oncol. 2021; 18:280–96. https://doi.org/10.1038/s41571-020-00462-0 [PubMed]
- 21. Sun Y, Qiao Y, Liu Y, Zhou J, Wang X, Zheng H, Xu Z, Zhang J, Zhou Y, Qian L, Zhang C, Lou H. ent-Kaurane diterpenoids induce apoptosis and ferroptosis through targeting redox resetting to overcome cisplatin resistance. Redox Biol. 2021; 43:101977. https://doi.org/10.1016/j.redox.2021.101977 [PubMed]
- 22. Lin Z, Song J, Gao Y, Huang S, Dou R, Zhong P, Huang G, Han L, Zheng J, Zhang X, Wang S, Xiong B. Hypoxia-induced HIF-1α/lncRNA-PMAN inhibits ferroptosis by promoting the cytoplasmic translocation of ELAVL1 in peritoneal dissemination from gastric cancer. Redox Biol. 2022; 52:102312. https://doi.org/10.1016/j.redox.2022.102312 [PubMed]
- 23. Yang H, Hu Y, Weng M, Liu X, Wan P, Hu Y, Ma M, Zhang Y, Xia H, Lv K. Hypoxia inducible lncRNA-CBSLR modulates ferroptosis through m6A-YTHDF2-dependent modulation of CBS in gastric cancer. J Adv Res. 2021; 37:91–106. https://doi.org/10.1016/j.jare.2021.10.001 [PubMed]
- 24. Zhou N, Bao J. FerrDb: a manually curated resource for regulators and markers of ferroptosis and ferroptosis-disease associations. Database (Oxford). 2020; 2020:baaa021. https://doi.org/10.1093/database/baaa021 [PubMed]
- 25. Friedman J, Hastie T, Tibshirani R. Regularization Paths for Generalized Linear Models via Coordinate Descent. J Stat Softw. 2010; 33:1–22. [PubMed]
- 26. Newman AM, Liu CL, Green MR, Gentles AJ, Feng W, Xu Y, Hoang CD, Diehn M, Alizadeh AA. Robust enumeration of cell subsets from tissue expression profiles. Nat Methods. 2015; 12:453–7. https://doi.org/10.1038/nmeth.3337 [PubMed]
- 27. Bindea G, Mlecnik B, Tosolini M, Kirilovsky A, Waldner M, Obenauf AC, Angell H, Fredriksen T, Lafontaine L, Berger A, Bruneval P, Fridman WH, Becker C, et al. Spatiotemporal dynamics of intratumoral immune cells reveal the immune landscape in human cancer. Immunity. 2013; 39:782–95. https://doi.org/10.1016/j.immuni.2013.10.003 [PubMed]
- 28. Hänzelmann S, Castelo R, Guinney J. GSVA: gene set variation analysis for microarray and RNA-seq data. BMC Bioinformatics. 2013; 14:7. https://doi.org/10.1186/1471-2105-14-7 [PubMed]
- 29. Yoshihara K, Shahmoradgoli M, Martínez E, Vegesna R, Kim H, Torres-Garcia W, Treviño V, Shen H, Laird PW, Levine DA, Carter SL, Getz G, Stemke-Hale K, et al. Inferring tumour purity and stromal and immune cell admixture from expression data. Nat Commun. 2013; 4:2612. https://doi.org/10.1038/ncomms3612 [PubMed]
- 30. Geeleher P, Cox N, Huang RS. pRRophetic: an R package for prediction of clinical chemotherapeutic response from tumor gene expression levels. PLoS One. 2014; 9:e107468. https://doi.org/10.1371/journal.pone.0107468 [PubMed]
- 31. Roh W, Chen PL, Reuben A, Spencer CN, Prieto PA, Miller JP, Gopalakrishnan V, Wang F, Cooper ZA, Reddy SM, Gumbs C, Little L, Chang Q, et al. Integrated molecular analysis of tumor biopsies on sequential CTLA-4 and PD-1 blockade reveals markers of response and resistance. Sci Transl Med. 2017; 9:eaah3560. https://doi.org/10.1126/scitranslmed.aah3560 [PubMed]
- 32. Wei J, Zeng Y, Gao X, Liu T. A novel ferroptosis-related lncRNA signature for prognosis prediction in gastric cancer. BMC Cancer. 2021; 21:1221. https://doi.org/10.1186/s12885-021-08975-2 [PubMed]
- 33. Pan J, Zhang X, Fang X, Xin Z. Construction on of a Ferroptosis-Related lncRNA-Based Model to Improve the Prognostic Evaluation of Gastric Cancer Patients Based on Bioinformatics. Front Genet. 2021; 12:739470. https://doi.org/10.3389/fgene.2021.739470 [PubMed]
- 34. Zhang S, Zheng N, Chen X, Du K, Yang J, Shen L. Establishment and Validation of a Ferroptosis-Related Long Non-Coding RNA Signature for Predicting the Prognosis of Stomach Adenocarcinoma. Front Genet. 2022; 13:818306. https://doi.org/10.3389/fgene.2022.818306 [PubMed]
- 35. Chen W, Feng Z, Huang J, Fu P, Xiong J, Cao Y, Liu Y, Tu Y, Li Z, Jie Z, Xiao T. Identification of Ferroptosis-Related Long Noncoding RNA and Construction of a Novel Prognostic Signature for Gastric Cancer. Dis Markers. 2021; 2021:7724997. https://doi.org/10.1155/2021/7724997 [PubMed]
- 36. Wei J, Peng K, Zhu J, Wang L, Han T, Sun A, Shao G, Liu H, Yang W, Lin Q. Geranylgeranylation promotes proliferation, migration and invasion of gastric cancer cells through the YAP signaling pathway. Am J Transl Res. 2020; 12:5296–307. [PubMed]
- 37. Min A, Kim JE, Kim YJ, Lim JM, Kim S, Kim JW, Lee KH, Kim TY, Oh DY, Bang YJ, Im SA. Cyclin E overexpression confers resistance to the CDK4/6 specific inhibitor palbociclib in gastric cancer cells. Cancer Lett. 2018; 430:123–32. https://doi.org/10.1016/j.canlet.2018.04.037 [PubMed]
- 38. Viale PH. The American Cancer Society's Facts & Figures: 2020 Edition. J Adv Pract Oncol. 2020; 11:135–6. https://doi.org/10.6004/jadpro.2020.11.2.1 [PubMed]
- 39. Canale M, Casadei-Gardini A, Ulivi P, Arechederra M, Berasain C, Lollini PL, Fernández-Barrena MG, Avila MA. Epigenetic Mechanisms in Gastric Cancer: Potential New Therapeutic Opportunities. Int J Mol Sci. 2020; 21:5500. https://doi.org/10.3390/ijms21155500 [PubMed]
- 40. Chlis NK, Bei ES, Zervakis M. Introducing a Stable Bootstrap Validation Framework for Reliable Genomic Signature Extraction. IEEE/ACM Trans Comput Biol Bioinform. 2018; 15:181–90. https://doi.org/10.1109/TCBB.2016.2633267 [PubMed]
- 41. Sasahara M, Kanda M, Kodera Y. Update on molecular biomarkers for diagnosis and prediction of prognosis and treatment responses in gastric cancer. Histol Histopathol. 2021; 36:817–32. https://doi.org/10.14670/HH-18-326 [PubMed]
- 42. Halske C. Intratumorale Heterogenität des Magenkarzinoms – Einfluss auf die Biomarkeretablierung [Intratumoral heterogeneity of gastric cancer-impact on biomarker evaluation]. Pathologe. 2020 (Suppl 2); 41:76–82. https://doi.org/10.1007/s00292-020-00881-x [PubMed]
- 43. de Goede OM, Nachun DC, Ferraro NM, Gloudemans MJ, Rao AS, Smail C, Eulalio TY, Aguet F, Ng B, Xu J, Barbeira AN, Castel SE, Kim-Hellmuth S, et al, and GTEx Consortium. Population-scale tissue transcriptomics maps long non-coding RNAs to complex disease. Cell. 2021; 184:2633–48.e19. https://doi.org/10.1016/j.cell.2021.03.050 [PubMed]
- 44. Jiang N, Zhang X, Gu X, Li X, Shang L. Progress in understanding the role of lncRNA in programmed cell death. Cell Death Discov. 2021; 7:30. https://doi.org/10.1038/s41420-021-00407-1 [PubMed]
- 45. Chen Z, Zhong T, Li T, Zhong J, Tang Y, Liu Z, Ling B, Wang L. LncRNA SNHG15 modulates gastric cancer tumorigenesis by impairing miR-506-5p expression. Biosci Rep. 2021; 41:BSR20204177. https://doi.org/10.1042/BSR20204177 [PubMed]
- 46. Wang CJ, Zhu CC, Xu J, Wang M, Zhao WY, Liu Q, Zhao G, Zhang ZZ. The lncRNA UCA1 promotes proliferation, migration, immune escape and inhibits apoptosis in gastric cancer by sponging anti-tumor miRNAs. Mol Cancer. 2019; 18:115. https://doi.org/10.1186/s12943-019-1032-0 [PubMed]
- 47. Li G, Zhang Z, Chen Z, Liu B, Wu H. LncRNA DLEU2 is activated by STAT1 and induces gastric cancer development via targeting miR-23b-3p/NOTCH2 axis and Notch signaling pathway. Life Sci. 2021; 277:119419. https://doi.org/10.1016/j.lfs.2021.119419 [PubMed]
- 48. Zhao L, Peng Y, He S, Li R, Wang Z, Huang J, Lei X, Li G, Ma Q. Apatinib induced ferroptosis by lipid peroxidation in gastric cancer. Gastric Cancer. 2021; 24:642–54. https://doi.org/10.1007/s10120-021-01159-8 [PubMed]
- 49. Zhang J, Lu J, Li A, Wang H, Zheng W. A rare complication and proper management in cholangioenteric Roux-en-Y anastomosis. Endoscopy. 2022. [Epub ahead of print]. https://doi.org/10.1055/a-1886-3464 [PubMed]
- 50. Miao T, Si Q, Wei Y, Fan R, Wang J, An X. Identification and validation of seven prognostic long non-coding RNAs in oral squamous cell carcinoma. Oncol Lett. 2020; 20:939–46. https://doi.org/10.3892/ol.2020.11603 [PubMed]
- 51. Zhang Y, Song J, Zhao Z, Yang M, Chen M, Liu C, Ji J, Zhu D. Single-cell transcriptome analysis reveals tumor immune microenvironment heterogenicity and granulocytes enrichment in colorectal cancer liver metastases. Cancer Lett. 2020; 470:84–94. https://doi.org/10.1016/j.canlet.2019.10.016 [PubMed]
- 52. Friedmann Angeli JP, Krysko DV, Conrad M. Ferroptosis at the crossroads of cancer-acquired drug resistance and immune evasion. Nat Rev Cancer. 2019; 19:405–14. https://doi.org/10.1038/s41568-019-0149-1 [PubMed]
- 53. Tang R, Xu J, Zhang B, Liu J, Liang C, Hua J, Meng Q, Yu X, Shi S. Ferroptosis, necroptosis, and pyroptosis in anticancer immunity. J Hematol Oncol. 2020; 13:110. https://doi.org/10.1186/s13045-020-00946-7 [PubMed]
- 54. Jiang Z, Lim SO, Yan M, Hsu JL, Yao J, Wei Y, Chang SS, Yamaguchi H, Lee HH, Ke B, Hsu JM, Chan LC, Hortobagyi GN, et al. TYRO3 induces anti-PD-1/PD-L1 therapy resistance by limiting innate immunity and tumoral ferroptosis. J Clin Invest. 2021; 131:139434. https://doi.org/10.1172/JCI139434 [PubMed]
- 55. Wan C, Sun Y, Tian Y, Lu L, Dai X, Meng J, Huang J, He Q, Wu B, Zhang Z, Jiang K, Hu D, Wu G, et al. Irradiated tumor cell-derived microparticles mediate tumor eradication via cell killing and immune reprogramming. Sci Adv. 2020; 6:eaay9789. https://doi.org/10.1126/sciadv.aay9789 [PubMed]
- 56. Sacco A, Battaglia AM, Botta C, Aversa I, Mancuso S, Costanzo F, Biamonte F. Iron Metabolism in the Tumor Microenvironment-Implications for Anti-Cancer Immune Response. Cells. 2021; 10:303. https://doi.org/10.3390/cells10020303 [PubMed]