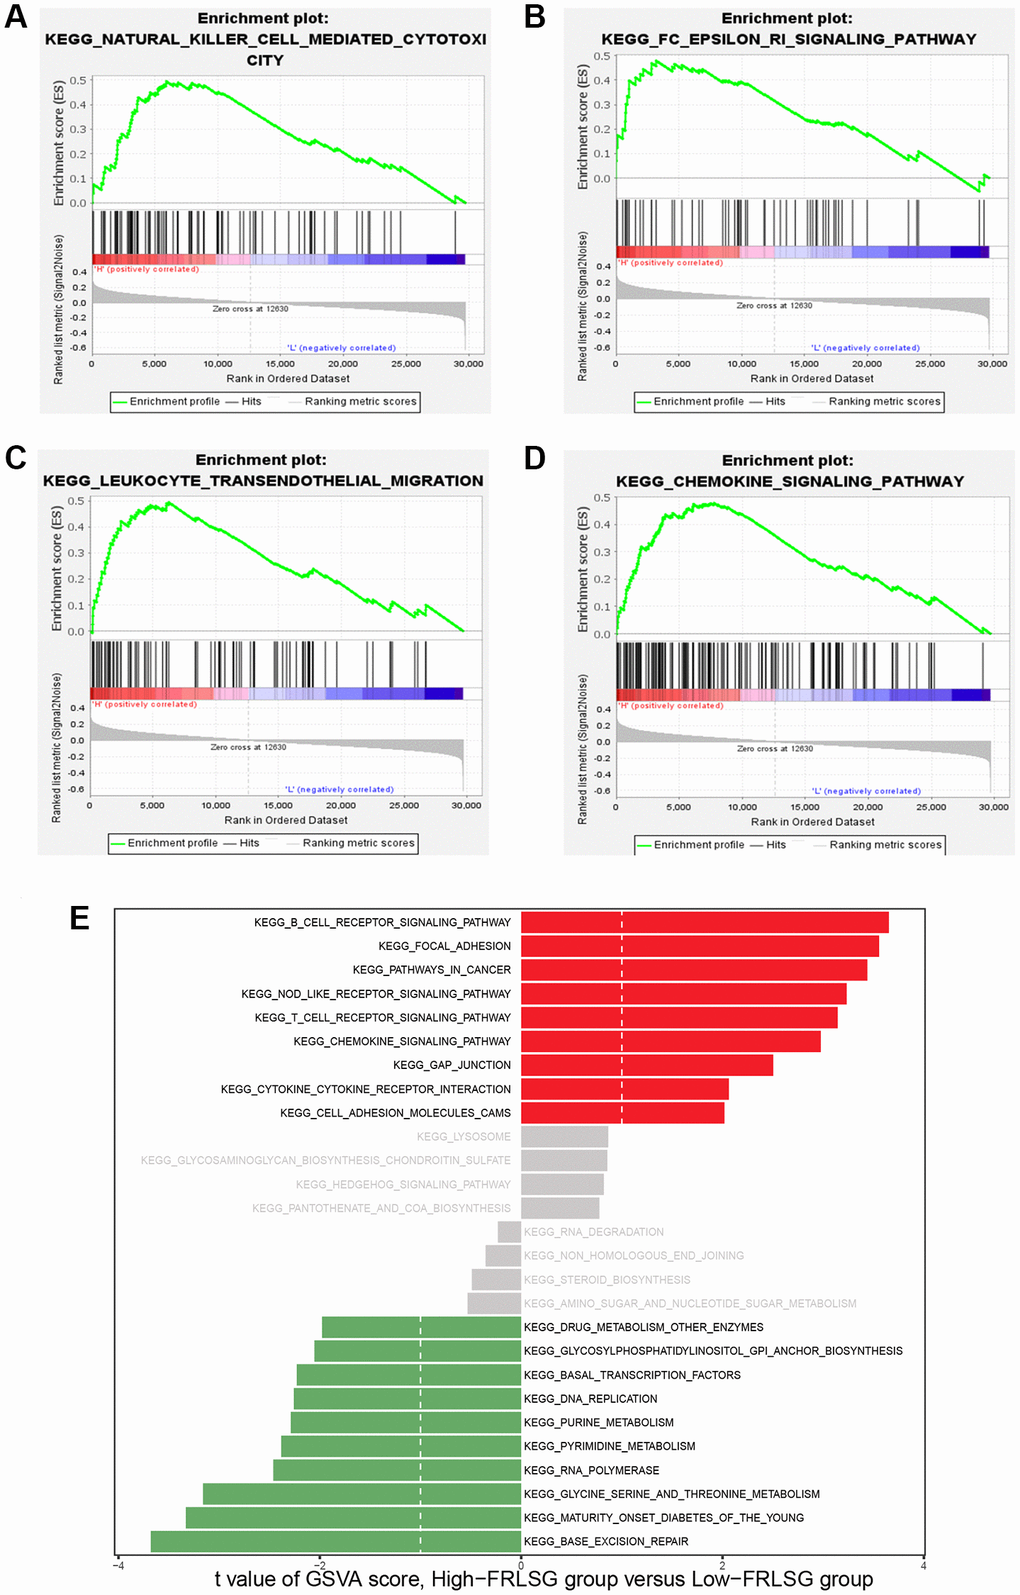
Figure 5.GSEA and GSVA demonstrating the immune-related pathways enriched in the high-FRLSG group. (A–D) Immune-related pathways enriched in the high-FRLSG group through GSEA. (E) GSVA demonstrating the enriched pathways associated with FRLSG. Blue bars indicated the high-FRLSG group associated pathway, while green bars indicated the low-FRLSG group associated pathways.