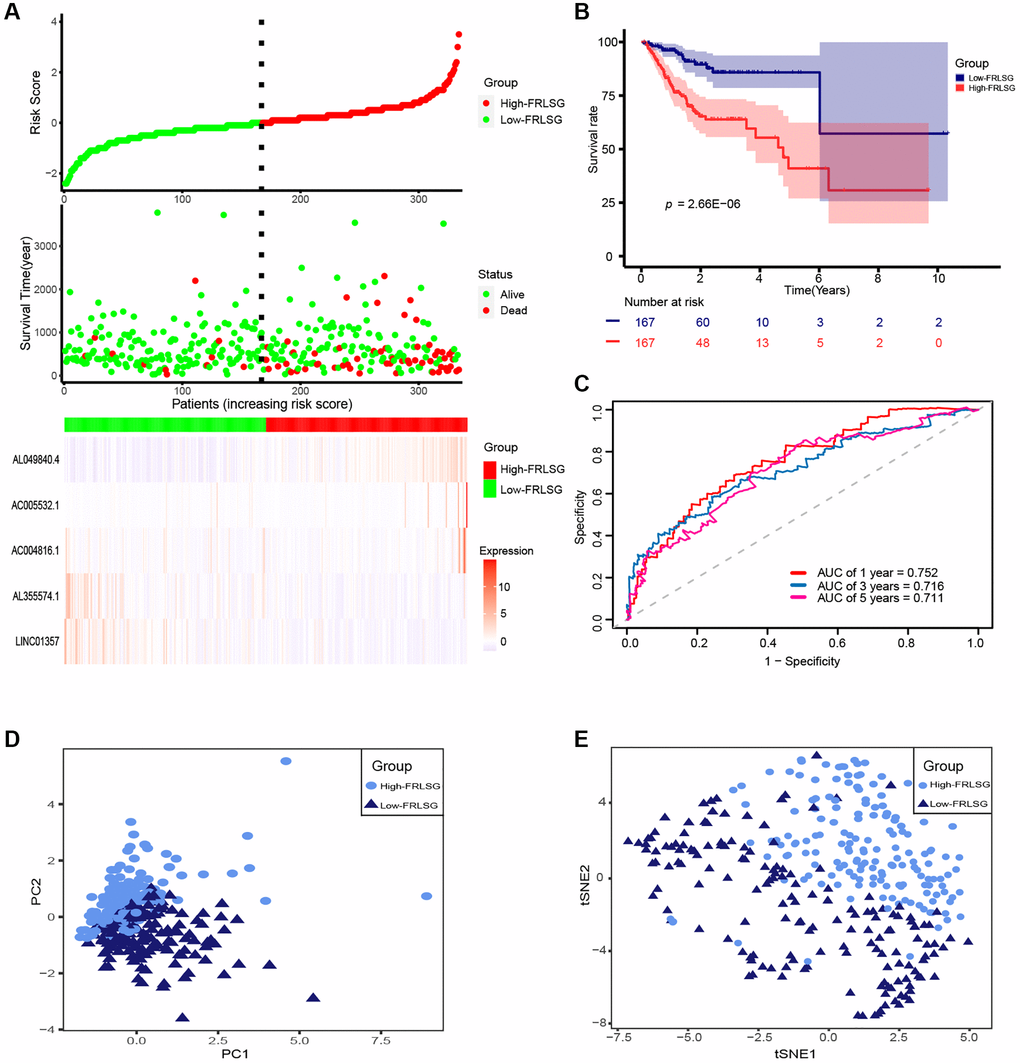
Figure 2.Evaluation of prognosis predicting power for FRLSG. (A) Risk survival status plot (FRLSG score distribution, scatter plots for survival status, and heatmap displaying the expression of 5 FRLs). (B) Kaplan-Meier curve showing the difference of prognosis between the high- and low-FRLSG groups. (C) ROC curves demonstrating the predicting power of FRLSG in predicting 1/3/5-year survival for GC patients. (D) PCA plot and (E) t-SNE plot for the clustering of GC patients based on 5 FRLs.