


Introduction
Glioma is the major type of the brain malignancy, its incidence rate and mortality continue to rise [1]. Gliomas are mainly comprised of low-grade gliomas (LGGs) and glioblastoma multiform (GBM). Although currently there are different treatments for glioma, the survival rate and prognosis of cancer patients is disappointing [2]. Therefore, identifying new biomarkers is crucial for the management of glioma.
RNA m6A modification is a regular mRNA modification, it was first identified in the 1970s [3]. Accumulating evidence demonstrated that YTHDF2, as a member of m6A reader protein, plays a crucial role in RNA metabolism and cancers progression [4]. For example, it has been confirmed that YTHDF2 was up-regulated in HCC and correlated with adverse clinical outcomes in patients [5]. However, there was no study on its expression level and immune roles in glioma.
In this study, we investigated the YTHDF2 expression among several dataset, including TCGA, CGGA and GEO. Moreover, we would study the YTHDF2 expression regulation. Finally, qRT-PCR and IHC assay were used to validate YTHDF2 expression in glioma cells lines and tissues. Loss of function used to determine the biological function of YTHDF2 in glioma progression.
Materials and Methods
Analysis of the expression and prognosis of YTHDF2
We employed the TCGA (https://www.cancer.gov/), GEO (https://www.ncbi.nlm.nih.gov/geo/query/acc.cgi), CGGA (http://www.cgga.org.cn/) [6], Rembrandt (http://gliovis.bioinfo.cnio.es/) [7] and Gravendeel (http://gliovis.bioinfo.cnio.es/) [8] to examine the expression pattern, clinical significance and prognosis of YTHDF2 in LGG.
GSEA analysis and immune cell infiltration analysis
In this study, we used GSEA software to explore the signaling pathway involved by YTHDF2 in glioma. TIMER (https://cistrome.shinyapps.io/timer/) [9]. TIMER was used to determine the relationship between YTHDF2 expression and immune cell infiltration in glioma.
DNA methylation analysis
MEXPRESS (https://mexpress.be/) is an online tool for DNA methylation database, In our study, we use the SMART (http://www.bioinfo-zs.com/smartapp/), EXPRESS (https://mexpress.be/), and MethSurv (https://biit.cs.ut.ee/methsurv/) databases to examine the relationship between the YTHDF2 expression and CNV, DNA methylation in LGG [10–12].
Drug sensitivity analysis
In this study, we used the GDSC and CTRP databases to explore the correlations between YTHDF2 and various drug sensitivity [13, 14].
Cell culture and real-time PCR
The glioma cell line was purchased from the cell bank of Kunming Institute of Zoology and cultured in DMEM medium (Corning, USA) supplemented with 10% fetal bovine serum (FBS) and 1% penicillin/streptomycin. The RT-PCR primers shown in the following, YTHDF2-F: AGCCCCACTTCCTACCAGATG, YTHDF2-R: TGAGAACTGTTATTTCCCCATGC; β-actin-F: CTTCGCGGGCGACGAT, β-actin-R: CCATAGGAATCCTTCTGACC. The expression quantification was obtained with the 2−ΔΔCt method. The shRNA primer used in this study following: shYTHDF2-1: CCTACTTACCCAGTTACTACA, shYTHDF2-2: GCTCTGGATATAGTAGCAATT.
Cell proliferation, cell migration and IHC assay
Cell proliferation, cell migration and IHC assay was performed as previously described [15]. Cell proliferation and cell migration assay used to determine the function of YTHDF2 on glioma cell migration and proliferation. IHC assay used to explore the expression level of YTHDF2 in glioma tissues.
Results
Expression and prognostic values of YTHDF2 in human cancers
To examine the expression pattern of YTHDF2 in pan-cancer, we used the TIMER database analysis it’s expression pattern, the result demonstrated that YTHDF2 was significantly over-expression in BLCA, CHOL, COAD, ESCA, HNSC, KICH, KIRP, KIRC, LIHC, LUAD, PRAD, SKCM, STAD, THCA and UCEC (Figure 1A). Similar to YTHDF2 mRNA, the protein level of YTHDF2 was highly in BRCA, COAD, OV, KIRC, and UCEC (Figure 1B). Moreover, we employ the CCLE databases to examine YTHDF2 expression in various cancer cells lines. Results suggested that YTHDF2 was elevated in different cancer cell lines (Figure 1C).
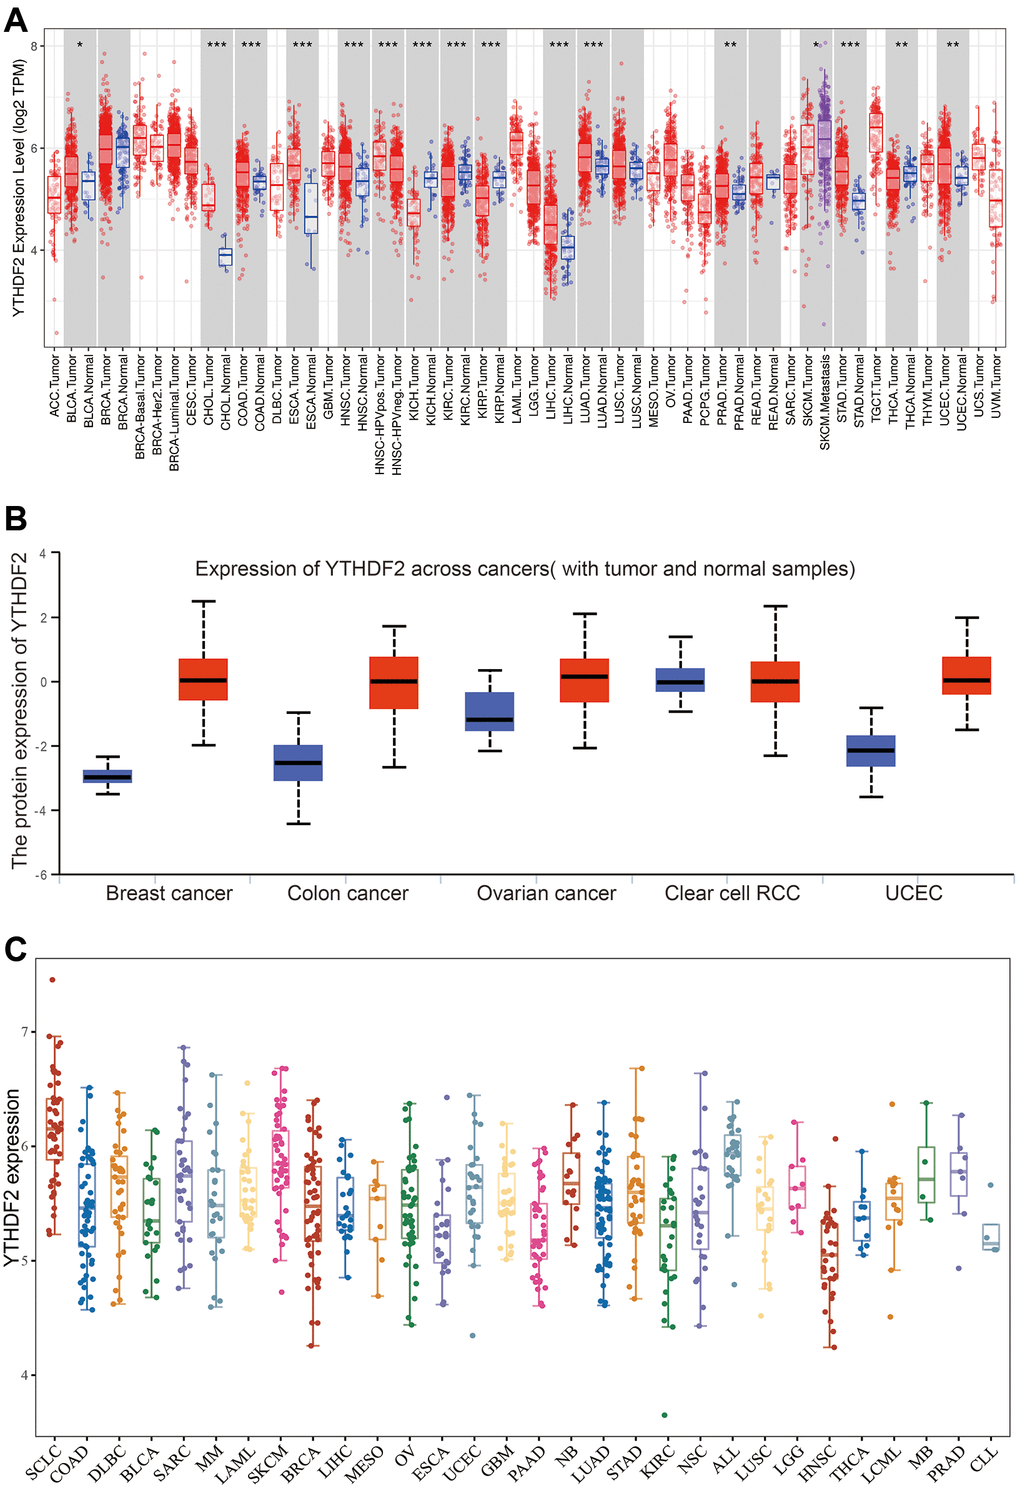
Figure 1. The expression of YTHDF2 in human cancer. (A) The expression of YTHDF2 in pan-cancer examine by TIMER database. (B) The protein level of YTHDF2 in diverse cancer examine by the UALCAN database. (C) The expression of YTHDF2 in diverse cancer cell lines examined by CCLE database.
We employed KM plot to explore the prognostic value of YTHDF2 expression in human cancer. Our results confirmed that higher level of YTHDF2 overexpression closely correlates to the poor clinical prognosis of LIHC, SARC, and LGG. On the contrary, up-regulation of YTHDF2 correlated with a better prognosis in BLCA, CESC, KIRC, LUAD, and OV (Figure 2).
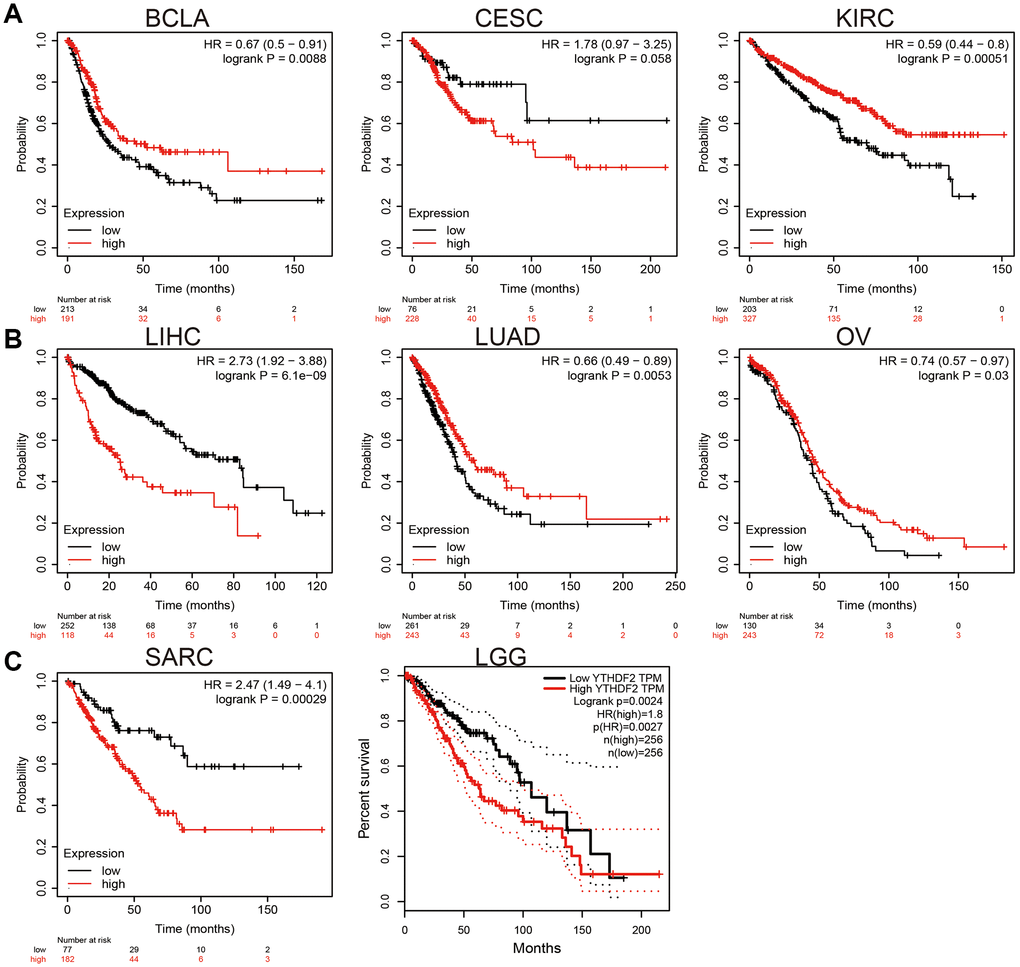
Figure 2. The prognosis value of YTHDF2 in human cancer. (A) The prognosis value of YTHDF2 in BLCA, CESC, and KIRC was examined by the km plot database. (B) The prognosis value of YTHDF2 in LIHC, LUAD, and OV was examined by the km plot database. (C) The prognosis value of YTHDF2 in SARC and LGG was examined by the km plot database.
YTHDF2 was up-regulated in LGG
To determine the expression of YTHDF2 in LGG, we adopt the public database to examine the expression of YTHDF2 in glioma tissues and normal group. Results found out that YTHDF2 was overexpressed in the LGG tissues (Figure 3A–3C). Similar results were also obtained from the diverse GEO datasets (Figure 3D–3F). Furthermore, the results demonstrated that the YTHDF2 protein level was increased in glioma tissues (Figure 3G). Collectively, these data indicate that YTHDF2 was up-regulated in glioma tissues and high expression of YTHDF2 was significantly correlated with the tumor grade of LGG.
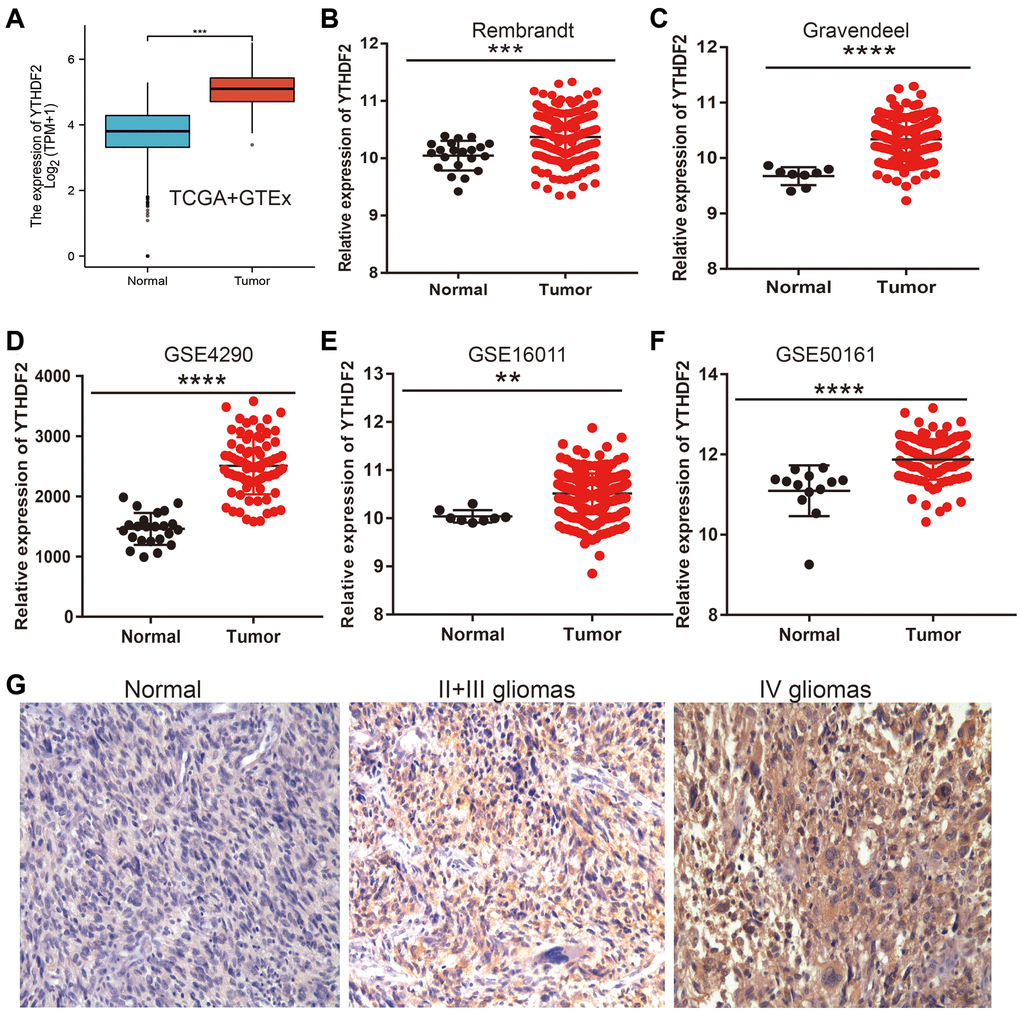
Figure 3. YTHDF2 was the high expression in LGG. (A–F) The YTHDF2 expression is significantly regulated in glioma examined by the TCGA (A), Rembrandt (B), Gravendeel (C), and GEO datasets (D–F). (G) The immunohistochemistry detection of YTHDF2 in Normal brain tissue, LGG, and HGG.
Relationship between YTHDF2 expression and clinical features
Next, we examine the relationship between YTHDF2 expression and clinical features in LGG. Results confirmed that YTHDF2 differential expression in different histology subtypes (Figure 4A). Additionally, the YTHDF2 expression level was increased with the tumor grade elevated (Figure 4B). We also found that YTHDF2 was markedly reduced in the IDH mutation group and the 1p/19q chromosome co-deletion group (Figure 4C, 4D). Interestingly, YTHDF2 was down-regulation in patients over 40 years old (Supplementary Figure 1A, 1B).
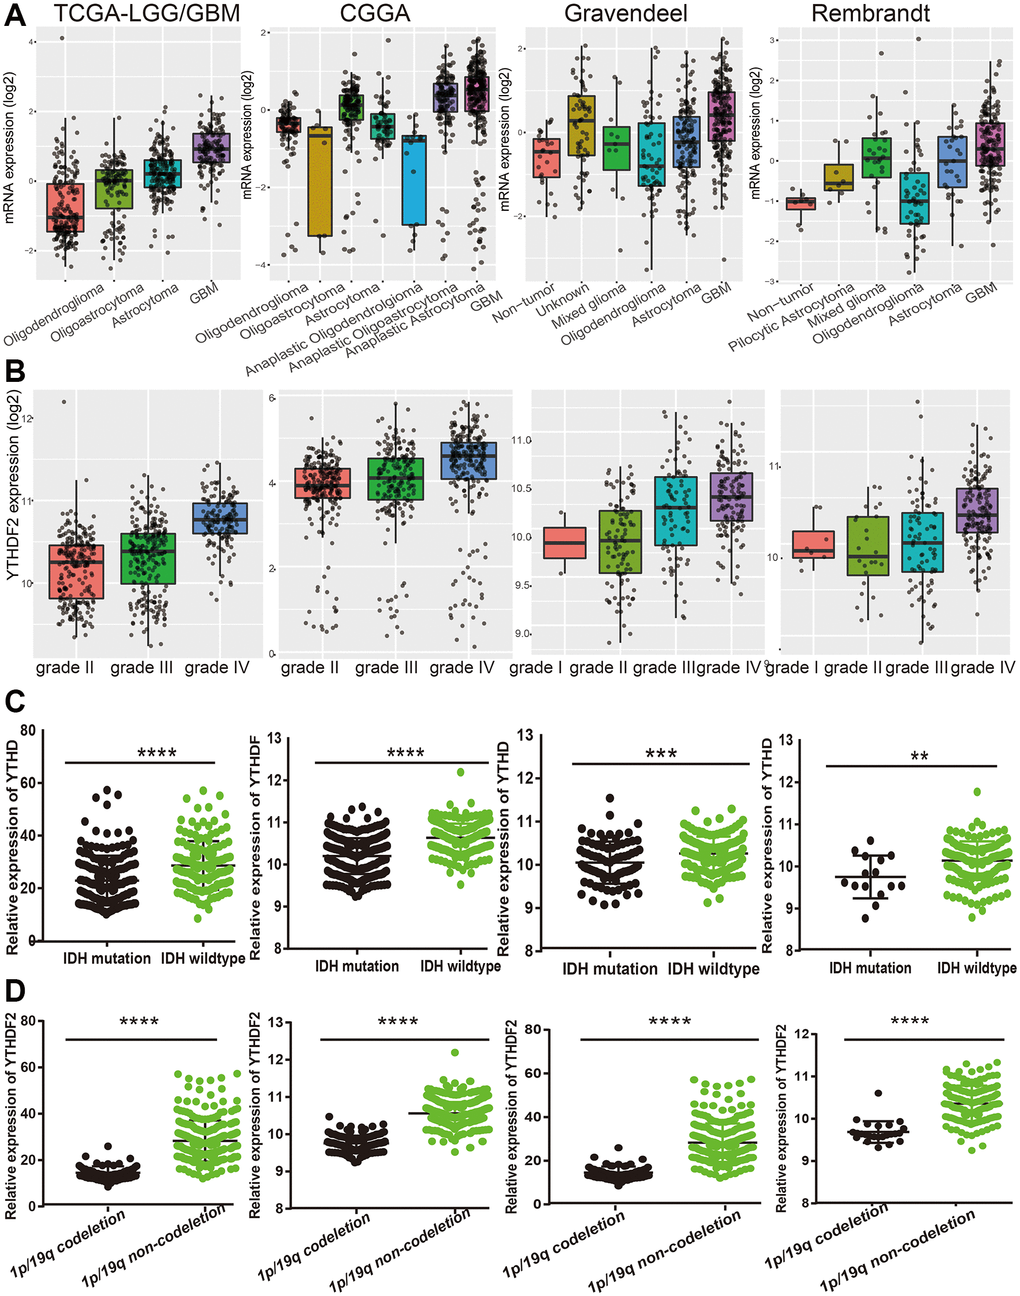
Figure 4. The correlation between the YTHDF2 expression and clinical information in LGG. (A) The expression of YTHDF2 in diverse histology of glioma based on TCGA, CGGA, Rembrandt, and Gravendeel databases. (B) The expression of YTHDF2 in diverse tumor grades of glioma based on TCGA, CGGA, Rembrandt, and Gravendeel databases. (C) The expression of YTHDF2 in diverse IDH mutations of glioma based on TCGA, CGGA, Rembrandt, and Gravendeel databases. (D) The expression of YTHDF2 in diverse 1p/19q codeletion of glioma based on TCGA, CGGA, Rembrandt, and Gravendeel databases.
Prognostic value of YTHDF2
We found that up-regulation of YTHDF2 was correlated with the unfavorable prognosis of glioma patients in different datasets (Figure 5A–5F). Additionally, we perform the ROC curves analysis showed that the area under the curve (AUC) of YTHDF2 were 0.773, 0.815, and 0.789 for the TCGA-LGG datasets (Figure 5G), 0.797, 0.832, and 0.702 for the CGGA datasets (Figure 5H) in 1, 3, and 5 years, respectively. In GBM, the overall of patients no significant difference between high and low YTHDF2 group (Figure 5I). ROC curve of YTHDF2 show an AUC value of 0.982 and 0.931 based on the TCGA-GBM and TCGA-LGG dataset (Figure 5J).
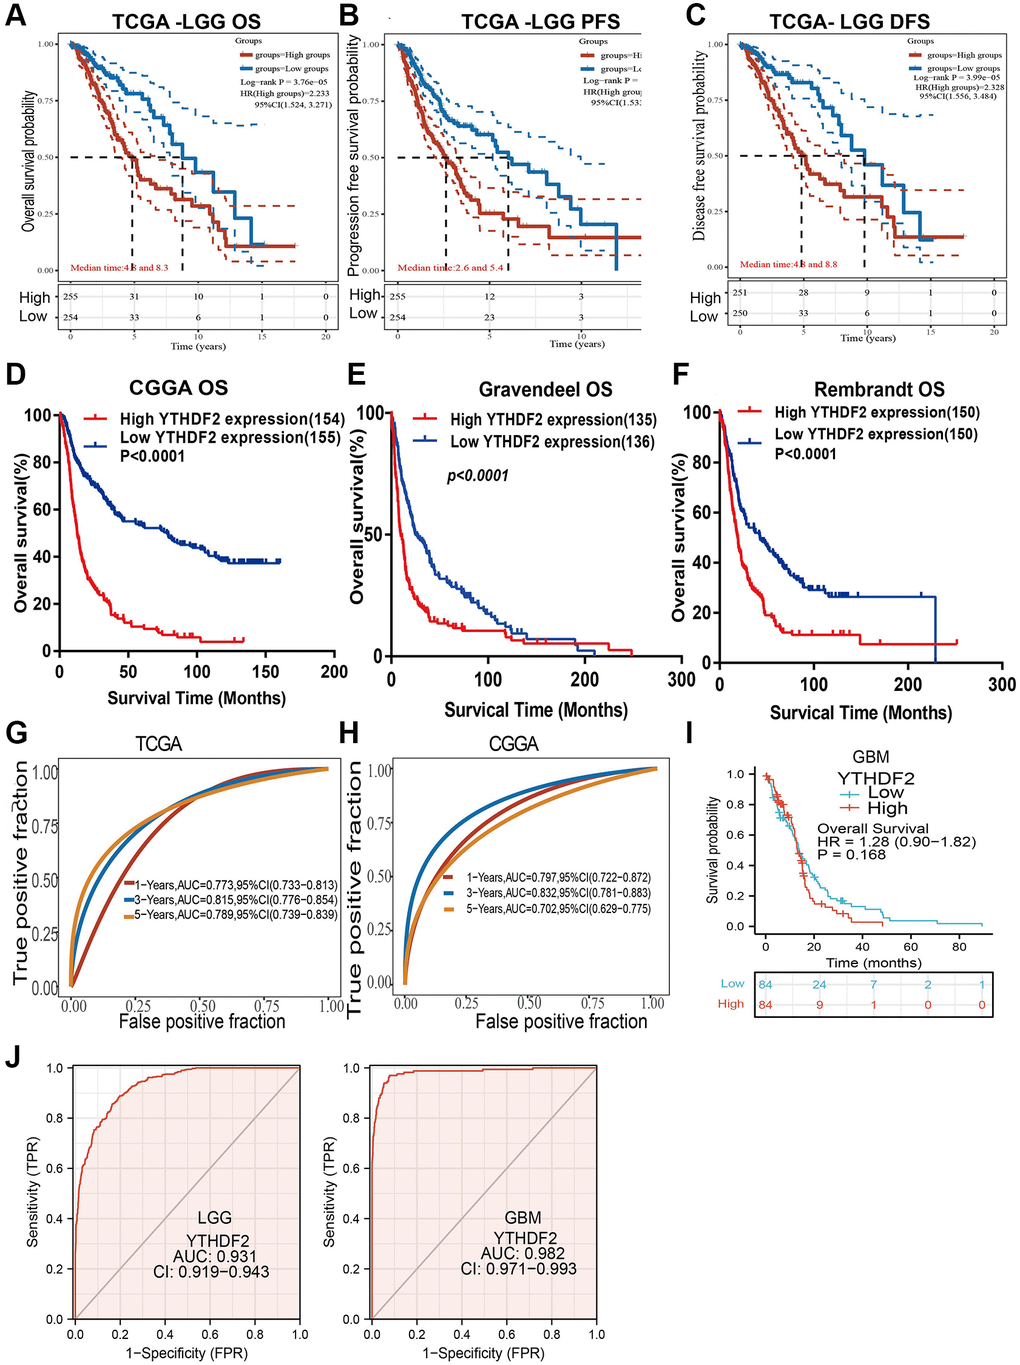
Figure 5. The prognosis of YTHDF2 in LGG. (A–F) The prognosis of YTHDF2 in LGG was examined by TCGA, CGGA, Rembrandt, and Gravendeel databases. (G, H) ROC analyses revealed the predictive value of YTHDF2 in glioma based on TCGA-LGG, CGGA, and TCGA-GBM. (I) The prognostic value of YTHDF2 in GBM. (J) The diagnostic value of YTHDF2 in GBM and LGG.
DNA methylation analysis
DNA methylation plays a crucial role in the regulation of gene expression. To elucidate the abnormal up-regulated mechanisms of YTHDF2 in LGG tissues, we further examine the relationship between DNA methylation, CNV, and the expression of YTHDF2 in gliomas. Firstly, we found that CNV of YTHDF2 was positively correlated with the expression (r = 0.798, p < 0.0001) (Figure 6A). Furthermore, we confirmed that various methylation sites in the promoter region of YTHDF2, among these methylation sites, the cg28734000 was negative correlated with the expression of YTHDF2 in LGG (r = 0.–0.556, p < 0.0001). CGGA dataset also obtained same results (Figure 6B, 6C). 5-Azacytidine, as an inhibitor of DNA methyltransferase [16], was used to treat the U251 cells, the results show that inhibiting the DNA methylation could significantly enhance YTHDF2 RNA levels in U251 cells (Figure 6D). Finally, we uncovered that lower methylation levels on the cg28734000 site correlate with adverse clinical outcomes in the TCGA-LGG dataset examined by the measure database (Figure 6E).
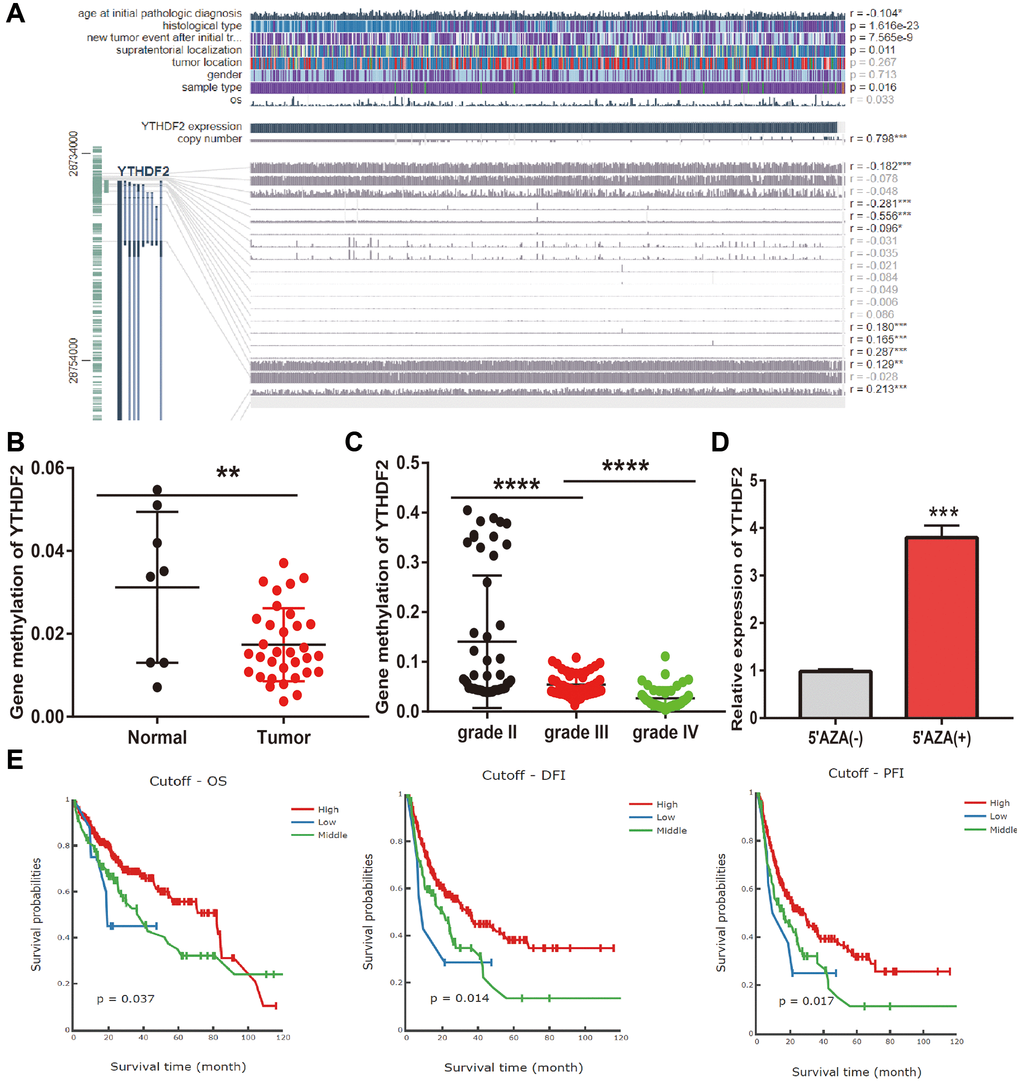
Figure 6. Analysis of the YTHDF2 methylation level. (A) The correlation between CNV, DNA methylation, and YTHDF2 expression is examined by EXPRESS. (B) The DNA methylation level of YTHDF2 in LGG. (C) The DNA methylation level of YTHDF2 in diverse tumor grades of LGG based on CGGA dataset. (D) The expression of YTHDF2 in U251 cells after using 5-AZA treatment was examined by qRT-PCR assay. (E) The prognosis for the methylation level of YTHDF2 in the TCGA-LGG dataset.
YY1 activates YTHDF2 expression in glioma cells
In order to determine the aberrant up-regulation of YTHDF2 in LGG, we employed JASPAR, Knock TF, and PROMO algorithms” to predict the potential transcription factors that may bind to YTHDF2 promoters. The results found that there are 4 common transcription factors in both prediction results, including the STAT3, JUN, MAF, and YY1. Then, we used the GEPIA database to analyze the correlation between these transcription factors and YTHDF2 expression in glioma samples based on the TCGA and CGGA dataset and found that only YY1 was positively associated with YTHDF2 expression. We also found that among these transcription factors, only YY1 was up-regulated in LGG specimens (Figure 7A). Elevated YY1 expression related to poor OS in TCGA-LGG (Figure 7B). Additionally, we found that YY1 expression was significantly increased in diverse WHO grade (p = 0.0006), (Figure 7C), and histology (p = 0.02, Figure 7D). ROC curve analysis of YY1 showed an AUC value of 0.843 in LGG patients (Figure 7E). By analyzing the TCGA LGG and CGGA datasets, we found that YY1 was strongly correlated with YTHDF2 expression (Figure 7F, 7G). Finally, to validate the above results, we performed the qRT-PCR assay, we found out that knock-down of YY1 was markedly reduced the YTHDF2 levels in U251 cells (Figure 7H). These results confirmed that YY1 can increase YTHDF2 expression via modulating the transcription process of YTHDF2 in glioma cells.
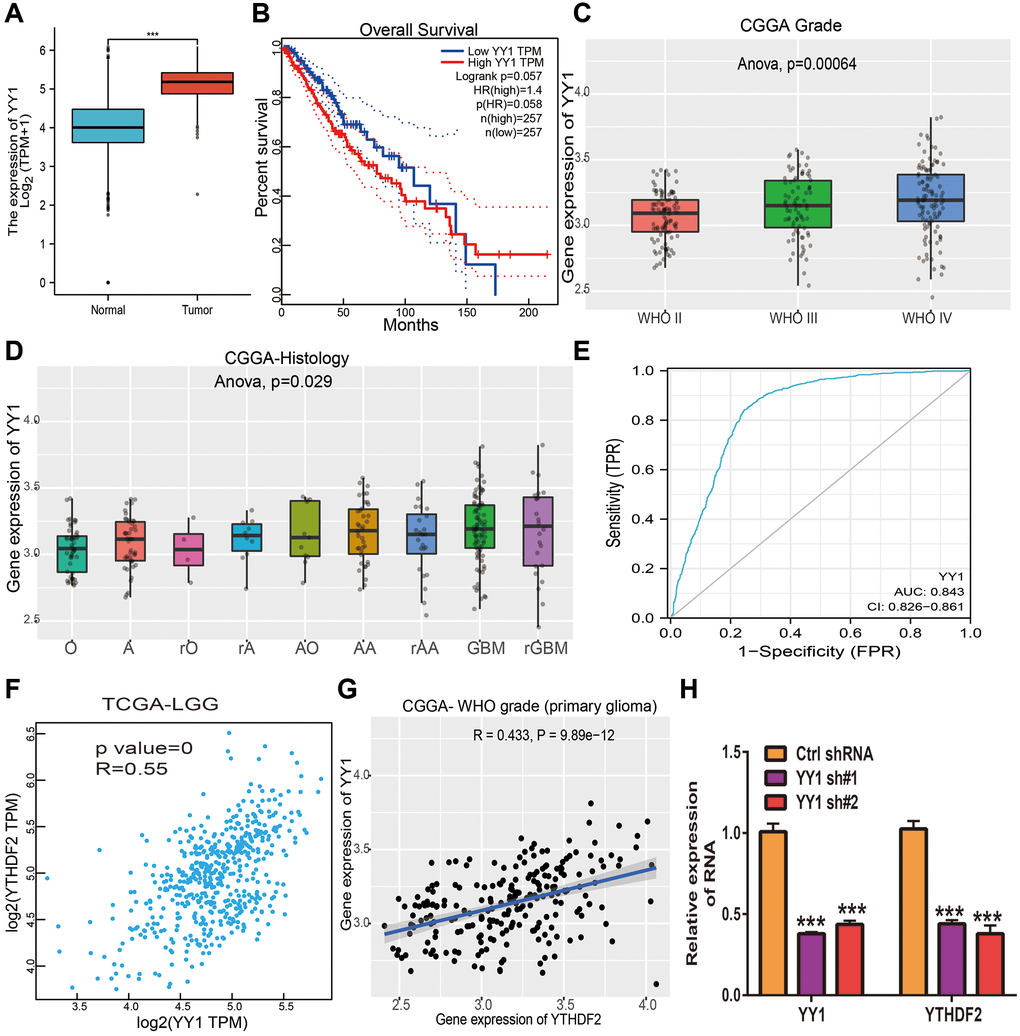
Figure 7. YY1 activates YTHDF2 expression in glioma cells. (A) The expression of YY1in LGG tissues and normal tissues. (B) The prognosis of YY1 in TCGA-LGG was examined by GEPIA. (C) The expression of YY1 in diverse tumor grades of LGG examined by CGGA databases. (D) The expression of YY1 in diverse histology of in CGGA-LGG databases. (E) The ROC curve value of YY1 in TCGA-LGG. (F) YY1 expression was strongly positively associated with YTHDF1 expression in TCGA-LGG examined by GEPIA. (G) YY1 expression was strongly positively associated with YTHDF1 expression in LGG examined by CGGA. (H) The expression of YTHDF2 in U251 cells upon depletion of YY1 was examined by qRT-PCR assay.
GSEA analysis
To determine the signaling pathway affected by YTHDF2 in LGG, we performed the GSEA enriched analysis using the GSEA software, results showed that YTHDF2 was mainly involved in the cell cycle, Focal adhesion, Wnt signal pathway, JAK- STAT3-signal pathway (Figure 8).
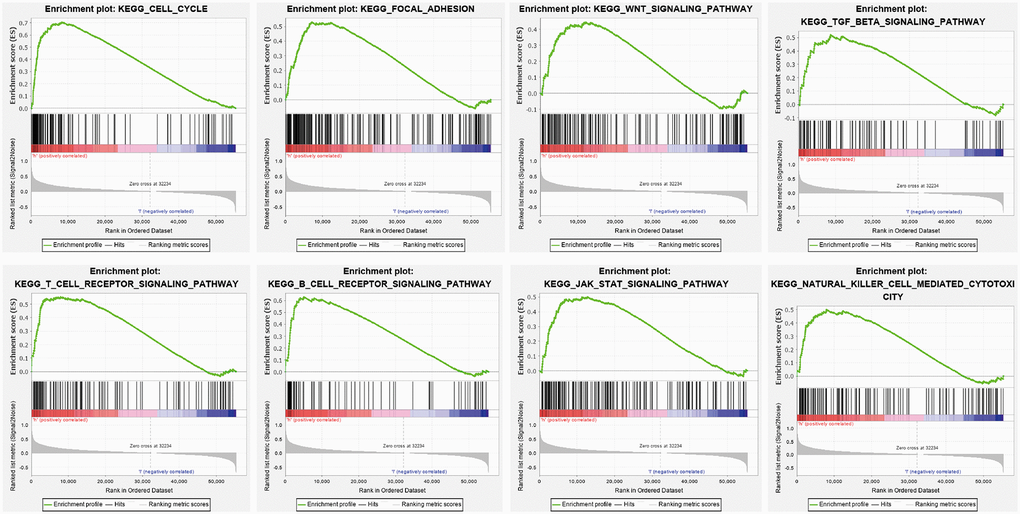
Figure 8. KEGG signaling pathway explored by GSEA software. The Cell Cycle, Focal adhesion, Wnt signal pathway JAK- STAT3- signal pathway, T cell receptor signal pathway, and B cell receptor signal pathway in LGG were examined by GSEA software.
Association between YTHDF2 expression and immune cell infiltration
Firstly, we analysis the immune infiltration levels based on the different tumor grade, the result demonstrated that different immune infiltration levels observed in the different grade tumor samples (Figure 9A). Furthermore, we found that CNV of YTHDF2 was markedly affect the immune infiltration levels of different immune (Figure 9B). Finally, we found that YTHDF2 was markedly correlated with B cells (cor = 0.577, P = 7.52e-44), CD8+ T cell (cor = 0.382, P = 5.17e-18), CD4+ T cells (cor = 0.373, P = 4.00e-17), macrophages (cor = 0.369 P = 1.06e-16), neutrophils (cor = 0.513, P = 2.68e-33), and dendritic cells (cor = 0.51, P = 7.25e-33) (Figure 9C). We also uncovered that YTHDF2 was positive correlated with the abundances of Th2 cells, T helper cells Tgd, Eosinophils Macrophages, and Neutrophils, negatively associated with the abundances of DCNK, CD56bright cells, and pDC in LGG (Supplementary Figure 1C). In GBM dataset, YTHDF2 was positive correlated with the abundances of Th2 cells, T helper cells, Tgd, and NK cells, negatively associated with the abundances of T cells, DC Macrophages, DC, Neutrophils, and Cytotoxic cells (Supplementary Figure 1D). The Cox model confirmed that B cells and YTHDF2 were significantly related to the poor OS in LGG patients (Figure 9D).
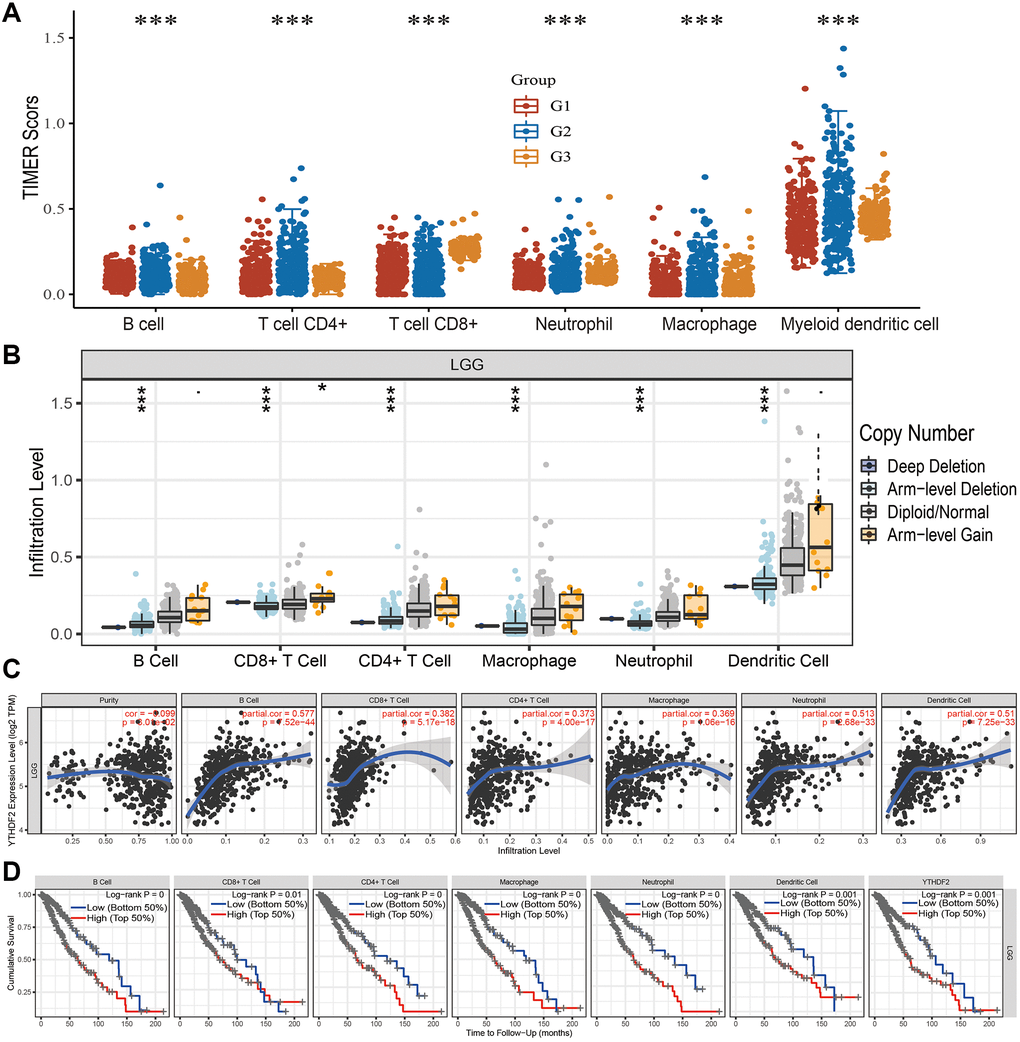
Figure 9. Analysis of the correlation between YTHDF2 expression and diverse immune cell infiltration. (A) The level of diverse immune infiltration in different tumor grades of LGG. (B) The correlation between YTHDF2 expression and somatic copy number alterations. (C) The correlation between YTHDF2 expression and diverse immune cell infiltration. (D) The B cells, CD4+ T cells, CD8+ T cells, dendritic cells, Macrophages, and Neutrophils are correlated with the cumulative survival rate in LGG.
We analyzed the immune checkpoints related gene expression distribution in WHO grade II, III and IV gliomas tissues, the result demonstrated that immune checkpoints related gene differential expression in diverse samples (Figure 10A). In addition, we also analyzed the relationship between expression of YTHDF2 and immune checkpoint-related genes by Pearson correlation analysis in LGGs. Result shown that YTHDF2 expression was significantly positively correlated with CD274 (cor = 0.456, P = 6.65e-28), CTLA4 (cor = 0.464, P = 5.74e-29), HAVCR2 (cor = 0.445, P = 1.9e-26), LAG3 (cor = 0.262, P = 1.59e-09), PDCD1 (cor = 0.594, P = 1.49e-50), PDCD1LG12 (cor = 0.524, P = 8.48e-38), TIGIT (cor = 0.365, P = 9.87e-18), SIGLEC15 (cor = 0.203, P = 3.27e-06) (Figure 10B).
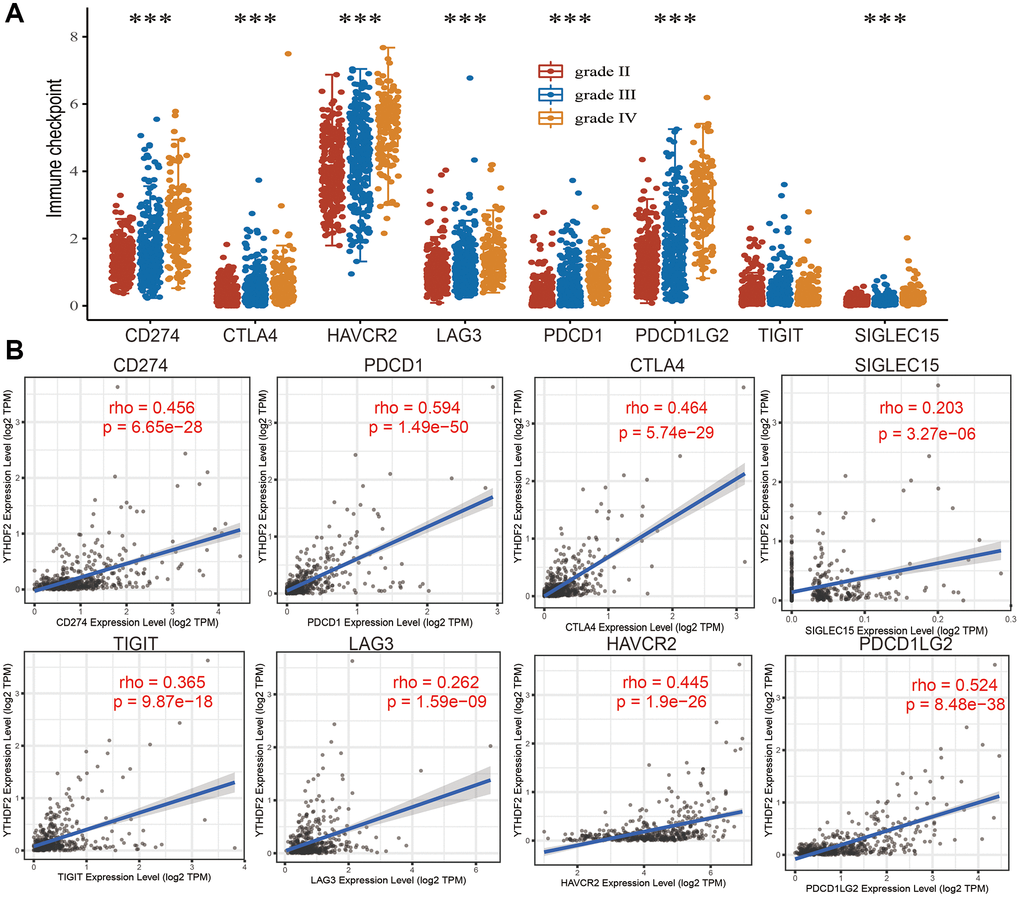
Figure 10. The association between YTHDF2 expression and immune checkpoints. (A) The expression of immune checkpoints-related genes is different from the WHO grade of LGG. (B) The correlations between YTHDF2 expression and diverse immune checkpoints related genes were examined by the TIMER database.
Drug sensitivity analysis
Given that YTHDF2 has a potential driving effect on the progression of LGG, we used the GSCA tools to analyze the relationship between the YTHDF2 expression and drug sensitivity. Results indicated that YTHDF2 expression positive correlated with the drug sensitivity of XAV939, 17-AAG, Cetuximab, TGX221, Erlotinib, and Trametinib (r > 0.16, p < 0.0001), negative related to the drug sensitivity of NPK76-II-72-1, THZ-2-102-1, PHA-793887, WZ3105, YM201636, GSK1070916, Tubastatin A, I-BET-762, KIN001-102, AT-7519, PIK-93, TPCA-1, BX-912 and UNC0638 in GDSC and CTRP database (r < −0.25, p < 0.0001) (Figure 11A, 11B and Tables 3, 4).
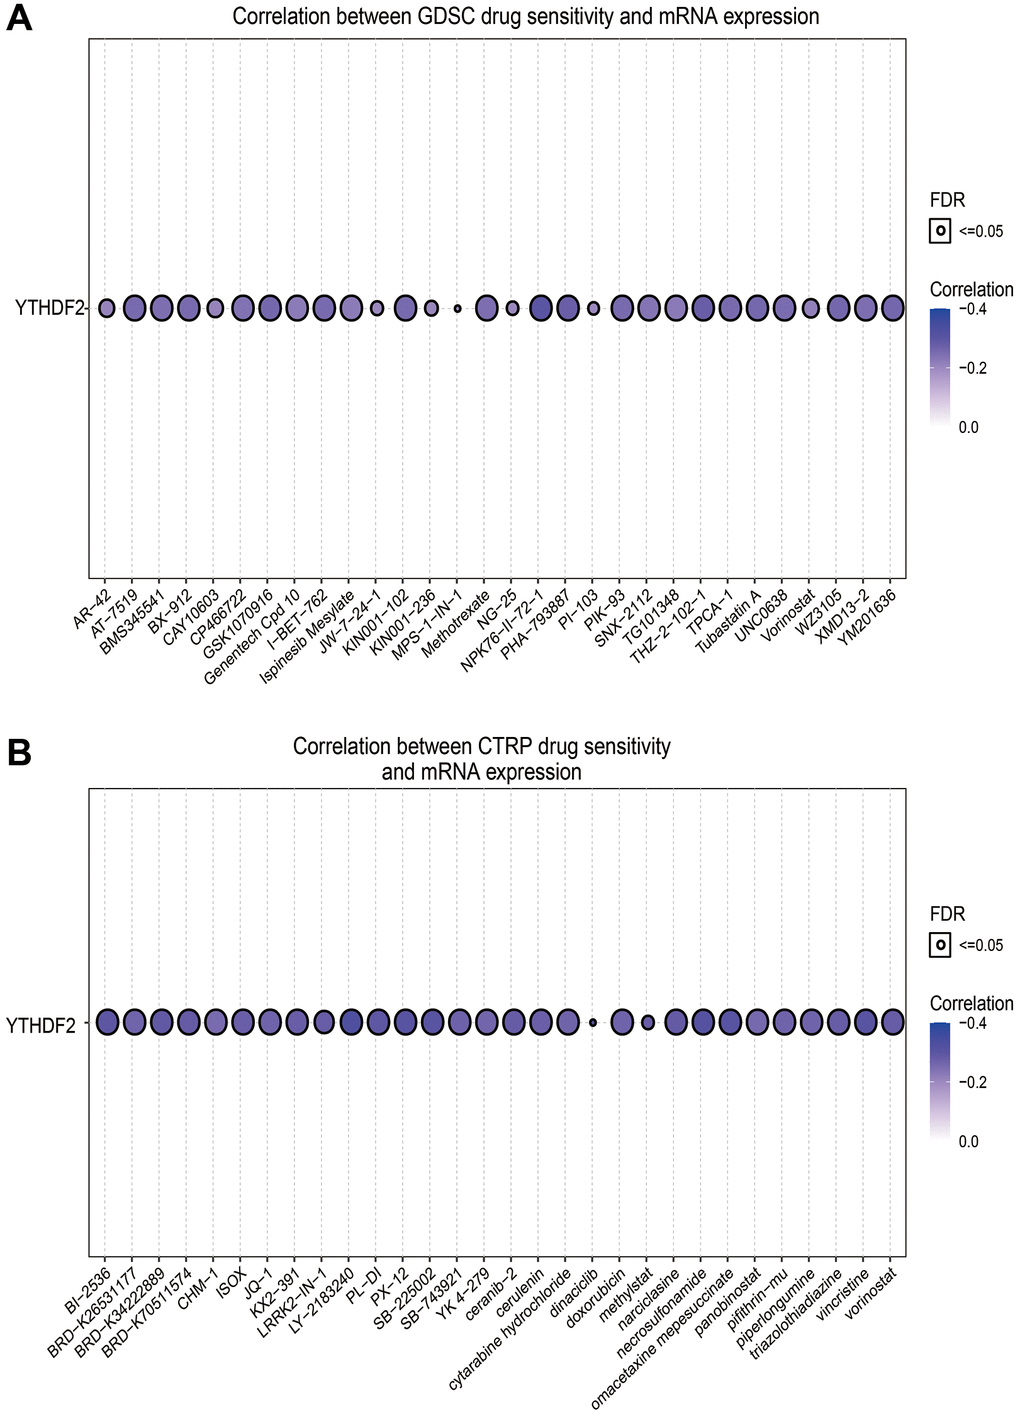
Figure 11. The correlation between YTHDF2 expression and drug sensitivity in LGG. (A) The correlation between the YTHDF2 expression and drug sensitivity was examined by the GDSC database. (B) The correlation between the YTHDF2 expression and drug sensitivity was examined by the CTRP database.
Table 3. Analysis the correlation between YTHDF2 expression and diverse drug sensitivity by using GDSC database.
| Symbol | Drug | Cor | Fdr |
| YTHDF2 | NPK76-II-72-1 | −0.30021 | 1.36E-19 |
| YTHDF2 | THZ-2-102-1 | −0.27868 | 2.81E-16 |
| YTHDF2 | PHA-793887 | −0.2772 | 1.13E-16 |
| YTHDF2 | WZ3105 | −0.26037 | 1.35E-14 |
| YTHDF2 | YM201636 | −0.25939 | 4E-14 |
| YTHDF2 | GSK1070916 | −0.25896 | 4.85E-14 |
| YTHDF2 | Tubastatin A | −0.25819 | 2.48E-14 |
| YTHDF2 | I-BET-762 | −0.25474 | 3.33E-14 |
| YTHDF2 | KIN001-102 | −0.25473 | 5.14E-14 |
| YTHDF2 | AT-7519 | −0.25449 | 6.2E-14 |
| YTHDF2 | PIK-93 | −0.25431 | 4.41E-14 |
| YTHDF2 | TPCA-1 | −0.25414 | 4.74E-14 |
| YTHDF2 | BX-912 | −0.25382 | 5.31E-14 |
| YTHDF2 | UNC0638 | −0.25122 | 3.67E-14 |
| YTHDF2 | XAV939 | 0.188419 | 2.23E-07 |
| YTHDF2 | 17-AAG | 0.184788 | 2.74E-07 |
| YTHDF2 | Cetuximab | 0.172627 | 3.9E-06 |
| YTHDF2 | TGX221 | 0.172132 | 0.003902 |
| YTHDF2 | Erlotinib | 0.167506 | 0.011063 |
| YTHDF2 | Trametinib | 0.160217 | 6.33E-06 |
Table 4. Analysis the correlation between YTHDF2 expression and diverse drug sensitivity by using CTRP database.
| Symbol | Drug | Cor | Fdr |
| YTHDF2 | GSK-J4 | −0.40462 | 0.004391 |
| YTHDF2 | LY-2183240 | −0.32709 | 1.16E-19 |
| YTHDF2 | dinaciclib | −0.32552 | 1.24E-09 |
| YTHDF2 | necrosulfonamide | −0.31263 | 2.45E-12 |
| YTHDF2 | BRD-K30748066 | −0.31086 | 0.057866 |
| YTHDF2 | omacetaxine mepesuccinate | −0.30419 | 2.43E-12 |
| YTHDF2 | PX-12 | −0.30395 | 1.07E-16 |
| YTHDF2 | vincristine | −0.30344 | 1.03E-17 |
| YTHDF2 | SB-225002 | −0.3032 | 2.88E-17 |
| YTHDF2 | tivantinib | −0.29689 | 3.47E-08 |
| YTHDF2 | BI-2536 | −0.29528 | 1.56E-16 |
| YTHDF2 | PL-DI | −0.29412 | 1.38E-15 |
| YTHDF2 | BRD-K34222889 | −0.28871 | 2.71E-15 |
| YTHDF2 | narciclasine | −0.28509 | 1.41E-14 |
| YTHDF2 | BRD-K70511574 | −0.28292 | 1.24E-14 |
| YTHDF2 | ceranib-2 | −0.28174 | 6.94E-15 |
| YTHDF2 | vorinostat | −0.28052 | 2.52E-14 |
| YTHDF2 | triazolothiadiazine | −0.28049 | 6.15E-15 |
| YTHDF2 | dasatinib | 0.18171 | 7.07E-06 |
| YTHDF2 | saracatinib | 0.179659 | 1.13E-05 |
| YTHDF2 | VAF-347 | 0.13649 | 0.018721 |
| YTHDF2 | abiraterone | 0.101956 | 0.445064 |
Knock down of YTHDF2 inhibited cell proliferation and migration
To examine the function of YTHDF2 in LGG, we used the qRT-PCR assay to detect the YTHDF2 expression in glioma cell lines. The results show that YTHDF2 was the high expression in glioma cell lines, especially in U251cells (Figure 12A). Owing to the higher expression of YTHDF2 in glioma cell lines, we construction the YTHDF2 knockdown cells and using the qRT-PCR assay verify the knockdown efficiency (Figure 12B). By performing the loss of function for YTHDF2 in U251cell, we found that YTHDF2 knock down was significantly inhibited the cell proliferation of U251 cells by growth curve assay (Figure 12C). Additionally, the decreased migration ability of U251 cells was observed in the knockdown of YTHDF2 (Figure 12D, 12E). We also uncover that YTHDF2 was strongly correlated with Ki-67 expression (r = 0.617, P = 4.21e-25) and vimentin (r = 0.705, P = 2.42e-35) (Figure 12F).
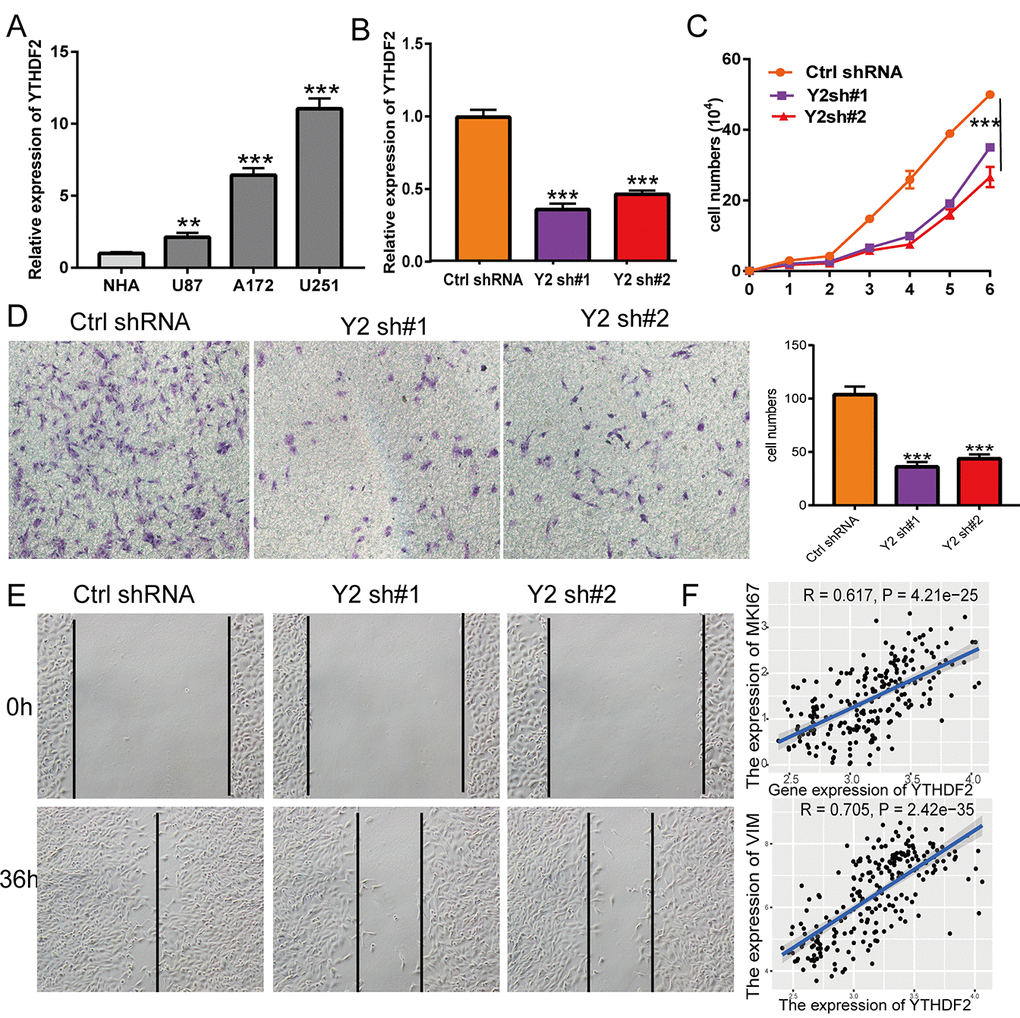
Figure 12. Depletion of YTHDF2 inhibits GBM cell proliferation and migration. (A) The expression of YTHDF2 in normal human astrocytes cells (NHA) and GBM cell lines (U87, A172, and U251). (B) The YTHDF2 knockdown efficiency in U251 was verified by qRT-PCR assay. (C) YTHDF2 knockdown significantly inhibited U251 cell proliferation examined by growth curve assay. (D) YTHDF2 knockdown significantly inhibited U251 cell migration examined by transwell assay. (E) YTHDF2 knockdown significantly inhibited U251 cell migration examined by wound healing assay. (F) Pearson correlation analysis the correlation between YTHDF2 and MKI67, VIM expression in TCGA LGG.
Discussion
YTHDF2, a member of the m6A reader proteins containing the YT521-B homology (YTH) domain family, has been reported to play important roles in cancer progression. We found that YTHDF2 expression was up-regulated in glioma and its high expression was correlated with the tumor grade and poor prognosis in LGG. ROC curve confirmed that the YTHDF2 expression level has diagnostic value for gliomas.
Our KEGG pathway analysis shows that YTHDF2 expression was highly correlated with immune response and oncogenic signaling pathway. DNA methylation and transcription factor were reported that play an essential role in regulating gene expression.
Here we found that YTHDF2 expression was strongly negatively correlated with DNA methylation, and we use 5-aza-2’-deoxycytidine can restore YTHDF2 expression. Therefore, DNA hypomethylation may be a cause for YTHDF2 upregulated in LGG. At the transcription level, YY1 could increase the expression of YTHDF2 by modulating the transcription process of YTHDF2.
Previous study confirmed that YTHDF2 was crucial for maintain the stability of RNA. In this study, we confirmed that YTHDF2 was mainly involved in the cell cycle, Focal adhesion, Wnt signal pathway, JAK- STAT3-signal pathway.
Mounting evidence has demonstrated that the TME plays an important role in glioma progression [17]. Here we found that a strong positive relationships between YTHDF2 expression level and various immune cell infiltration. We also investigated the correlations between YTHDF2 expression and immune checkpoint. YTHDF2 levels demonstrated strong correlations with multiple immune checkpoint molecules, such as CD274 and CTLA4.
Finally, we found that YTHDF2 was highly expressed in GBM cells, depletion of YTHDF2 was significantly inhibited the cell proliferation and migration of GBM cells, the IHC assay also demonstrated that YTHDF2 was up-regulation in LGG and correlated with tumor grade.
Supplementary Materials
Author Contributions
Xi Chen, Xiulin Jiang and Xiaobin Huang designed this work and performed related assay. Chunyan Wang, Chenyang Wang, Chenglong Pan, William C. Cho and Zhi Nie analyzed data. Jun Pu and Weixiang Wang supervised the study and wrote the manuscript. All authors have read and approved the final version of the manuscript.
Acknowledgments
The authors would like to thank support from The First Affiliated Hospital of Kunming Medical University, Kunming, China.
Conflicts of Interest
The authors declare no conflicts of interest related to this study.
Funding
This work supported by the National Nature Science Foundation of China (82160512) and Yunnan Applied Basic Research Projects (2017FE467 and 2018FE001). Kunming Municipal Health Commission Health Research Projects (2020-04-04-113). The authors would like to thank the support from the department of Neurosurgery, The Second Affiliated Hospital of Kunming Medical University, Kunming, 650223, China.
Editorial Note
This corresponding author has a verified history of publications using a personal email address for correspondence.
References
- 1. Miller JJ, Shih HA, Andronesi OC, Cahill DP. Isocitrate dehydrogenase-mutant glioma: Evolving clinical and therapeutic implications. Cancer. 2017; 123:4535–46. https://doi.org/10.1002/cncr.31039 [PubMed]
- 2. Ludwig K, Kornblum HI. Molecular markers in glioma. J Neurooncol. 2017; 134:505–12. https://doi.org/10.1007/s11060-017-2379-y [PubMed]
- 3. Adams JM, Cory S. Modified nucleosides and bizarre 5'-termini in mouse myeloma mRNA. Nature. 1975; 255:28–33. https://doi.org/10.1038/255028a0 [PubMed]
- 4. Zhang C, Huang S, Zhuang H, Ruan S, Zhou Z, Huang K, Ji F, Ma Z, Hou B, He X. YTHDF2 promotes the liver cancer stem cell phenotype and cancer metastasis by regulating OCT4 expression via m6A RNA methylation. Oncogene. 2020; 39:4507–18. https://doi.org/10.1038/s41388-020-1303-7 [PubMed]
- 5. Hou J, Zhang H, Liu J, Zhao Z, Wang J, Lu Z, Hu B, Zhou J, Zhao Z, Feng M, Zhang H, Shen B, Huang X, et al. YTHDF2 reduction fuels inflammation and vascular abnormalization in hepatocellular carcinoma. Mol Cancer. 2019; 18:163. https://doi.org/10.1186/s12943-019-1082-3 [PubMed]
- 6. Wang Y, Qian T, You G, Peng X, Chen C, You Y, Yao K, Wu C, Ma J, Sha Z, Wang S, Jiang T. Localizing seizure-susceptible brain regions associated with low-grade gliomas using voxel-based lesion-symptom mapping. Neuro Oncol. 2015; 17:282–8. https://doi.org/10.1093/neuonc/nou130 [PubMed]
- 7. Gusev Y, Bhuvaneshwar K, Song L, Zenklusen JC, Fine H, Madhavan S. The REMBRANDT study, a large collection of genomic data from brain cancer patients. Sci Data. 2018; 5:180158. https://doi.org/10.1038/sdata.2018.158 [PubMed]
- 8. Bowman RL, Wang Q, Carro A, Verhaak RG, Squatrito M. GlioVis data portal for visualization and analysis of brain tumor expression datasets. Neuro Oncol. 2017; 19:139–41. https://doi.org/10.1093/neuonc/now247 [PubMed]
- 9. Li T, Fan J, Wang B, Traugh N, Chen Q, Liu JS, Li B, Liu XS. TIMER: A Web Server for Comprehensive Analysis of Tumor-Infiltrating Immune Cells. Cancer Res. 2017; 77:e108–10. https://doi.org/10.1158/0008-5472.CAN-17-0307 [PubMed]
- 10. Li Y, Ge D, Lu C. The SMART App: an interactive web application for comprehensive DNA methylation analysis and visualization. Epigenetics Chromatin. 2019; 12:71. https://doi.org/10.1186/s13072-019-0316-3 [PubMed]
- 11. Koch A, De Meyer T, Jeschke J, Van Criekinge W. MEXPRESS: visualizing expression, DNA methylation and clinical TCGA data. BMC Genomics. 2015; 16:636. https://doi.org/10.1186/s12864-015-1847-z [PubMed]
- 12. Modhukur V, Iljasenko T, Metsalu T, Lokk K, Laisk-Podar T, Vilo J. MethSurv: a web tool to perform multivariable survival analysis using DNA methylation data. Epigenomics. 2018; 10:277–88. https://doi.org/10.2217/epi-2017-0118 [PubMed]
- 13. Yang W, Soares J, Greninger P, Edelman EJ, Lightfoot H, Forbes S, Bindal N, Beare D, Smith JA, Thompson IR, Ramaswamy S, Futreal PA, Haber DA, et al. Genomics of Drug Sensitivity in Cancer (GDSC): a resource for therapeutic biomarker discovery in cancer cells. Nucleic Acids Res. 2013; 41:D955–61. https://doi.org/10.1093/nar/gks1111 [PubMed]
- 14. Basu A, Bodycombe NE, Cheah JH, Price EV, Liu K, Schaefer GI, Ebright RY, Stewart ML, Ito D, Wang S, Bracha AL, Liefeld T, Wawer M, et al. An interactive resource to identify cancer genetic and lineage dependencies targeted by small molecules. Cell. 2013; 154:1151–61. https://doi.org/10.1016/j.cell.2013.08.003 [PubMed]
- 15. Yuan Y, Jiang X, Tang L, Wang J, Zhang D, Cho WC, Duan L. FOXM1/lncRNA TYMSOS/miR-214-3p-Mediated High Expression of NCAPG Correlates With Poor Prognosis and Cell Proliferation in Non-Small Cell Lung Carcinoma. Front Mol Biosci. 2022; 8:785767. https://doi.org/10.3389/fmolb.2021.785767 [PubMed]
- 16. Christman JK. 5-Azacytidine and 5-aza-2'-deoxycytidine as inhibitors of DNA methylation: mechanistic studies and their implications for cancer therapy. Oncogene. 2002; 21:5483–95. https://doi.org/10.1038/sj.onc.1205699 [PubMed]
- 17. Wu T, Dai Y. Tumor microenvironment and therapeutic response. Cancer Lett. 2017; 387:61–8. https://doi.org/10.1016/j.canlet.2016.01.043 [PubMed]